This article discusses the important concept of Bitcoin daily candle closes, detailing its significant impact on trading decisions and outcomes. The article emphasizes the importance of understanding the trading patterns surrounding the 00:00 UTC mark, which drives trading behavior and provides a strategic advantage in the crypto market, especially on Gate. The article conducts an in-depth analysis of daily candles, revealing how traders interpret market sentiment and price fluctuations through technical indicators. Aimed at both novice and experienced traders, this article offers actionable insights to leverage daily closing data to predict Bitcoin's next move, ultimately enhancing trading strategies and profitability.
Unveiling the Mystery of Bitcoin Daily Candle Closing: What Every Trader Needs to Know
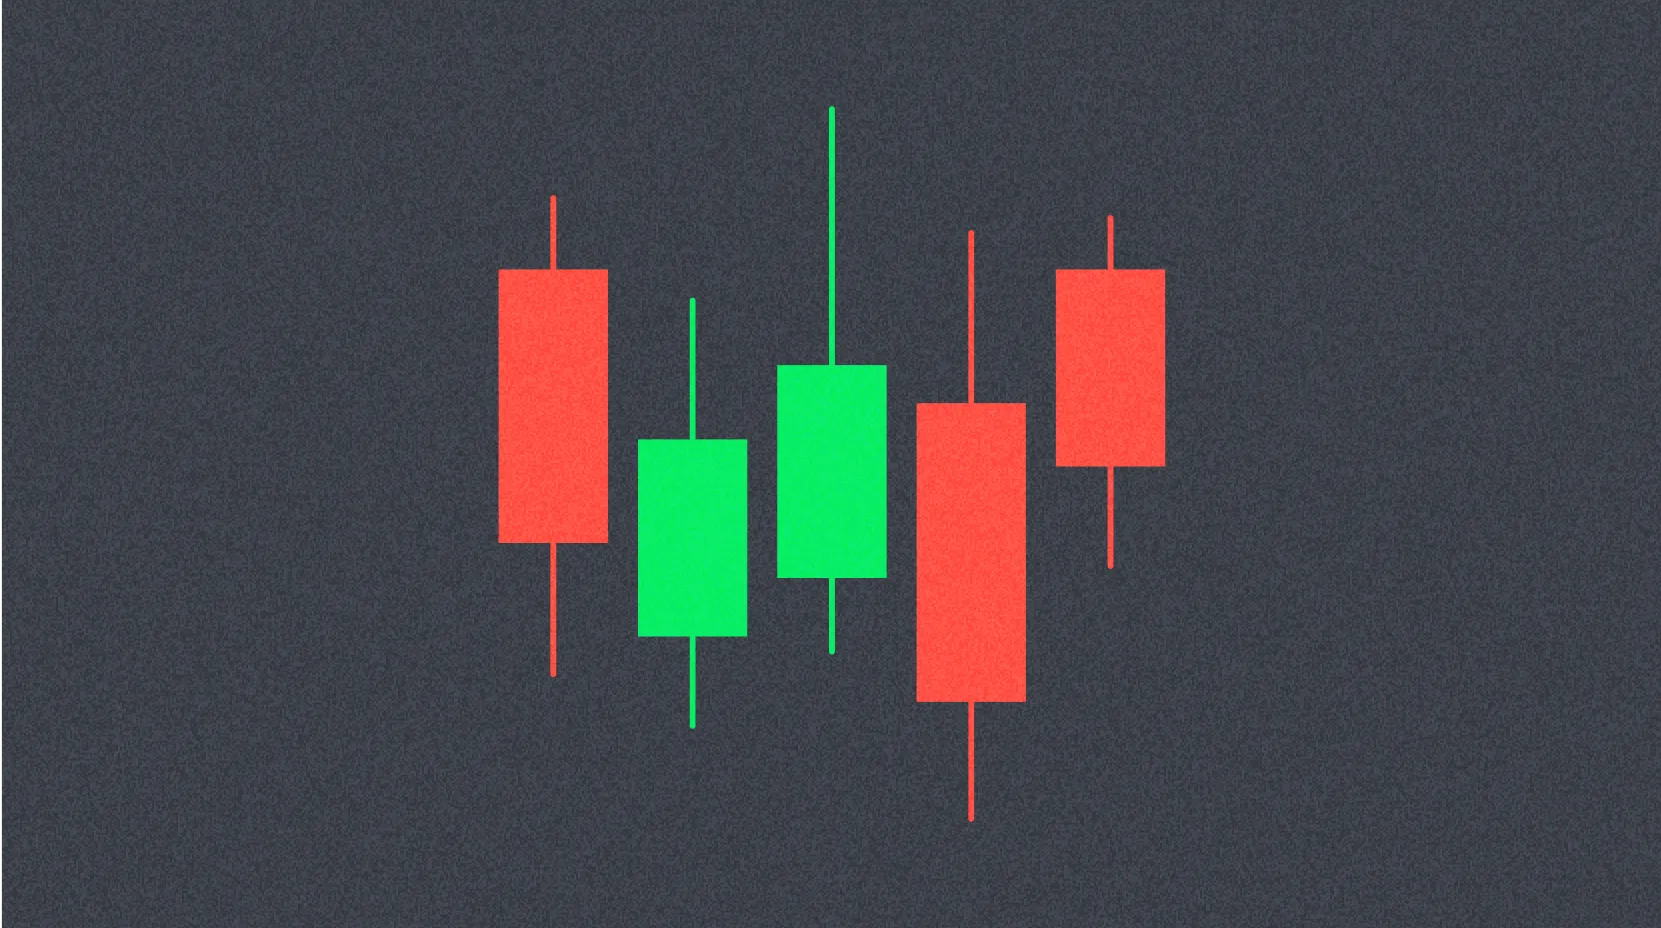
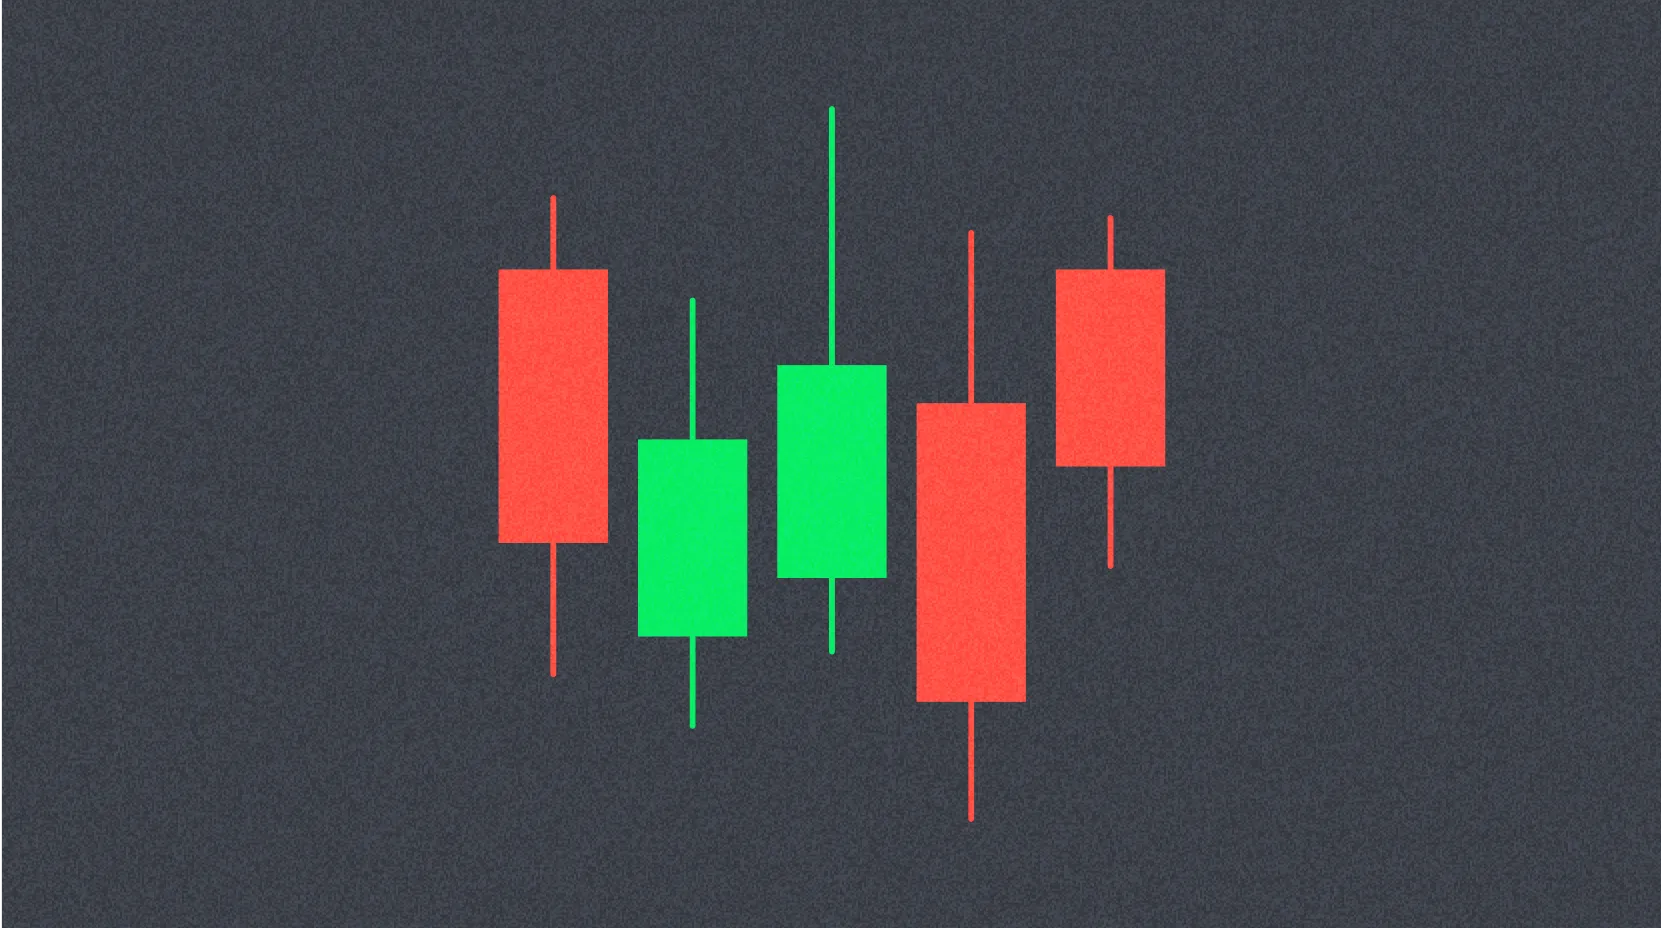
In the rapidly changing world of cryptocurrency trading, understanding the mechanisms behind Bitcoin's daily candlestick closing patterns can significantly impact trading decisions and outcomes. The daily candlestick represents a complete 24-hour trading cycle, capturing the opening price, closing price, highest point, and lowest point during that period. For serious traders, mastering these daily closing nuances provides key insights into market sentiment and potential price fluctuations, making it an essential skill for anyone looking to successfully navigate the increasingly volatile crypto market.
The Key Importance of 00:00 UTC in the Cryptocurrency Market
The world of cryptocurrency trading operates on standard time - 00:00 UTC (Coordinated Universal Time) - which serves as the universal daily closing time for major exchanges. Unlike traditional stock markets that operate within specific business hours, the digital currency market operates around the clock (24/7), necessitating a consistent reference point to mark the end of one trading day and the beginning of another. The standardization at midnight UTC (equivalent to 7:00 PM Eastern Standard Time) creates a focal point that influences market behavior in a predictable manner.
The importance of this timing should not be underestimated. According to market analysis data, trading volume typically increases by 27-35% in the hour before the daily close, as traders prepare for the next day's trades. The standardization of this timing has led to the development of specific arbitrage opportunities, especially during transition periods. Research shows that institutional traders have leveraged these patterns to achieve returns of up to 41.7% over the past few years, demonstrating the powerful impact of understanding these cycle transitions. Gate and other exchanges follow this standard time protocol to ensure consistency across the entire cryptocurrency ecosystem.
The precise mechanism for the daily closing of Bitcoin candles occurs after the first trade following 00:00:00 UTC, or if no trades occur within 14 seconds of the new day, it will automatically take place at 00:00:14. This specific implementation detail creates small opportunities, which complex algorithmic trading systems actively exploit, highlighting the importance of time precision in cryptocurrency trading strategies.
Master daily candle analysis to achieve profits in Bitcoin trading.
Daily candle analysis is the foundation of technical trading strategies in the cryptocurrency market. In Bitcoin price chart analysis, each candle reveals four key data points, telling the comprehensive story of market psychology over the 24-hour period. The relationship between these elements - opening price, closing price, high price, and low price - forms patterns that experienced traders can interpret to make informed decisions about market direction.
candle elementThe information providedTransaction significanceBody colorPrice trend directionBullish (green/white) or bearish (red/black) sentimentbody sizeIntensity of price fluctuationsThe level of belief among market participantsUpper shadowReject a higher priceSelling pressure at the upper horizontal levellower shadowReject low pricesBuy support at lower levels
Understanding these patterns takes time and practice, but the rewards can be substantial. Traders who master daily candlestick analysis report making more confident trading decisions, with an average win rate increasing to 62%, while those without this analytical framework have a win rate of only 47%. The daily time frame provides particularly valuable insights as it filters out the noise commonly found in shorter time frames, while capturing important market trends that may be mixed up in weekly charts.
Technical analysts pay special attention to the closing of cryptocurrency trading days, as the closing price represents the market's final judgment on the value for that day. A strong close near the daily high indicates that buyers maintained control throughout the trading process, while a weak close suggests that sellers held the upper hand. These sequences of daily closes form trend lines and patterns over time, forming the basis for many profitable trading strategies.
Using daily closing data to predict Bitcoin's next big move
Historical Bitcoin daily candle close data contains valuable information about cryptocurrency market cycles and potential future price fluctuations. Traders who systematically analyze this data can gain insights into possible market behaviors under similar conditions. Quantitative analysis shows that daily closes have historically exhibited certain regularities, which can be leveraged to gain trading advantages.
Data from the past decade of the cryptocurrency market cycles indicates that consecutive daily closing prices above key moving averages typically signal a continuation of a bullish trend, while the opposite pattern often indicates a bearish reversal. For example, when Bitcoin According to research on market data from 2017 to 2023, if the daily closing price remains above its 200-day moving average for at least 15 consecutive trading days, the average return over the following 30 days is 18.3%.
By incorporating daily closing analysis into trading strategies, Gate traders are able to identify key support and resistance levels, which often align with previous significant daily closing prices. These levels frequently become turning points in price movements, creating opportunities for entry and exit points in trades. The closing times of the cryptocurrency market often experience significant volatility as market participants compete for positions, forming recognizable patterns that savvy traders can identify and exploit.
* The information is not intended to be and does not constitute financial advice or any other recommendation of any sort offered or endorsed by Gate.