2025 GLMR Price Prediction: Expert Analysis and Future Outlook for Moonbeam's Native Token

Introduction: GLMR's Market Position and Investment Value
Moonbeam Network (GLMR) serves as an EVM-compatible blockchain operating as a parachain on the Polkadot network, enabling Ethereum-based applications to deploy seamlessly while providing developers with Solidity smart contract deployment, Web3-compatible APIs, oracle data, and Ethernet bridge functionality. Since its inception in December 2021, GLMR has established itself as a functional and governance token with multiple use cases including transaction fee payments, network staking, governance participation, and liquidity mining rewards. As of December 2025, GLMR's fully diluted market cap stands at approximately $29.31 million, with a circulating supply of approximately 1.03 billion tokens and a current price hovering around $0.02427. This token, positioned as a crucial bridge between the Polkadot ecosystem and Ethereum-based applications, continues to play an increasingly important role in enabling cross-chain interoperability and developer accessibility.
This article will provide a comprehensive analysis of GLMR's price trajectory and market dynamics, integrating historical performance patterns, market supply-demand fundamentals, ecosystem development initiatives, and broader macroeconomic factors to deliver professional price forecasts and actionable investment strategies for interested participants.
I. GLMR Price History Review and Current Market Status
GLMR Historical Price Evolution Trajectory
-
January 2022: GLMR reached its all-time high of $19.50 on January 11, 2022, following the successful launch of Moonbeam as a parachain on the Polkadot network starting December 17, 2021. The token experienced significant initial gains after winning the second slot auction through crowdfunding.
-
2022-2025: Following the all-time high, GLMR entered a prolonged bearish phase, experiencing substantial price depreciation throughout this period as the broader cryptocurrency market faced headwinds and investor sentiment shifted.
-
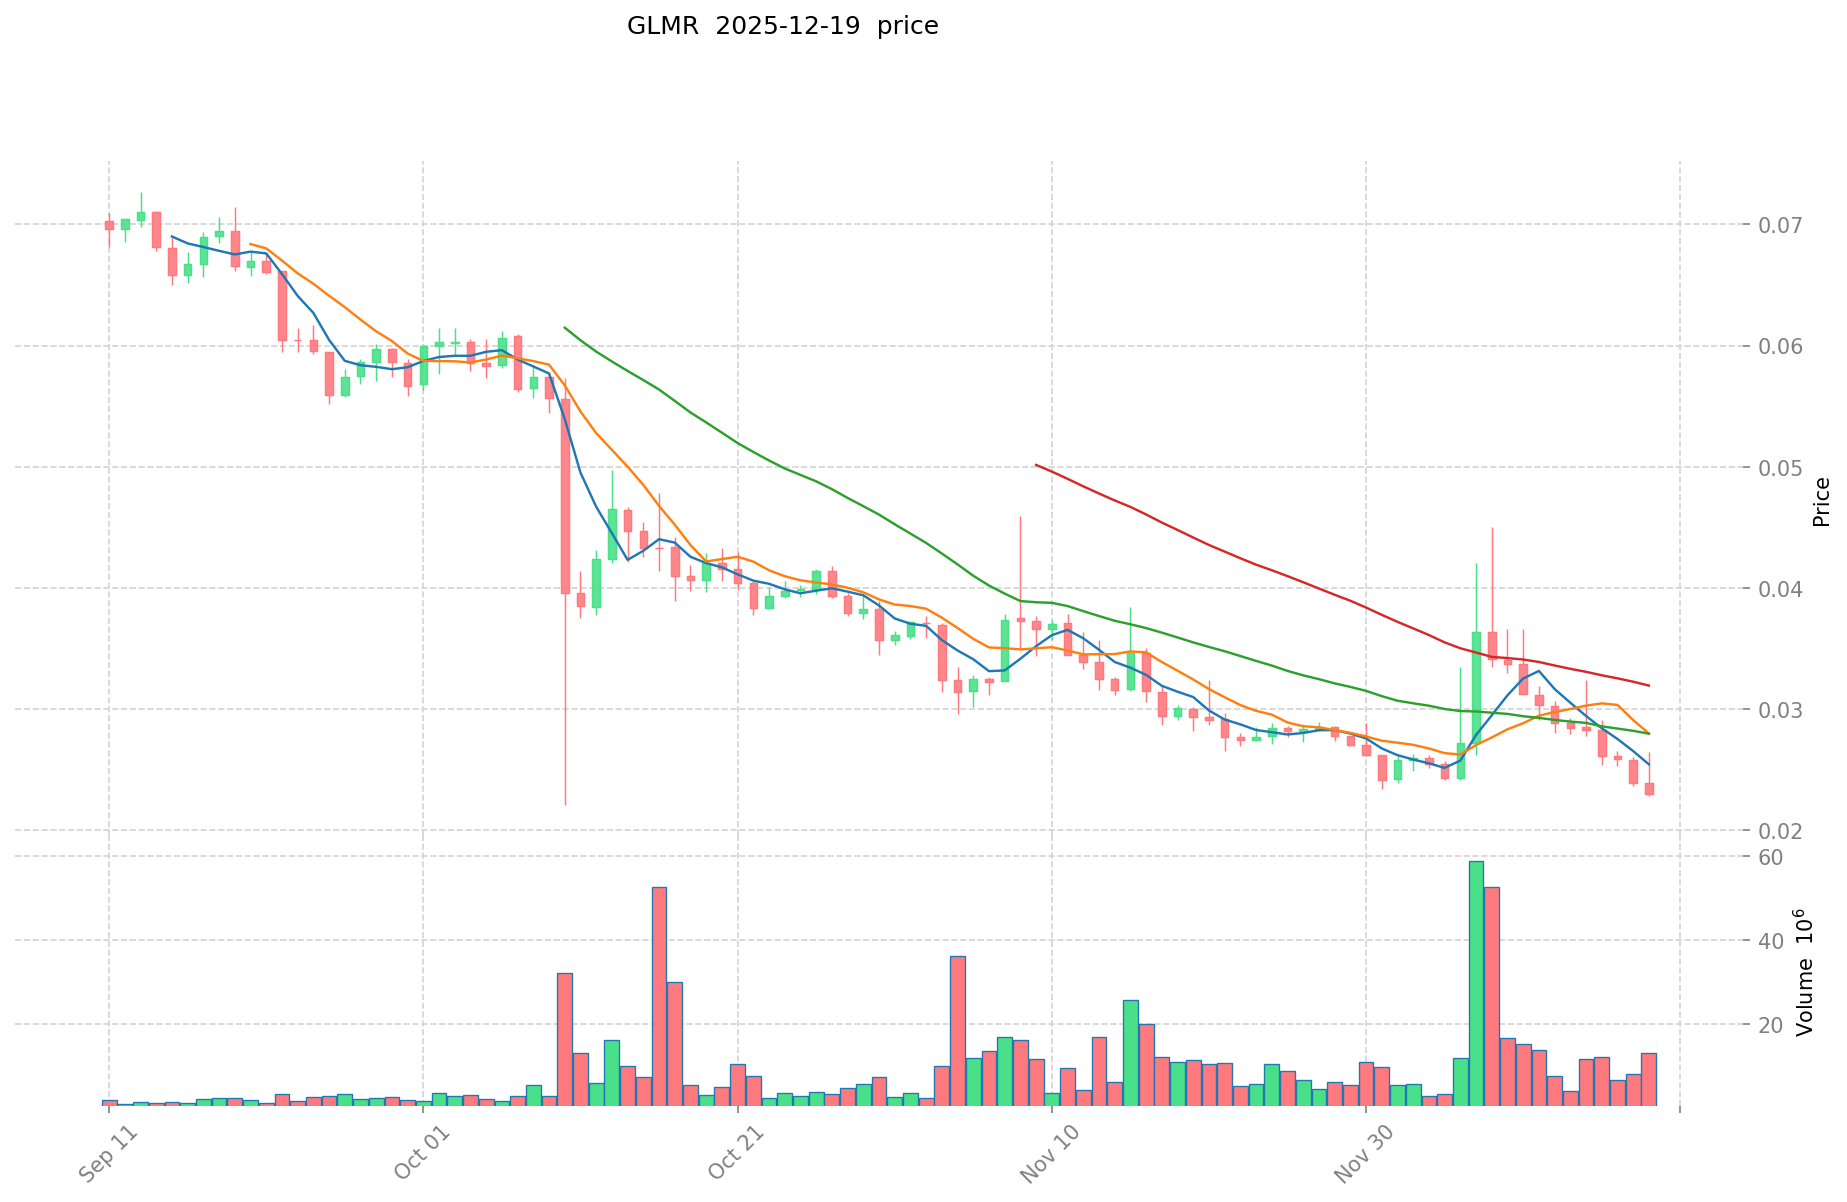
December 2025: GLMR reached its all-time low of $0.02279482 on December 19, 2025, representing a decline of approximately 90.63% from its all-time high over the three-year period.
GLMR Current Market Status
As of December 20, 2025, GLMR is trading at $0.02427 with a 24-hour trading volume of $131,941.48. The token demonstrates modest positive momentum in the short term, with a 5.25% gain over the past 24 hours. However, broader timeframe performance reveals significant headwinds: the token is down 16.32% over seven days and 16.6% over 30 days. The one-year performance shows a severe decline of 90.63%.
The current market capitalization stands at $25,113,055.80, with a fully diluted valuation of $29,314,549.21. The circulating supply comprises 1,034,736,539 GLMR tokens out of a total supply of 1,207,851,224 tokens, representing a circulation ratio of 85.67%. GLMR maintains a market dominance of 0.00091% and holds a ranking of 771 among all cryptocurrencies. The token is actively traded across 27 exchanges and has accumulated approximately 1,800,433 token holders.
The 24-hour price range fluctuated between $0.02271 and $0.02443, while the one-hour price action shows a slight decline of 0.21%.
Check current GLMR market price
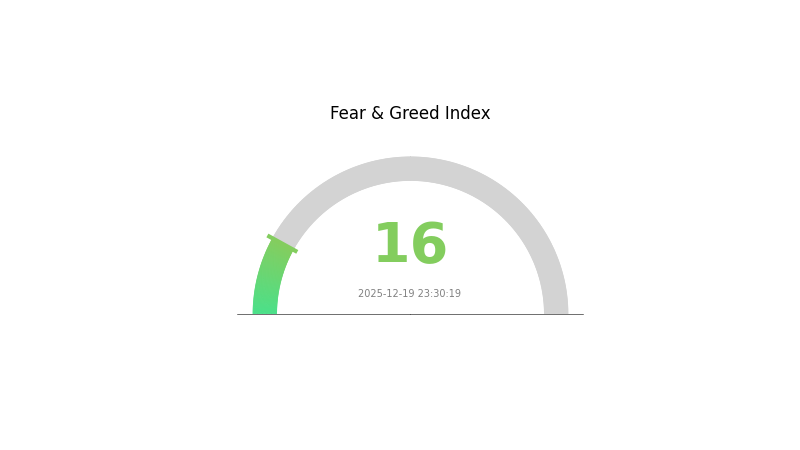
GLMR Market Sentiment Indicator
2025-12-19 Fear and Greed Index: 16 (Extreme Fear)
Click to view the current Fear & Greed Index
The GLMR market is experiencing extreme fear, with the Fear and Greed Index standing at 16. This significant downturn reflects heightened market anxiety and pessimism among investors. During such periods of extreme fear, contrarian investors often view this as a potential buying opportunity, as assets may be oversold. However, it is crucial to conduct thorough research and risk assessment before making investment decisions. Market volatility remains high, and cautious position management is recommended. Monitor key support levels and market developments closely for potential reversal signals.
GLMR Holdings Distribution
The address holdings distribution map represents the concentration of GLMR tokens across blockchain addresses, indicating how token ownership is allocated among different wallet addresses. This metric serves as a critical indicator for assessing the decentralization level, market structure stability, and potential vulnerability to price manipulation within the GLMR ecosystem.
Current analysis of GLMR's holdings distribution reveals a moderate concentration pattern. The top five addresses collectively hold approximately 28.26% of total token supply, with the leading address (0xf977...41acec) commanding 13.31% of all GLMR tokens. This distribution suggests that while significant ownership is concentrated in a limited number of addresses, the majority of tokens—approximately 71.74%—remain distributed among other holders, indicating a relatively dispersed ownership structure compared to highly centralized projects.
The existing concentration level presents a balanced risk profile for market dynamics. Although the top holder's 13.31% stake could theoretically influence short-term price movements through large transactions, the substantial proportion held by dispersed addresses (over 71%) provides sufficient liquidity depth and market resilience. This structure reflects a mature token distribution typical of established projects, where early investors and institutional participants maintain significant positions while broad-based community participation mitigates extreme centralization risks. The current holdings configuration demonstrates reasonable decentralization characteristics, supporting both market stability and governance resilience for the GLMR ecosystem.
Click to view current GLMR Holdings Distribution
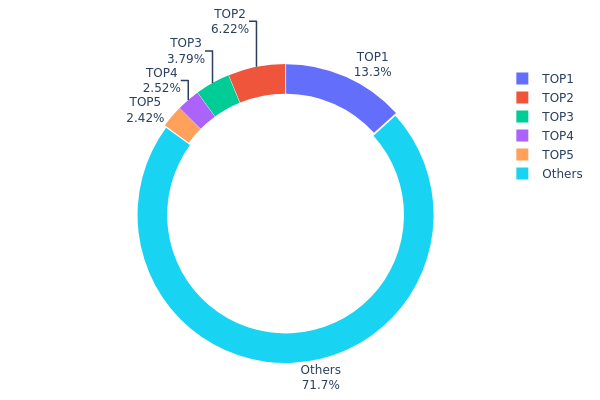
| Top | Address | Holding Qty | Holding (%) |
|---|---|---|---|
| 1 | 0xf977...41acec | 160818.15K | 13.31% |
| 2 | 0xf391...ce28ce | 75123.59K | 6.22% |
| 3 | 0x8ebb...6c4c34 | 45823.83K | 3.79% |
| 4 | 0xa557...a556f9 | 30435.20K | 2.52% |
| 5 | 0x44fd...9d3219 | 29268.38K | 2.42% |
| - | Others | 866245.38K | 71.74% |
II. Core Factors Influencing GLMR's Future Price
Supply Mechanism
-
Block Reward Halving: GLMR's price movement is driven by supply and demand dynamics, with block reward halvings and hard forks serving as significant factors that influence token availability and market conditions.
-
Current Impact: Supply adjustments through protocol changes directly affect the token's scarcity and pricing pressure in the market.
Ecosystem and Technology Development
-
Cross-Chain Capabilities: The adoption of Moonbeam's cross-chain capabilities is a major driver of GLMR's future price performance, as it expands the platform's utility and integration potential across multiple blockchain networks.
-
Ecosystem Growth: The expansion and development of Moonbeam's ecosystem system represents a key factor in determining price direction, with increased adoption and developer activity supporting long-term value appreciation.
Macroeconomic Environment
-
Regulatory Impact: Real-world events, including regulatory developments, government and corporate adoption trends, and regulatory progress in the cryptocurrency sector, significantly influence GLMR's price movements.
-
Market Sentiment: Investor sentiment and overall cryptocurrency market dynamics play a critical role in price volatility, with market demand and broader cryptocurrency trends affecting trading activity and valuation levels.
III. GLMR Price Forecast 2025-2030
2025 Outlook
- Conservative Forecast: $0.02357
- Neutral Forecast: $0.0243
- Optimistic Forecast: $0.02867
2026-2028 Medium-term Outlook
- Market Stage Expectation: Gradual recovery and consolidation phase with steady upward momentum
- Price Range Predictions:
- 2026: $0.02331 - $0.03205 (9% upside potential)
- 2027: $0.0199 - $0.03483 (20% upside potential)
- 2028: $0.02372 - $0.04262 (32% upside potential)
- Key Catalysts: Ecosystem expansion, increased network adoption, institutional interest in Polkadot parachain technologies, and macro market sentiment improvement
2029-2030 Long-term Outlook
- Base Case Scenario: $0.03472 - $0.0519 (53% upside potential by 2029), indicating sustained network growth and market maturation
- Optimistic Scenario: $0.02499 - $0.06559 (83% upside potential by 2030), contingent on broader Web3 adoption and successful Polkadot ecosystem integration
- Transformative Scenario: Enhanced price discovery driven by major partnerships, significant DeFi protocol launches on the network, or breakthrough developments in cross-chain interoperability solutions
Key Observation: GLMR demonstrates a consistent upward trajectory across the forecast period, with cumulative appreciation of approximately 83% from 2025 baseline to 2030, reflecting confidence in the project's fundamental positioning within the Polkadot ecosystem.
| 年份 | 预测最高价 | 预测平均价格 | 预测最低价 | 涨跌幅 |
|---|---|---|---|---|
| 2025 | 0.02867 | 0.0243 | 0.02357 | 0 |
| 2026 | 0.03205 | 0.02649 | 0.02331 | 9 |
| 2027 | 0.03483 | 0.02927 | 0.0199 | 20 |
| 2028 | 0.04262 | 0.03205 | 0.02372 | 32 |
| 2029 | 0.0519 | 0.03734 | 0.03472 | 53 |
| 2030 | 0.06559 | 0.04462 | 0.02499 | 83 |
Moonbeam (GLMR) Professional Investment Strategy and Risk Management Report
IV. GLMR Professional Investment Strategy and Risk Management
GLMR Investment Methodology
(1) Long-Term Holding Strategy
- Suitable Investors: Developers and ecosystem participants seeking exposure to Polkadot interoperability benefits; long-term believers in EVM-compatible infrastructure on Polkadot; institutional investors with extended investment horizons
- Operational Recommendations:
- Participate in network staking to earn GLMR rewards while maintaining long-term positions
- Monitor Moonbeam's development milestones and Polkadot ecosystem upgrades that may enhance network utility
- Gradually accumulate during market downturns, particularly given the 90.63% year-over-year decline from all-time highs
(2) Active Trading Strategy
- Technical Analysis Tools:
- Support and Resistance Levels: Monitor historical price points at $0.02279482 (all-time low on December 19, 2025) and $19.50 (all-time high on January 11, 2022) to identify potential reversal zones
- Volume Analysis: Track the 24-hour trading volume of $131,941.48 to identify liquidity breakout points and validate price movements
- Trading Operation Key Points:
- Execute positions during periods of increased trading volume to ensure adequate liquidity
- Set stop-loss orders at 10-15% below entry points given the high volatility demonstrated by year-long declines
GLMR Risk Management Framework
(1) Asset Allocation Principles
- Conservative Investors: 1-3% of total portfolio allocation
- Aggressive Investors: 3-8% of total portfolio allocation
- Professional Investors: 5-15% of total portfolio allocation with active rebalancing quarterly
(2) Risk Hedging Solutions
- Dollar-Cost Averaging (DCA): Deploy capital incrementally over 6-12 months to reduce exposure to short-term price volatility and accumulate at varying price points
- Diversification within Polkadot Ecosystem: Balance GLMR holdings with exposure to complementary projects to reduce single-project risk
(3) Secure Storage Solutions
- Cold Storage Method: Transfer GLMR tokens to self-custody solutions with enhanced security features for long-term holdings exceeding 90 days
- Exchange Custody Method: Maintain active trading positions on Gate.com with two-factor authentication (2FA) and withdrawal address whitelisting enabled
- Security Precautions: Never share private keys or recovery phrases; use hardware security keys for exchange accounts; verify official URLs before accessing wallets; enable IP whitelisting where available
V. GLMR Potential Risks and Challenges
GLMR Market Risks
- Severe Price Depreciation: GLMR has declined 90.63% over the past year, indicating substantial market sentiment challenges and potential continued downward pressure
- Low Trading Liquidity: With 24-hour volume of only $131,941.48, large position entries or exits may experience significant slippage and price impact
- Market Dominance Concentration: At 0.00091% market dominance, GLMR remains highly susceptible to broader cryptocurrency market corrections and risk-off sentiment
GLMR Regulatory Risks
- Polkadot Ecosystem Regulatory Uncertainty: Changes in regulatory treatment of Polkadot as a multi-chain platform could directly impact Moonbeam's operational framework and token utility
- Staking Rewards Classification: Regulatory jurisdictions may classify staking rewards as taxable income, affecting investor returns and participation incentives
- Cross-Chain Bridge Compliance: Enhanced regulation of cross-chain bridges could restrict interoperability features that provide Moonbeam's core value proposition
GLMR Technical Risks
- Parallel Chain Slot Dependency: Moonbeam's continued operation depends on maintaining its Polkadot parallel chain slot; loss of this slot would severely compromise network functionality
- Smart Contract Vulnerabilities: EVM compatibility introduces potential security risks inherent to Ethereum-based applications deploying on Moonbeam
- Ecosystem Development Stagnation: Limited developer adoption or slow growth in decentralized applications built on Moonbeam could reduce network utility and token demand
VI. Conclusions and Action Recommendations
GLMR Investment Value Assessment
Moonbeam presents a specialized infrastructure investment thesis centered on Polkadot ecosystem growth and EVM compatibility demands. The project's technical foundation remains sound, with approximately 1.8 million token holders demonstrating sustained community interest. However, the severe 90.63% annual price decline, minimal market dominance, and low trading liquidity present significant challenges. GLMR's long-term value depends on substantial increases in developer adoption, decentralized application growth, and broader Polkadot ecosystem expansion. Current market conditions suggest this is a high-risk, potentially high-reward asset suitable only for investors with substantial risk tolerance.
GLMR Investment Recommendations
✅ Beginners: Begin with minimal position sizing (0.5-1% portfolio allocation) through small regular purchases on Gate.com to develop understanding of Polkadot ecosystem mechanics and monitor development progress over 12+ months before increasing exposure
✅ Experienced Investors: Establish core positions (3-5% allocation) during sustained price consolidation periods; actively monitor governance participation and Polkadot ecosystem developments; implement systematic rebalancing to lock in any recovery gains
✅ Institutional Investors: Conduct comprehensive technical due diligence on Moonbeam's developer metrics and ecosystem growth; consider positions (5-10% allocation) as part of broader Polkadot infrastructure exposure; establish governance participation to influence network development
GLMR Trading Participation Methods
- Direct Exchange Trading: Execute spot purchases on Gate.com using market or limit orders; maintain liquidity reserves to capitalize on 15%+ price dips
- Staking Participation: Lock tokens as network validators or delegators to earn protocol rewards while maintaining long-term exposure; typical annual staking yields require verification on Moonbeam Foundation channels
- Governance Participation: Nominate council members and vote on network proposals to influence protocol development; governance participation may unlock additional incentive mechanisms
Cryptocurrency investment carries extreme risk. This report does not constitute investment advice. Investors must make decisions based on personal risk tolerance and financial circumstances. Always consult qualified financial advisors before committing capital. Never invest funds you cannot afford to lose entirely.
FAQ
Does Moonbeam have a future?
Yes, Moonbeam shows strong future potential through its innovative blockchain technology, active ecosystem development, and growing adoption in decentralized finance. Its continued technological advancement and community support position it favorably for long-term growth.
Is Moonbeam crypto a good investment?
Moonbeam crypto shows strong fundamentals and practical use cases, making it potentially attractive for long-term investors. Its ecosystem development and market adoption trends suggest good investment potential.
What will Beam be worth in 2030?
Based on expert analysis, Beam's price in 2030 is expected to range between $0.2925 and $0.3533, with an average prediction of $0.3029. This reflects positive market sentiment and potential growth trajectory.
Share
Content
Introduction: GLMR's Market Position and Investment Value
I. GLMR Price History Review and Current Market Status
II. Core Factors Influencing GLMR's Future Price
III. GLMR Price Forecast 2025-2030
IV. GLMR Professional Investment Strategy and Risk Management
V. GLMR Potential Risks and Challenges
VI. Conclusions and Action Recommendations
FAQ
How to Buy Cryptocurrency


Trending Cryptocurrencies


Bitcoin Cash Price Analysis: BCH Market Trends and Trading Strategies for 2025

Bitget Token Price 2025: Investment Analysis and Market Performance
Avalanche (AVAX) 2025 Price Analysis and Market Trends
Ethereum to AUD: What Australian Traders Need to Know in 2025
SEI Staking Analysis: 60-70% Supply Locked and Its Price Impact

Latest Analysis and Investment Outlook for Chainlink Price in June 2025
What Is Bitcoin Cash (BCH) Fundamentals: Whitepaper Logic, Use Cases, and Technical Innovation Explained?

Understanding Spot Liquidity in Cryptocurrency Trading
What is Bitcoin Cash (BCH) market cap and 24-hour trading volume in 2025?
How to Secure Your SEI Airdrop Rewards: A Step-by-Step Guide

How Does ZKP Community and Ecosystem Activity Impact Token Growth in 2025?