Square
Following
Hot
News
Profile
Share your thoughts
placeholder
Article
#Bitcoin drops below $83,000 as hotter-than-expected U.S. CPI data triggers a fresh sell-off across crypto markets.
Inflation at 3.7% is now the third-highest reading since September 2023, fueling expectations of further Fed rate hikes through 2027.
Higher rates could keep pressure on risk assets.
Will $BTC hold key support, or is more downside ahead ?
post-image
BTC-1.50%
$XRP XRP/USD Forecast: Price Tests Key Support at 1.3671
The XRP/USD pair has been trading mostly within the sideways range of 1.5625–1.3671 (Murray [8/8]–[6/8]) for more than two months, periodically attempting to leave it. At present, the quotes have reached its lower boundary, and after consolidating below it, a decline towards 1.2695 (Murray [5/8]) and 1.1718 (Murray [4/8]) is expected. However, if the price breaks above the middle Bollinger Band at 1.4648 (Murray [7/8]), growth may continue towards 1.6420 (Fibonacci retracement 61.8%), 1.7578 (Murray [+2/8]) and 1.9531 (Murray [5/8], W1).
post-image
XRP-1.65%
#USCPISoon #ShareWeekly
US September CPI data has been officially released by the Bureau of Labor Statistics and the numbers came in softer than market expectations across the board. Headline CPI printed at 3.2 percent year-over-year, down from the previous 3.4 percent reading. Core CPI, which excludes the volatile food and energy components, came in at 2.2 percent year-over-year, declining from 2.4 percent and marking the lowest core reading since early 2021. Shelter inflation eased to 4.6 percent from 5.0 percent. Energy inflation slowed to 4.1 percent from 5.6 percent. Food inflation moder
Intraday No. 5 bamboo basket
Small bamboo shoot exits; CPI data is about to be released, so staying on the sidelines for now, doing less and observing more.
4147 kong, 4152 bamboo shoot, -5 points, -594 oil. $XAU
XAU-1.74%
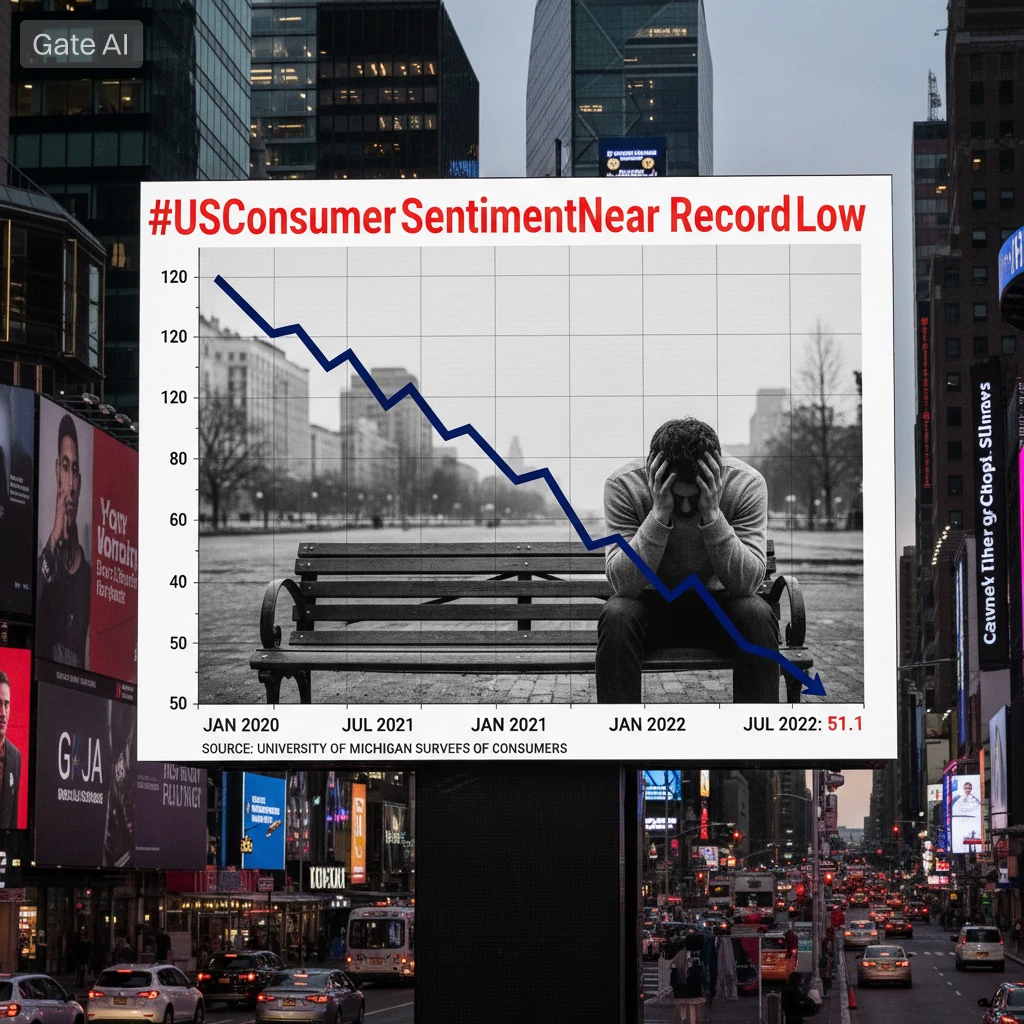
U.S. September CPI rises to 3.7%, putting Fed rate-hike pressure back on the table!
Tonight’s U.S. inflation data both came in above expectations, and markets are in for more pain.
September CPI rose year-on-year from 3.4% to 3.7%, above the expected 3.6%.
Core CPI rose from 2.4% to 2.6%, also exceeding the expected 2.5%. Overall CPI rose 0.6% month-on-month, putting the inflation rebound squarely on the table.
This time, energy was the main culprit. Gasoline prices surged 9.1% in September alone, contributing more than half of the overall monthly CPI increase, while energy prices rose 20.4% y
GAS-2.69%
$AMD is approaching a potential breakdown area, where a loss of upward momentum could create an opportunity for a move lower.
Trading Ideas Short $AMD
Entry: 583.00 - 595.00
SL: 658.50
TP1: 570.00
TP2: 550.00
TP3: 525.00
AMD is down 3.09% today at $586.80, and the chart is flashing clear bearish signals. The price is trading below all three key moving averages: MA5 at $594.35, MA10 at $607.28, and MA30 at $618.65. That is a textbook bearish alignment, with the shorter-term MAs stacked below the longer-term ones. The MACD histogram is deeply negative at -7.36, with DIF at 0.02 below DEA at 7.3
post-image
AMD-3.39%
Privacy coins are green while the market waits for CPI.
ZEC is up +6.1% in 24 hours, now trading at $1,250 and ranked #10 by market cap.
XMR +5.2%, now $556.
ZEC is still 61% below its high of $3,192.
Real rotation or just a bounce into CPI?
post-image
ZEC-0.21%
XMR+0.00%
🔴 LIVE AT 6:04 PM! ₿ | BITCOIN MARKET UPDATE TODAY 📊
🚀 What's Next for Bitcoin?
Bitcoin's market direction is always changing! Is BTC preparing for a bullish breakout, or could sellers push prices lower? Let's discuss the latest market trends and what traders should watch.
🔥 Join my livestream to discuss:
🔹 BTC Price Action: What could Bitcoin's current trend tell us about its next move?
🔹 Bullish vs. Bearish Signals: Are buyers gaining strength, or are sellers still in control?
🔹 Support & Resistance: Which key price levels should traders watch?
🔹 Market Sentiment: How are traders rea
post-image
BTC-1.50%
  • 2
🚨 US CPI came in a touch hotter than expected.
Core CPI month-over-month 0.3 versus 0.2 forecast.
Core year-over-year 2.6 versus 2.5.
Headline month-over-month matched at 0.6, but headline year-over-year was 3.7 versus 3.6.
That leans mildly hawkish for the Fed, supports yields and the dollar, and adds near-term pressure on BTC and gold. Watch DXY and yields before chasing a move.
post-image
BTC-1.50%
BREAKING: 🇺🇸 US September CPI rises to 3.7%, above the 3.6% forecast.
Inflation is running hotter than expected, potentially adding pressure on the Fed’s rate-cut outlook.
Markets are watching closely.
post-image
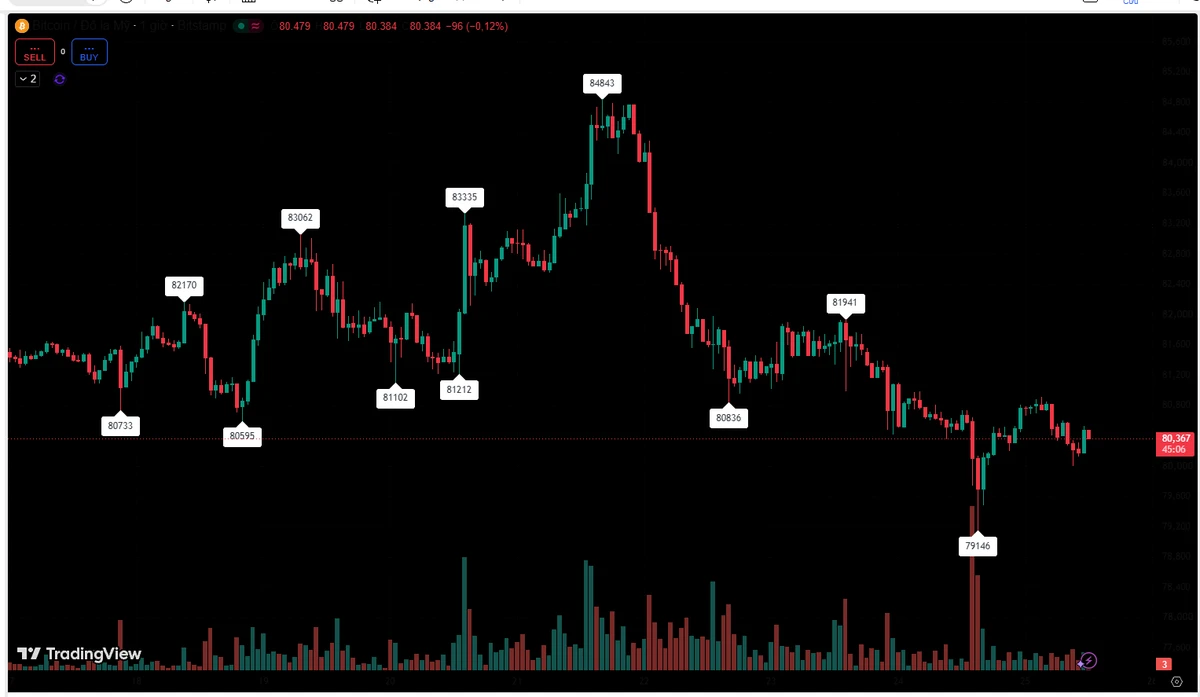
After the CPI was released, it instantly dropped 1000 points—this scene was indeed quite intense. But judging from today’s market action, the main driver of the decline may not have been the CPI itself, but rather the resonance between external sentiment and liquidity conditions. Long positions are still open; today’s script is to fall first and then rise. A pullback is an opportunity: add below 82000 and defend at 81000
post-image
CPI data - tonight. BTC / ETH Market Updates
live-cover
LIVE2,997
  • 1
$RLC Current price is 0.8401. The first resistance above is at 0.8532 (the lower Bollinger Band), while support below can be referenced at the 0.80 round-number level. The reason for giving these two levels first is that the current structure has already broken down, so waiting for a rebound is preferable to chasing shorts.
First, the method: to determine whether a trend is healthy, I only look at two things—the moving average arrangement and the RSI position. In a healthy downtrend, MA5 must continuously suppress MA20, while RSI remains subdued below 40 for an extended period. $RLC Currentl
post-image
RLC-8.11%
AVA+12.58%
Today’s English teacher bot
The goal is to get me to describe the market in English
With the market like this today
I feel like I’m going to say it through tears
The blockchain is killing people
How do I say that
😭
post-image
Huitong News, October 14 — On Wednesday (October 14) at 20:30 Beijing time, the U.S. Department of Labor released the September Consumer Price Index. According to the data, the indicator rose 3.7% year on year, higher than August’s 3.4% and slightly above the market-wide forecast of 3.6%. The result was immediately reflected in the global asset pricing system.
On Wednesday (October 14) at 20:30 Beijing time, the U.S. Department of Labor released the September Consumer Price Index. According to the data, the indicator rose 3.7% year on year, higher than August’s 3.4% and slightly above the mark
$WAL WALUSDT Forming Bullish Momentum
WALUSDT is forming a clear bullish momentum pattern, a classic bullish reversal signal that often indicates an upcoming breakout. The price has been consolidating within a narrowing range, suggesting that selling pressure is weakening while buyers are beginning to regain control. With consistent volume confirming accumulation at lower levels, the setup hints at a potential bullish breakout soon. The projected move could lead to an impressive gain of around 70% to 80% once the price breaks above the wedge resistance.
This bullish momentum pattern is typical
post-image
WAL+34.14%
Load More

Join 40 M users in our growing community

⚡️ Join 40 M users in the crypto craze discussion

💬 Engage with your favorite top creators

👍 See what interests you

Trending Topics

USSeptemberCPITopsEstimates

35.38k Views2.21k Discussing

US September CPI rose 3.7% YoY, above the 3.6% estimate; core CPI rose 2.6%, also above the 2.5% estimate. With inflation topping forecasts across the board, how will rate hike expectations shift? How will BTC react? Share your view.

DrLinHanSpeaksAtOxfordUnion

134.92k Views1.85k Discussing

GateWCTCS9GlobalTradingCompetition

37.14k Views6.06k Discussing

View More