Share your thoughts
placeholder
Article
Everyone’s staring at $BTC /USDT’s range—but the 4h clock just started ticking for a trap.

$BTC /USDT - SHORT

Trade Plan:
Entry: 79474.9 – 79706.1
SL: 80699.9
TP1: 78758.5
TP2: 78203.8
TP3: 77371.8

Why this setup?
Why now? The 1D trend is sideways, yet the 4h MTF flips SHORT at 79,590 with only 55% conviction. RSI 15m sits at 47.8—no momentum, just drift. ATR 1h at 462 means we’re in a compression coil. Entry zone 79,474–79,706 is the line: break below 78,975 invalidates the short fast, but hold here and TP1 at 78,758 is a 1% scalp before the real drop to 77,371. This isn’t a trend trade
BTC-2.04%
Does $BSV Bsv have a trend similar to ZEC? 🤦🤦🤦
BSV+0.35%
#HYPEBreaks88HitsNewAllTimeHigh
🔥 HYPE AT $83.98 — PULLBACK OR THE NEXT OPPORTUNITY BEFORE $100?
$HYPE has just given traders a very interesting setup.
After breaking into a fresh all-time-high zone near $88, HYPE has now pulled back toward $83.98. At first glance, some traders may see this as weakness, but I think the more important question is whether this is simply a healthy cooling-off phase after a powerful breakout.
HYPE recently reached a new record around $88.06–$88.14, while the current market is sitting near the $84 area. The latest 24-hour range has also shown strong volatility, w
HYPE-2.85%
#GateTops7DayNetInflowsGlobally
🚀 Gate’s Capital-Flow Momentum Is Getting Harder to Ignore
In crypto, price charts often get all the attention. Green candles, new highs, sudden corrections, and market sentiment dominate the conversation.
But there is another metric I believe traders should watch closely: capital flows.
Recent market-flow data has placed Gate among the leading global centralized exchanges, with approximately $300.43 million in seven-day cumulative net inflows. Another recent snapshot showed around $48.54 million in net inflows over 24 hours.
These numbers represent significan
BTC-1.99%
ETH-2.20%
Everyone’s fading SKYAI—but the 4h chart just whispered a secret that 95% of traders missed.

$SKYAI /USDT - SHORT

Trade Plan:
Entry: 0.05654 – 0.05715
SL: 0.05978
TP1: 0.05465
TP2: 0.05319
TP3: 0.05099

Why this setup?
Why now? The daily trend is bearish, but the 4h setup is screaming *exhaustion*—not continuation.
- RSI 15m at 50.13: dead center, no momentum to push higher.
- ATR 1h (0.00122) is tight—volatility is coiling, and coils snap.
- Entry ref 0.05685 sits right under invalidation 0.05784; if we reject there, TP1 (0.05465) is a 3.8% drop, TP2 (0.05319) is 6.4%.
- Confiden
SKYAI-2.05%
$$Lobster's 29% gain: 87M in trading volume shows you what turnover-based distribution looks like
The price of 0.0938 is stuck between 0.1027 and 0.0711, with trapped holders above and profit-taking holders below. Going long here is just handing fees to the market maker. My system shows that the 0.0711–0.1027 range has already seen massive volume, but the price has failed to make a new high—a textbook distribution structure.
Here's the trading plan: Entry zone: enter only after a pullback to 0.084–0.086 holds; abandon the trade if it breaks 0.083. Stop-loss: 0.0805 (hard stop; a break below me
龙虾+20.94%
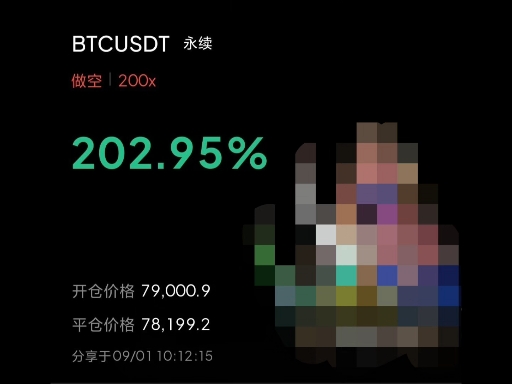
This return has me feeling terrified, afraid the market will come to its senses tomorrow and blacklist me. When it plunged intraday, I just kept my eyes on the chart and did nothing. Why? Because I knew this drop wasn’t over yet. Selling pressure was strong, volume was shrinking, and the rebounds were all fake.

Shorted at 0.21138, just checked—0.1298, +946.39% secured. I had no conviction and couldn’t hold it; the profit on this move was thin as paper, but I loved every bit of it. Any profit you can take away is good profit.

+946.39% position closed, profits locked in. I’ve set a stop-loss
post-image
LAB+1.14%
ADA-4.18%
[New Streamer] Market Prediction
live-cover
LIVE978
PARABOLIC SEASON LOADING 🚀🚀
BE READY🤯🤯
#shillb#crypto
post-image
No execution, no analysis—just sheer luck. Even saying these results out loud feels embarrassing. During the intraday plunge, $SHEIN actually made plenty of fake moves, but I focused on just one thing: low trading volume, a weak rebound, and no buyers on the way up—that’s a breeding ground for bears. When it bounced back to 6.624, I entered a short position without hesitation.

Now? 4.943, +251.69%. It really dragged at first, but the result feels great.

Even if you only catch one wave, as long as you can take the profit with you, it’s yours; no matter how much floating P&L there is, that b
post-image
SHEIN-8.39%
LAB+1.14%
BNB-1.00%
Why did I stay with Gate? Because it is “growing”
Many people ask me: With so many exchanges, why did you stay with Gate?
My answer is very simple: because I’ve watched it grow.
When I registered last year, Gate seemed to have just over 50 million users. It surpassed 51 million in March this year, reached 53 million in April, and 58 million at the end of Q2. It has now officially surpassed 60 million. Nearly 10 million users were added in six months. That pace makes me feel—I chose the right platform.
And it’s not just that the number of users is growing; the products are expanding too. From c
TSLA-5.96%
$PUMP I’m bullish. Whales’ long-to-short ratio is 2.59 times that of retail traders, and the gap is right there—the price is 0.00421, down 23% from the 90-day high, yet retail traders are still desperately piling into short positions while whales are taking the opposite side and going long. The $93.0M in futures open interest also shows that the positions haven’t dispersed; this isn’t an abandoned market. Over the next 24 hours, I expect a bullish, consolidating range with limited downside, looking more like a gradual grind designed to wear down retail shorts. The 2.59x gap is right there, and
post-image
PUMP-0.79%
They say privacy coins quietly make big money — this time ZEC quietly hit a “10-year high.”
Yesterday it was still the invisible man of crypto; today the entire market is shouting its name. Low-key? Not a chance— even $1,000 couldn’t hold it back.

On the surface: ZEC broke above $1,000, hitting a nearly 10-year high, with privacy coins rallying across the board.
In reality: Gate spot $1,016.73 (24H +7.57%), perpetuals $1,015.81—the surge is real, but this was an “event-driven + short squeeze” frenzy, not a healthy bull market that climbed gradually.
Within a single day, the high was $1,050 a
post-image
ZEC+7.58%
TSLA-5.96%
Scumbag Watch Episode 4, 26.9.05, Beijing time 8:30
Figure 1: CRCL daily candlestick chart
U.S. stock closing price: 102.05; intraday high: 102.785; low: 97.10; down 1.14%
CRCL opened lower and moved higher yesterday. It still looks relatively strong for now. After filling the small gap around 104, another push toward 120 is not out of the question.
Figure 2: SOL daily candlestick chart
SOL closed above the 5-day moving average. Going forward, continue to monitor whether the 100 level will be decisively broken below again.
CryptoPlayerWithBadIntentions
Jerk Watch, Issue 4, 26.9.04 Beijing time 8:15
Figure 1: CRCL daily candlestick chart
U.S. stock market closing price: 103.23; intraday high: 103.28; low: 91.70; up 16.46%
As the jerk expected, crcl has no problem as long as it does not effectively break below the large bullish candlestick formed previously.
But today's performance did exceed the jerk's expectations, rising over 16% and nearly closing at the high. It completely made it impossible to get on board. So whether it can directly challenge the 150 level next, please wait and see patiently.
Figure 2: SOL daily candlestick chart
After sol found support at the upper boundary of the range, today's daily close provided strong confirmation. We will wait and see whether it will challenge the previous high again next.
Currently, crcl has also broken through the 100 mark. Of course, the SOL line was the one that reached the 100 mark.
The jerk is now launching a new prediction: which one will be the first to reach 150? Leave a comment and repost to participate.
Total prize pool: 200U
repost-content-media
CRCL-1.17%
SOL-2.00%
Just after seeing the bearish news, I thought this move was completely over, but it turned out to be even better at putting on an act than I am. While everyone else was running, $US quietly pushed higher, but volume failed to follow, and every surge seemed to lack that final bit of momentum. I judged it to be one last bull trap and went straight short at 0.017604. Now look at it: the current price is 0.016193, with a return of +157.48%. This grind was not in vain.
Those already on board should be laughing in their sleep, while those who missed the ride shouldn't beat themselves up. Close 70%
post-image
US-3.60%
SOL-1.99%
BNB-1.00%
If you didn’t know
@clementetv_ and @piovincenzo_ are killing it on Instagram
post-image
After $DOGE , #SHIB , $PEPE
WHO IS NEXT #100x IN 2026???
post-image
DOGE-3.37%
SHIB-3.02%
PEPE-5.26%
IN+2.35%
Everyone’s watching XRP’s rebound—but this 4h chart is screaming something else entirely.

$XRP /USDT - SHORT

Trade Plan:
Entry: 1.3900 – 1.3976
SL: 1.4300
TP1: 1.3667
TP2: 1.3486
TP3: 1.3215

Why this setup?
- Price is pinned at 1.3938 with a hard ceiling at 1.4057—that’s your invalidation line.
- RSI (15m) at 38.82 shows momentum is fading, not flipping.
- ATR (1h) of 0.015 suggests low volatility = compressed spring, but direction remains SHORT with 55% confidence.
- The range-bound 1D trend means we’re not breaking out; we’re rejecting.
- Why now? Because 1.3900–1.3976 is the l
XRP-3.62%
Layout for Bitcoin, Ethereum, and Dogecoin
live-cover
LIVE1,778
Who is actually buying this shit and why?
post-image
Load More

Join 40 M users in our growing community

⚡️ Join 40 M users in the crypto craze discussion

💬 Engage with your favorite top creators

👍 See what interests you

View More