




Share your thoughts
placeholder
Article
Everyone’s long SNDK, but the 4h chart just whispered a secret the crowd missed.

$SNDK /USDT - SHORT

Trade Plan:
Entry: 1762.72 – 1768.80
SL: 1794.96
TP1: 1743.86
TP2: 1729.26
TP3: 1707.36

Why this setup?
- RSI 15m at 62.25 shows fading momentum, not strength.
- ATR 1h at 12.16 means volatility is tight—waiting to snap.
- Price pinned at 1765.76 with TP1 at 1743.86: a clean 1.2% drop zone, no noise.
- Why now? Range-bound 1D trend + SHORT bias = mean reversion is the only game in town.

Debate:
Is the 1768.80 high the bull trap that sends us to TP1, or do we fade the fade?

⚠️ Pe
SNDK+2.93%
#交易機器人 I’m using the DOGEUSDT futures grid bot on Gate—come copy-trade with me!
post-image
I just casually hit refresh, and it went up on its own, leaving me in a very passive position. $BCH was incredibly decisive this time. After placing the order at 247.31, I barely checked it. The last time I looked before bed, it was still moving sideways, but now it’s directly showing 257.68, with a +294.29% profit. It feels like the market is chasing me to feed me.

I noticed it during the repeated intraday swings: someone stepped in to buy every dip, and the key levels were gradually moving higher. If that wasn’t a shakeout, what was it? I even specifically mentioned at the time: the more s
post-image
BCH+2.05%
BNB+8.14%
ETH+1.09%
Most traders still ignore $ZEC /USDT, but the 4h tape is about to force a decision.

$ZEC /USDT - LONG

Trade Plan:
Entry: 1023.94 – 1032.34
SL: 987.80
TP1: 1058.39
TP2: 1078.56
TP3: 1108.81

Why this setup?
- 1D trend is bullish, and the 4h setup is armed with 95% confidence—this isn’t a coin flip.
- RSI (15m) at 60.08 shows momentum building, not exhausted—room to run before overbought.
- ATR (1h) at 16.8 means volatility is alive; entry zone 1023–1032 is tight, but TP1 at 1058 is only 3% away.
- Why now? Price is coiling under resistance with a clear invalidation at 987—risk is def
ZEC-0.29%
Everyone’s watching ADA’s 15m RSI scream at 70—but the 4h chart is whispering a dirty secret nobody wants to hear.

$ADA /USDT - SHORT

Trade Plan:
Entry: 0.2177 – 0.2189
SL: 0.2237
TP1: 0.2142
TP2: 0.2115
TP3: 0.2075

Why this setup?
Why now?
- 1D trend is a **range**, not a breakout—mean reversion is the game.
- RSI 15m at 70.55 = overheated micro-spike, ripe for a snapback.
- ATR 1h (0.002252) tells us volatility is thin—traps are cheap to set.
- Entry ref 0.2183 with TP1 at 0.2142 (1.9% drop) is the low-hanging fruit, not the moon shot.

Debate:
Is this a fake pump to short int
ADA+3.43%
Everyone is long LINK while the 4h chart whispers a different story.

$LINK /USDT - SHORT

Trade Plan:
Entry: 12.056 – 12.108
SL: 12.401
TP1: 11.843
TP2: 11.684
TP3: 11.445

Why this setup?
Why now?
- 1D trend is bullish, but the 4h signal says SHORT with 84% confidence—that’s a serious divergence.
- RSI on the 15m is at 62.54, showing short-term momentum is cooling off right at the 12.082 resistance zone.
- ATR (1h) at 0.102 means tight stops—we’re coiling, and the first target is 11.843, a quick 2% move if the rejection holds.
- The setup is waiting, not triggered—so the risk/rewa
LINK+3.11%
Everyone’s staring at SNDK’s pump, but the 4H chart just whispered a secret that could erase your morning gains.

$SNDK /USDT - SHORT

Trade Plan:
Entry: 1761.28 – 1767.54
SL: 1803.50
TP1: 1735.09
TP2: 1715.54
TP3: 1686.22

Why this setup?
- RSI 15m is at 62—overbought *within* a 1D range, not a breakout.
- Price is pinned at 1764.41 (entry ref) with ATR 12.53: that’s a tight spring, not a launchpad.
- Why now? The range top rejects shorts at 77% confidence—the same zone that’s failed 3 times in the last 48h.
- TP1 at 1735 is only 1.6% away; TP2 at 1715 is the real magnet if 1767.54 h
SNDK+2.93%
Once this shot is fired, there will still be opportunities later—don't rush.

$XRP $ZEC
post-image
XRP+1.37%
ZEC-0.29%
Silver’s 15m RSI is screaming overheated at 68.7—but the 4h chart just whispered a secret no one’s listening to yet.

$XAG /USDT - SHORT

Trade Plan:
Entry: 66.28 – 66.34
SL: 66.63
TP1: 66.07
TP2: 65.92
TP3: 65.68

Why this setup?
Why now? The 4h bias flips SHORT (55% confidence) while the 1D stays range-bound—a classic squeeze setup.
- Price parked at 66.31, with entry tight between 66.28–66.34.
- TP1 at 66.07 is only 0.36% away—low-hanging fruit for scalpers.
- RSI 15m at 68.7 means momentum is stretched; gravity tends to win in ranges.
- SL at 66.63 caps risk at 0.48%, while TP3
XAG+0.33%
I did nothing—just went to the bathroom, and when I came back, the candlestick had already done the work for me. When the market dumped early, I glanced at the volume: the rebound was weak, overhead resistance was obvious, and every push upward fell just short. This isn’t what strength looks like; it’s fuel for the shorts.

$ZEC $SOL
post-image
ZEC-0.29%
SOL+2.21%
9.6 DASH Coin Analysis
Put simply, DASH’s surge this time was driven by the Grayscale Zcash ETF taking off, with funds moving through privacy coins one by one and DASH, as an established leader, getting picked next. Technically, it formed a golden pit at 54.15 (below the Bollinger lower band at 62.32), followed by a large bullish candle that surged straight to 74.63—the textbook “whale accumulation–violent rally–breaking away from cost basis.” The price is now pulling back to the middle band at 67.45, while the MACD golden cross remains in place (0.09). The bulls are not completely dead, but $
post-image
DASH+24.22%
ZEC-0.26%
Most traders will fade this 95% confidence SHORT on $SKYAI /USDT—that’s exactly why you’ll win.

$SKYAI /USDT - SHORT

Trade Plan:
Entry: 0.05937 – 0.05999
SL: 0.06263
TP1: 0.05747
TP2: 0.05600
TP3: 0.05379

Why this setup?
- 4h MTF says SHORT, 1D trend is bearish—this isn’t a scalp, it’s a structural dump.
- RSI 15m at 51.85 is neutral, giving price room to drop without being oversold.
- Entry ref 0.05968, SL at 0.06263 (risk ~4.9%)—but TP1 at 0.05747 is a 3.7% move, TP3 at 0.05379 is a 9.8% drop.
- ATR 1h at 0.001228 means volatility is low—breakdowns here tend to be fast and violen
SKYAI+8.37%
Everyone’s long PEPE while the 4h chart whispers a different secret.

PEPE/USDT - SHORT

Trade Plan:
Entry: 0 – 0
SL: 0
TP1: 0
TP2: 0
TP3: 0

Why this setup?
- Signal says SHORT with 55% confidence—not a scream, but a warning.
- 1D trend is *range*, not breakout—so buying tops here is gambling.
- RSI on 15m at 57 shows a dead bounce, no fuel for a push higher.
- Why now? The “waiting” status means the trap is set—patience beats impulse.

Debate:
Are you fading this range or riding the fakeout—what’s your PEPE play before 19:00 UTC?
PEPE+2.00%
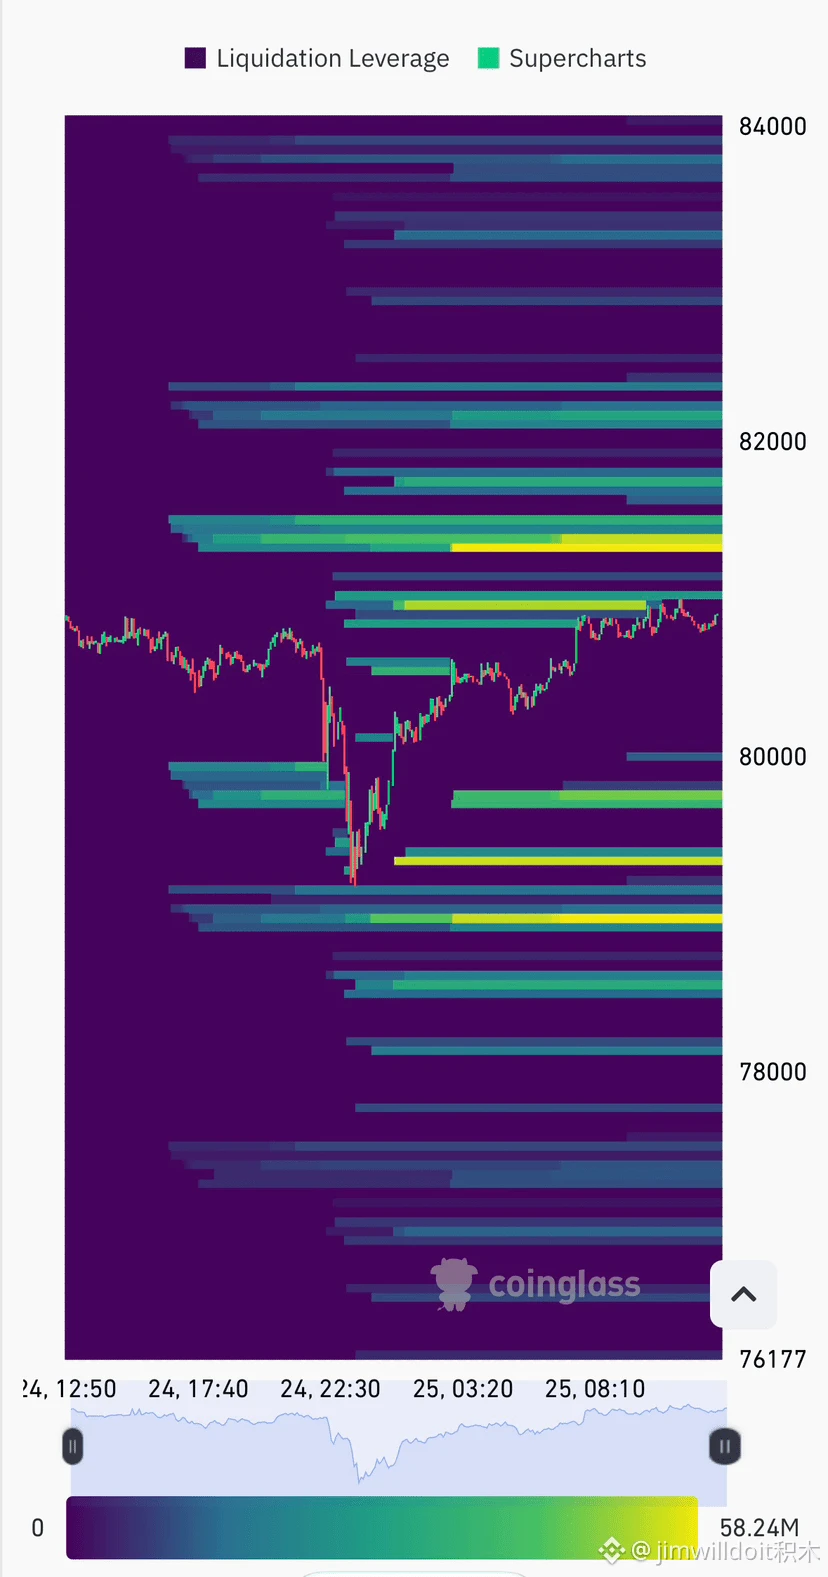
The direction was right, and people hand you money even while you lie down. A few days ago before bed, the market had not fully started moving yet. I noticed the pullback gradually reclaiming key levels, while funds quietly entered without disturbing the candlesticks—clearly an accumulation move. After making the judgment, I placed an order directly at 77967.8 before bed. When I got up in the morning, it had steadily reached 80036.3, $BTC directly delivering +461.72%. The position adjustments have been made: prioritize taking profit on 75% to lock in gains, and move the remaining 20% up to br
post-image
BTC+0.44%
BNB+8.14%
SNDK+2.93%
I only meant to snag a free breakfast, but the market ended up making dumplings out of me for half a year.
When $BE was grinding along around 200.9 intraday, it stayed flat long enough to nearly put me to sleep, but there was clearly buying support below and the low-volume selling couldn’t push it down. I judged that the bottom was solidified and entered a long position directly, without hesitation.
I just checked the chart, and the price has already surged to 265.1, +1537.65%. This bite of meat feels great—those already on board should have woken up laughing.
Take 80% off the table first, an
post-image
BE+8.82%
ZEC-0.29%
SNDK+2.93%
It is never wrong to rely on yourself rather than others.
A trader made two “FOMO” trades in one day, accumulating losses of $907,000
live-cover
LIVE1,399
Everyone’s waiting for a bounce, but 95% confidence says ESPORTS is about to bleed lower.

$ESPORTS /USDT - SHORT

Trade Plan:
Entry: 0.01478 – 0.01486
SL: 0.01524
TP1: 0.01450
TP2: 0.01429
TP3: 0.01397

Why this setup?
Why the rush? The 4h structure is bearish with a 1D trend confirming. RSI on the 15m sits at 50.52—neutral, not oversold, so no relief rally yet. ATR on 1h is tight (0.000177), meaning the next move will be explosive. Entry zone: 0.01482. Targets: 0.01450, then 0.01429. Invalidation is clear at 0.01532—that’s your line in the sand. This isn't a guess; it's a high-probability
ESPORTS+1.58%
This short trade was quite grueling. When I entered, the price was still fluctuating at a high level and whipsawed several times, with the position briefly showing an unrealized loss. At the time, I chose not to hold through it and wait for the market to turn. Instead, I placed the stop-loss above the previous high to contain the worst-case outcome. I also deliberately kept the position size small, leaving myself room to reassess.

After the downward move was confirmed, the price action became much smoother. Once the trade had run for a while, I first took profit on most of the position, whil
post-image
HEMI-24.03%
BTC+0.44%
DOGE+8.48%
Load More

Join 40 M users in our growing community

⚡️ Join 40 M users in the crypto craze discussion

💬 Engage with your favorite top creators

👍 See what interests you

View More