Share your thoughts
placeholder
Article
Layout for Bitcoin, Ethereum, and Dogecoin
live-cover
LIVE1,609
2026.09.09-9:20
Asset: SNDK take-profit
MU not entered; holding PUMP position
SNDK-0.11%
MU-1.47%
PUMP+4.87%
Why is everyone suddenly talking about SYMBOL when the daily trend is range?

$SOL /USDT - SHORT

Trade Plan:
Entry: 103.1 – 103.5
SL: 105.1
TP1: 101.9
TP2: 101.0
TP3: 99.6

Why this setup?
Why now? The 1h price sits at 103.3, which is the exact entry_ref and the midpoint of the 103.1 to 103.5 entry zone, giving us a defined risk-reward setup. The 15m RSI at 47.74 shows the short-term momentum is neutral, not overbought, so a move lower is not yet exhausted. The 1h ATR of 0.761543 tells us the average hourly volatility, meaning the target of TP1 at 101.9 is roughly one ATR away and realisti
SOL+0.33%
My hand trembled slightly when I set the stop-loss a few days ago; this morning, I realized that concern had been unnecessary. The last thing I saw before bed, $RIVER was struggling to rebound, with obvious resistance above. Every time it rallied, large orders pushed it back down. I confirmed it again at the open and went straight short, entering at 6.705.

It’s now at 1.251, +1601.32%—feels really good. Watching the market wasn’t in vain; I got the timing right.

For now, take 80% off the table and put the bulk in your pocket first. Move the stop-loss on the remaining 20% to the entry pric
post-image
RIVER+1.06%
ZEC+4.63%
DOGE-0.02%
While I was away using the restroom, the candlestick chart had already wiped out my losses for me.

During the repeated intraday swings, $BR kept grinding along the bottom without breaking down. After pulling back to around 0.21096, the key level remained solid, and funds were quietly flowing in, so I added to my position as planned. When I checked again just now, the price had already reached 0.27432, delivering a +589.75% return on this small move. It was truly sluggish at first, but the breakout feels just as good.

I’ve taken 80% in profit and moved the stop loss on the remaining 20% up
post-image
BR+1.46%
SNDK-2.23%
SOL+0.33%
Creator earnings favor original content; everyone should resubmit for review.
Wishing everyone success in passing!
post-image
9.09 SOL Analysis
Analysis: Short around 104.0-105.0, with a stop at 105.5; first target 102.5, second target 101.5
On the hourly chart, the overall market is in a weak recovery phase within a downtrend. After coming under pressure and retreating from the interim high of 105.88, bearish momentum continued to be released, with the price dipping to an interim low of 101.64 before a technical oversold rebound. However, the rebound was limited and did not alter the overall downward structure. The Bollinger Bands have flattened and are tilting slightly downward, with the upper band exerting clear r
post-image
SOL+0.29%
At this time next year, if you asked me to judge whether a robotics company had fallen behind, I probably wouldn’t first look at which generation of robot it had released.
I would first ask a more practical question:
How many hours of genuinely usable operational data has it actually accumulated?
Recently, I saw Axis Robotics @axisrobotics founder Chris mention in an interview that he hopes people will use three words to describe Axis a year from now:
Scale, Diversity, Closed-loop.
Scale, diversity, and closed-loop.
I think these three words are far more interesting than grand narratives like
post-image
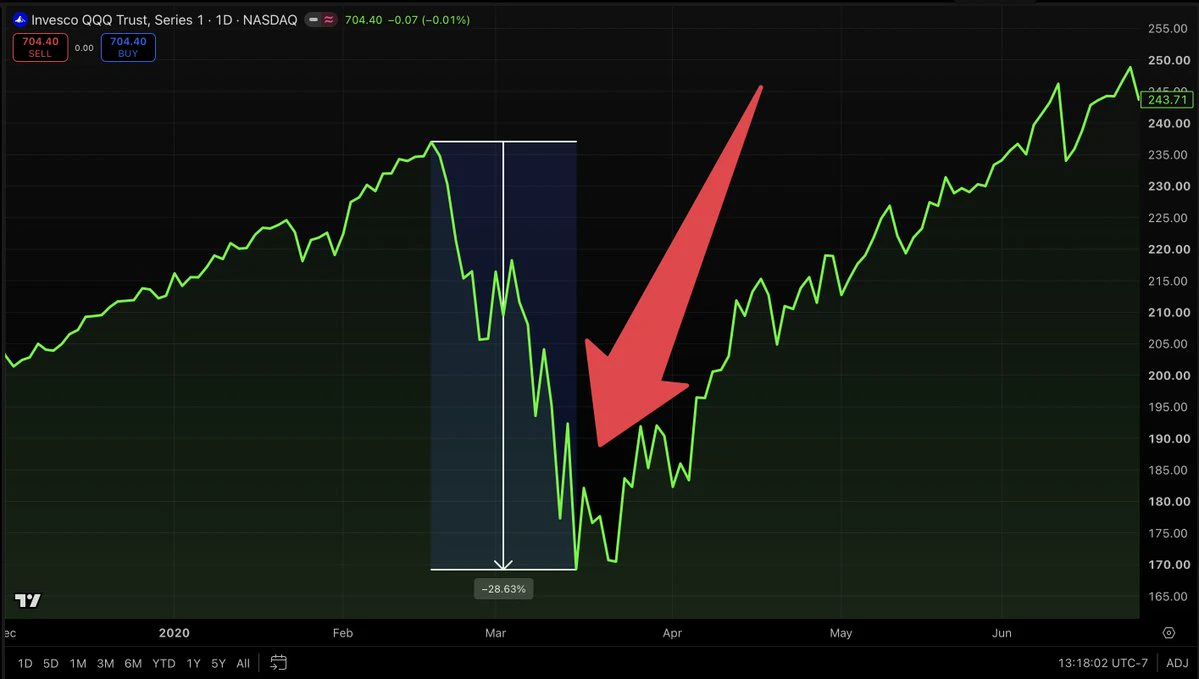
$SPY Market structure still pointing to the downside
Looking for a selloff into $760.68
Might not get it til PPI/CPI!
post-image
SPY-0.30%
  • 1
9.9, Wednesday, Shandi’s view!
Yesterday, Shandi’s daytime session weakened overall, with the market remaining under continued pressure. After the U.S. stock market opened, incoming funds drove a rally, but unfortunately the bulls failed to sustain the momentum, and another pullback emerged in the early morning hours.
The market has been oscillating back and forth, with intense bullish-bearish competition. In the short term, it is still digesting overhead pressure and has yet to establish a clear one-way trend.
In the short term, focus on support around 1680-1700. As long as this range is not
SNDK-2.23%
The overall trend of the annual curve has continued downward. At the beginning of the year, the market had relatively high expectations for approval, but those expectations continued to decline afterward; after entering the second half of the year, they fell further and are now stable in a low range, while bullish confidence continues to weaken.
post-image
These days,
there really aren’t many people this sincere.
post-image
  • 3
  • 1
9.09 Bitcoin Analysis
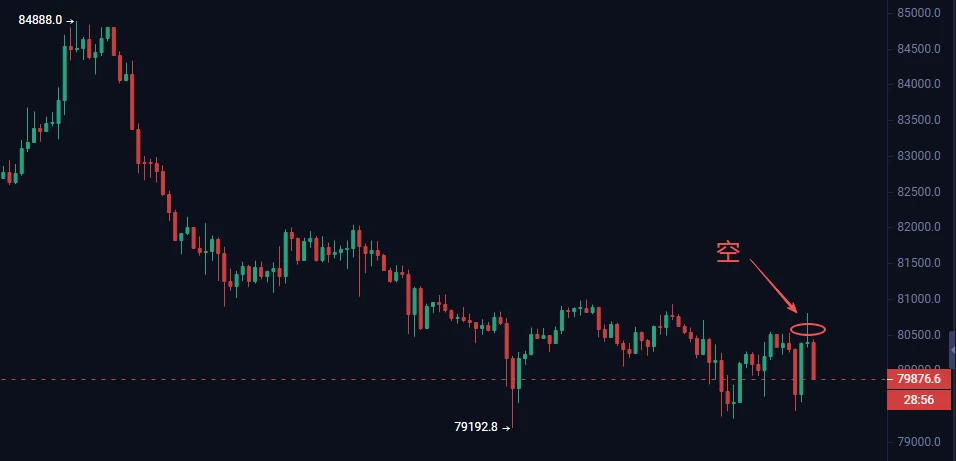
Analysis: Short around 79000-79500 on the rebound, with a stop-loss at 80000; first target 78300, second target 77800
The hourly chart is overall in a downtrend. The price came under pressure and pulled back from the high of 79476.0, with bearish momentum continuing to be released. It dipped to a low of 77600.1 before seeing an oversold technical rebound, but the rebound was weak, representing a feeble recovery during the decline. The Bollinger Bands are expanding downward, while the middle band continues to move lower and create resistance. Short-term moving averages rem
post-image
BTC-0.27%
In the short-term window, there is no extremely strong one-sided expectation, and market divergence is evident; rather than surging sharply, the market is more inclined to see BTC pull back to test 76000; if an extreme move takes it down to 74000, the risk-reward potential is greatest.
post-image
BTC-0.27%
9.09 ETH Analysis
Analysis: Short near 2500-2520 on the rebound, with a stop at 2540; first target 2470, second target 2440
On the hourly chart, overall price action remains in a weak recovery phase within a downtrend. Bearish momentum continues to be released, but the rebound is limited and has not changed the overall downward structure.
The Bollinger Bands are flattening and slightly turning downward. The upper band is clearly capping the price, which is fluctuating under pressure after rebounding to the area below the upper band. Although the short-term moving averages have turned up slight
post-image
ETH+0.36%
VVV hits a fresh all-time high near $26.12 as 24h gain hits 31% on strong volume. Venice confirms another large discretionary VVV burn (~$391k), the biggest to date. $VVV
post-image
VVV+35.94%
☀️ GM! Around $80K , the tug-of-war has started again today.
🐂 Bulls: Up!
🐻 Bears: Down!
BTC: Can you two let go first...
ETH is already sitting to the side drinking coffee. ☕
👇 Which side are you on in today’s tug-of-war between bulls and bears?
💬 Come chat at Gate Square:
https://www.gate.com/post
GateSquare
☀️ GM! Around $80K , the tug-of-war has started again today.
🐂 Bulls: Up!
🐻 Bears: Down!
BTC: Can you two let go first...
ETH is already sitting to the side drinking coffee. ☕
👇 Which side are you on in today’s tug-of-war between bulls and bears?
💬 Come chat at Gate Square:
https://www.gate.com/post
repost-content-media
BTC-0.27%
ETH+0.36%
Load More

Join 40 M users in our growing community

⚡️ Join 40 M users in the crypto craze discussion

💬 Engage with your favorite top creators

👍 See what interests you

View More