Square
Following
Hot
News
Notifications
Profile
Share your thoughts
placeholder
Article
Market Update
live-cover
LIVE1,762
$GTAI ‌
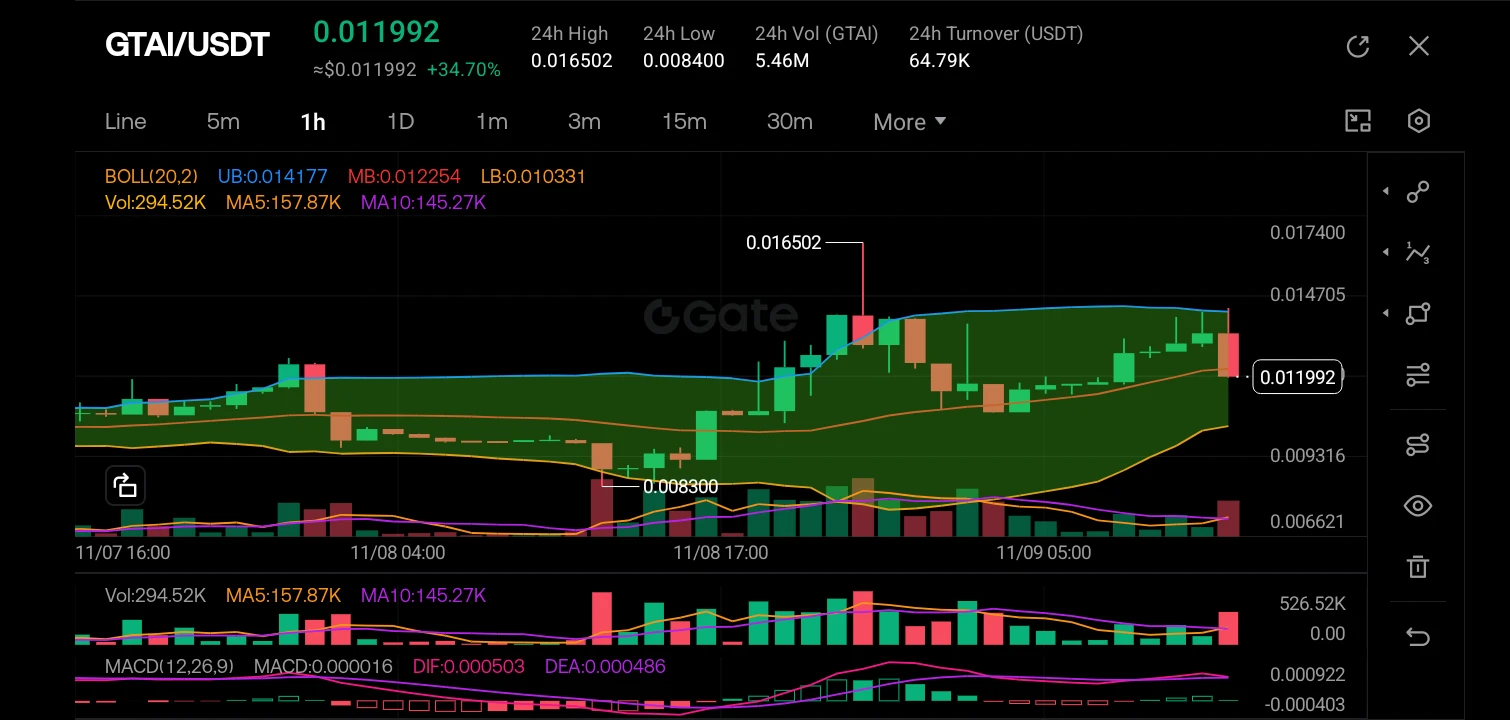
The GTAI/USDT pair is currently exhibiting a strong bullish momentum on the 1-hour timeframe, having surged +34.70% to trade at 0.011992. Price action shows a clear breakout above the upper Bollinger Band (UB: 0.014177) earlier in the session, reaching a 24h high of 0.016502 before retracing. We are currently seeing a consolidation phase where the price is testing the middle Bollinger Band (MB: 0.012254) as dynamic support, while the MACD remains in positive territory (DIF: 0.000503 > DEA: 0.000486), though the histogram is flattening, indicating a potential cool-off in buying volume.
post-image
GTAI-4.43%
  • 2
Trenches
牛逼
牛
bade
b
牛逼
0x96...7777
Market Cap
$.
Change
.
24h Vol
$.
Holders
.
ZIG
Z
bade
b
ZIG
0x8c...1145
Market Cap
$.
Change
.
24h Vol
$.
Holders
.
BTC
B
bade
b
BTC
C5xp...pump
Market Cap
$.
Change
.
24h Vol
$.
Holders
.
STONK
S
bade
b
STONK
6GmA...UNgx
Market Cap
$.
Change
.
24h Vol
$.
Holders
.
ANSEM
A
bade
b
ANSEM
9cRC...pump
Market Cap
$.
Change
.
24h Vol
$.
Holders
.
$ETH Get ready to place limit orders to go long at $2,070.5 and $2,045.5, crypto friends. These two price levels are where many whales will be liquidated.
ETH-1.23%
In crypto, you have to learn to lose money for no reason, or you’ll have no face to hang around in the space.
Because all anyone talks about is “who lost more”😂#BTC闪崩插针
post-image
BTC-0.67%
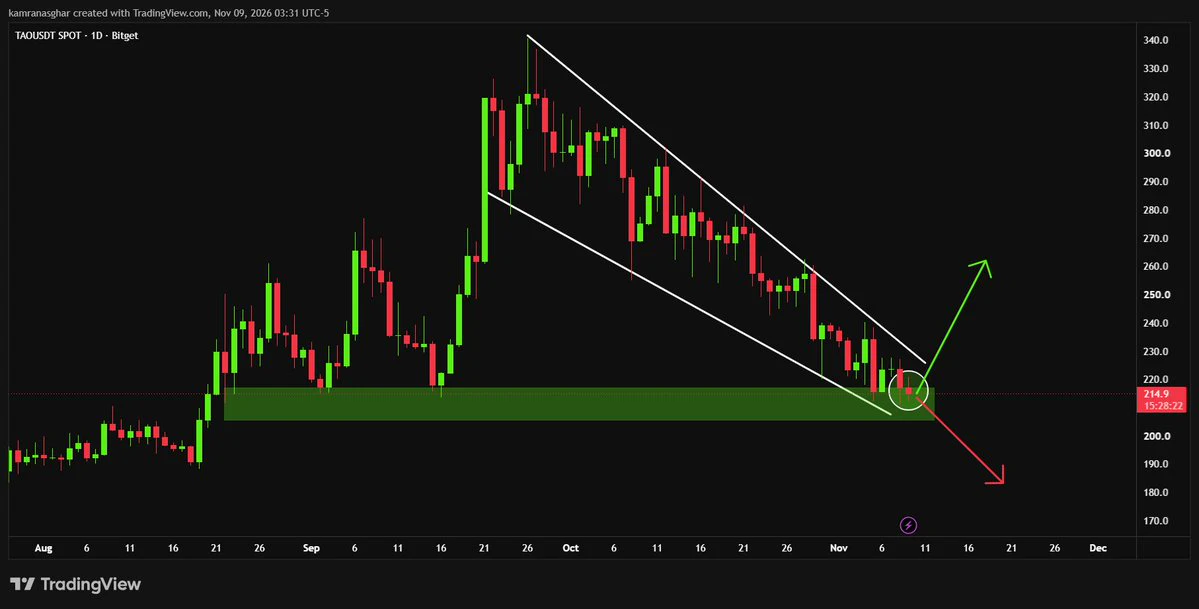
bittensor:native is testing major demand at the lower boundary of a falling wedge structure
A clean breakout above resistance triggers a massive macro reversal wave.
post-image
TAO+0.41%
The biggest illusion at 50k U: The money in your account is your money
Here’s a question that may be hard to hear: How much of the money you’ve made in this industry has actually left the exchange?
Most people’s answer is: none.
You make 20k, add to your position; grow it to 50k, add more; reach 80k and think you’re “good at this,” then go all in. The number in your account keeps climbing, while your bank balance doesn’t change a bit.
Then one day, a huge red candle hits, and you realize—that wasn’t money you’d made. It was risk temporarily sitting in your account.
Unrealized gains aren’t your
post-image
BTC-0.65%
How Did the Account That Rode Musk Trends to a 3,200% Gain Win?
On-chain data shows that a deployer of a certain meme coin repeatedly launched tokens at just the right moments by capitalizing on Musk-related buzz, earning more than 3,200% in total.
This is a sophisticated attention-arbitrage playbook: trend → token launch → liquidity → sell-off. The entire process is repeatable.
Pricing power in the meme coin market is shifting from “who can shout the loudest” to “who can get ahead of the money flows”—from storytelling to on-chain data monitoring and launch timing.
Army Outlook:
In the future,
post-image
MEME-0.94%
Scalp for small gains with a small position
[Entry Analysis]:
$ETH Follow BTC in and out, taking small profits with a small position
$ZEC After breaking below 1176.98 in the morning, it formed a rebound that peaked at 1249.17. Based on the morning outlook, the medium-term trend remains range-bound within Range 4, with 1280 as the midpoint. Market depth shows a balance between bulls and bears, with slight fluctuations around 1220–1240. Considering its correlation with major assets, BTC is more likely to retest its low. A short bias appears more reliable, so a small position is chosen to test
ETH-1.23%
ZEC+1.29%
$ON Up 28% in 24 hours, then it spiked to 0.2378 and dumped. Everyone who chased the top is now trapped above 0.21. My strategy is simple: don't chase; wait for a pullback to the 0.19–0.195 range and buy in batches, with a stop-loss below 0.178. If it breaks below that, admit I'm wrong and get out. Position size at most 20%; don't get carried away. Bullish case: 63.7M in trading volume means real money came in, not a pump out of thin air; the intraday range from 0.1564 to 0.2378 was over 50%, shaking out holders hard and turning over plenty of tokens; coins that break above previous highs on h
ON+4.77%
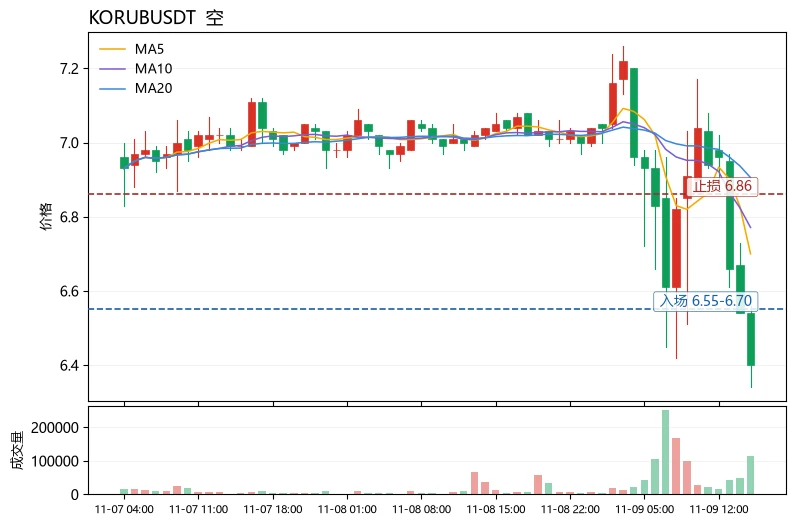
$KORUB The current price is 6.4. Key short-term levels are the Bollinger lower band at 6.50 and MA5 at 6.70. The price has fallen below the lower band and is tracking along it, indicating a weak structure dominated by bearish momentum.
From a capital-flow perspective, the 24h decline is -9.09% and trading volume is 7.8M. Volume does not suggest panic selling, but rather passive position reductions by bulls. MA5 at 6.70 is below MA20 at 6.9055, with the moving averages in a bearish alignment. RSI at 31.0 is near oversold but shows no divergence, while the MACD histogram at -0.05065 is still exp
post-image
KORUB
KORUBSouth Korea Bull
Four.meme
MC:$3.67KHolders:1
0%
SOL-0.77%
ADA-1.48%
solana market predictions
live-cover
LIVE2,064
zisk proves optimism mainnet using just 4 rtx 5090 gpus, generating transaction proofs in an average of 11 seconds after ethereum batch inclusion.
$OP $ZK #GATE
post-image
OP-1.33%
ZK+0.39%
ETH-1.26%
Bogo offer is now live on GFT for a limited time.... Enjoy 40% on all Challenges🔥
and get 1 FREE account when you reach your payout.
Link:
Code: BOGO40
Trade with the greatest
post-image
$GT ‌
Looking at the 1-hour chart for GT/USDT, the price is currently trading at 9.84, showing a +1.44% increase. We are observing a strong bullish recovery after a period of consolidation near the 9.52 support level. The price has just broken above the middle Bollinger Band (MB: 9.74) and is approaching the upper band (UB: 9.91). The volume bars are expanding, indicated by the green volume spike, and the MACD is converging towards a bullish crossover, suggesting that buying momentum is returning to the market.

The most recent candle is a strong, full-bodied green candle that has engulfed th
GT-2.41%
  • 3
They say Jackie Chan isn't qualified?
He's the originator of this phrase🖤🖤
#黄仁勋 #JensenHuang
post-image
  • 2
Still powerful.
Even Musk called it badass.
post-image
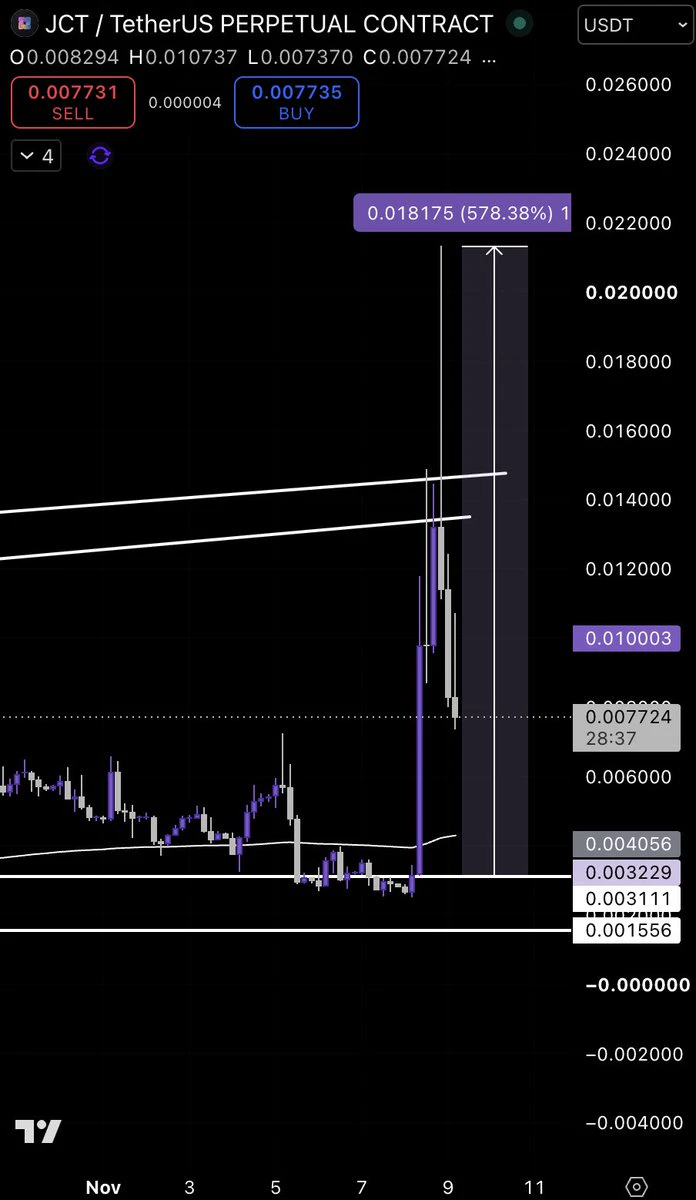
ethereum:0xc477b6dfd26ec2460b3b92de18837fd476ea7549 finally hit the area we were waiting for! 🎯
Price reached our $0.0031–0.0032 accumulation zone before the explosive move.
Now trading around $0.0077, with the next major resistance around $0.0135–0.0147.
Patience pays. We had the levels mapped out before the move. 🟢
post-image
@tradingview can you Fix this
#Total3 and #Btc.D #Total2 are Glitching
BTC-0.67%
For the next three years,
the entire crypto market will have to pay the price for the claim
that BTC is very resilient amid bad news
post-image
BTC-0.67%
Load More

Join 40 M users in our growing community

⚡️ Join 40 M users in the crypto craze discussion

💬 Engage with your favorite top creators

👍 See what interests you

Trending Topics

USCPIDataIncoming

31k Views1.87k Discussing

The U.S. October CPI report will be released on November 10 at 8:30 a.m. ET. September CPI came in at 3.7% year over year, and markets will be watching closely for signs that inflation is cooling, especially in core CPI. A softer-than-expected reading could strengthen rate-cut expectations, while hotter inflation may pressure risk assets through higher Treasury yields and a stronger dollar. How do you think this CPI print will move $BTC, U.S. stocks and gold?

RedBullDoublePodiumInBrazil

2.75k Views30.53k Discussing

BTCFlashCrash

100.05k Views66.27k Discussing

View More