Square
Following
Hot
News
Profile
Share your thoughts
placeholder
Article

BTC is currently around 82400; after the previous pullback, it has staged a short-term corrective rebound, but the upside follow-through is weak. This is a technical recovery after the decline, with no trend reversal signal appearing for now. The broader structure remains range-bound with a bearish bias.

On the 4-hour chart, the price is below the moving averages, and rebound volume is insufficient, indicating a weak consolidative recovery. The overhead resistance zone is substantial. As long as the price fails to firmly hold above resistance, this rebound is more likely to be a continuation
post-image
BTC+0.86%
$ICNT Investment trade: Looking back at the content published earlier, Target 2 has now been reached. We still have room to 0.15–0.20.😎$KORU
post-image
ICNT+26.70%
KORU-6.51%
CPI Comes in Hotter Than Expected
live-cover
LIVE31
Bullish on $SOCKS
post-image
$WULF had an intraday recovery of +20% which is pretty significant. It was down -65% from its high of $29 at some point today which still isn't as bad as the pullback in April 2025 where it saw -75% drawdown, but I'd say the sentiment in the space was just as bad
It almost seems irresponsible to show this chart. But it's currently forming a handle in this cup & handle pattern.
I don't make the fibs either, price currently found support around the 0.707 fib and if we get back above 0.786 and 0.887 fib then the upside targets could get wild. I don't see them happening anytime soon. For no I'd e
post-image
WULF+9.27%
I can't be the only one 😭
post-image
🚨 JUST IN: MSCI is reportedly set to REMOVE Michael Saylor’s Strategy $MSTR from its indexes. 👀
The move could impact institutional funds that track MSCI benchmarks.
MSCI+2.49%
MSTR+5.58%
$FIL the big move by gateio has begun, where everyone who believed in and invested in these ETF tokens literally gets screwed 🤡🤯
post-image
FIL+8.74%
With the same 1000U, some people are holding the bag at $WAL 0.0677, while others who bottom-fished at 0.0502 are already laughing. It is now 0.0512, down 15.7% in 24 hours, with a 565M trading volume—what does that indicate? Panic sellers are fleeing, but with selling this fierce, who is taking the other side?
Round one: the volume showdown. A 565M trading volume at this market-cap level means the turnover rate has been pushed to the limit. Rising volume during a decline either means the main players are unloading or that the market is shaking out and rotating holders. What is the difference
WAL-20.73%
are cats gonna end up trading better than pigs?
post-image
$ETH Going To Push Up For More 👀
post-image
ETH+1.67%
$ICNT Up 21% in half a day, it surged straight from 0.1015 to 0.1371, with 13.7M in trading volume pouring in. That’s not the kind of volume retail investors can generate. I took a quick look on-chain just now: the top 10 addresses’ holding concentration hasn’t declined, indicating this move is not distribution but someone accumulating. On the macro side, here’s an anchor: during the week when the Fed minutes leaned hawkish, the 30-day correlation between altcoins and the Nasdaq surged to 0.78. Small-cap assets like ICNT have higher beta, so as long as rate-hike expectations don’t rebound, it
ICNT+26.70%
Social experiment but after confirming villian monkey is behind the “Neymar” token.
I recant my post. I do not endorse this token or encourage anyone to buy after new evidence.
If you still buy, it’s at your own risk. Enjoy your day. 👍🏾
post-image
Are you tired of watching me win yet?! 🏆
We are just getting started! ✅️
Let's go make that money! 💰
Structure, no smoke! 🔥🐶🔥
$OP
This move is pushing from 0.1397 toward 0.1418, up more than 13% over the past 7 days, while open interest is piling up as longs keep adding and driving it higher🚀 The wildest part is that shorts are effectively paying to stay in, having to hold on while funding remains negative. The pressure isn’t a bad thing—it’s an early-entry position. Break through 0.1418 and jump aboard.
post-image
OP-0.01%
Layout: Bitcoin, Ethereum, Dogecoin
live-cover
LIVE880
  • 4
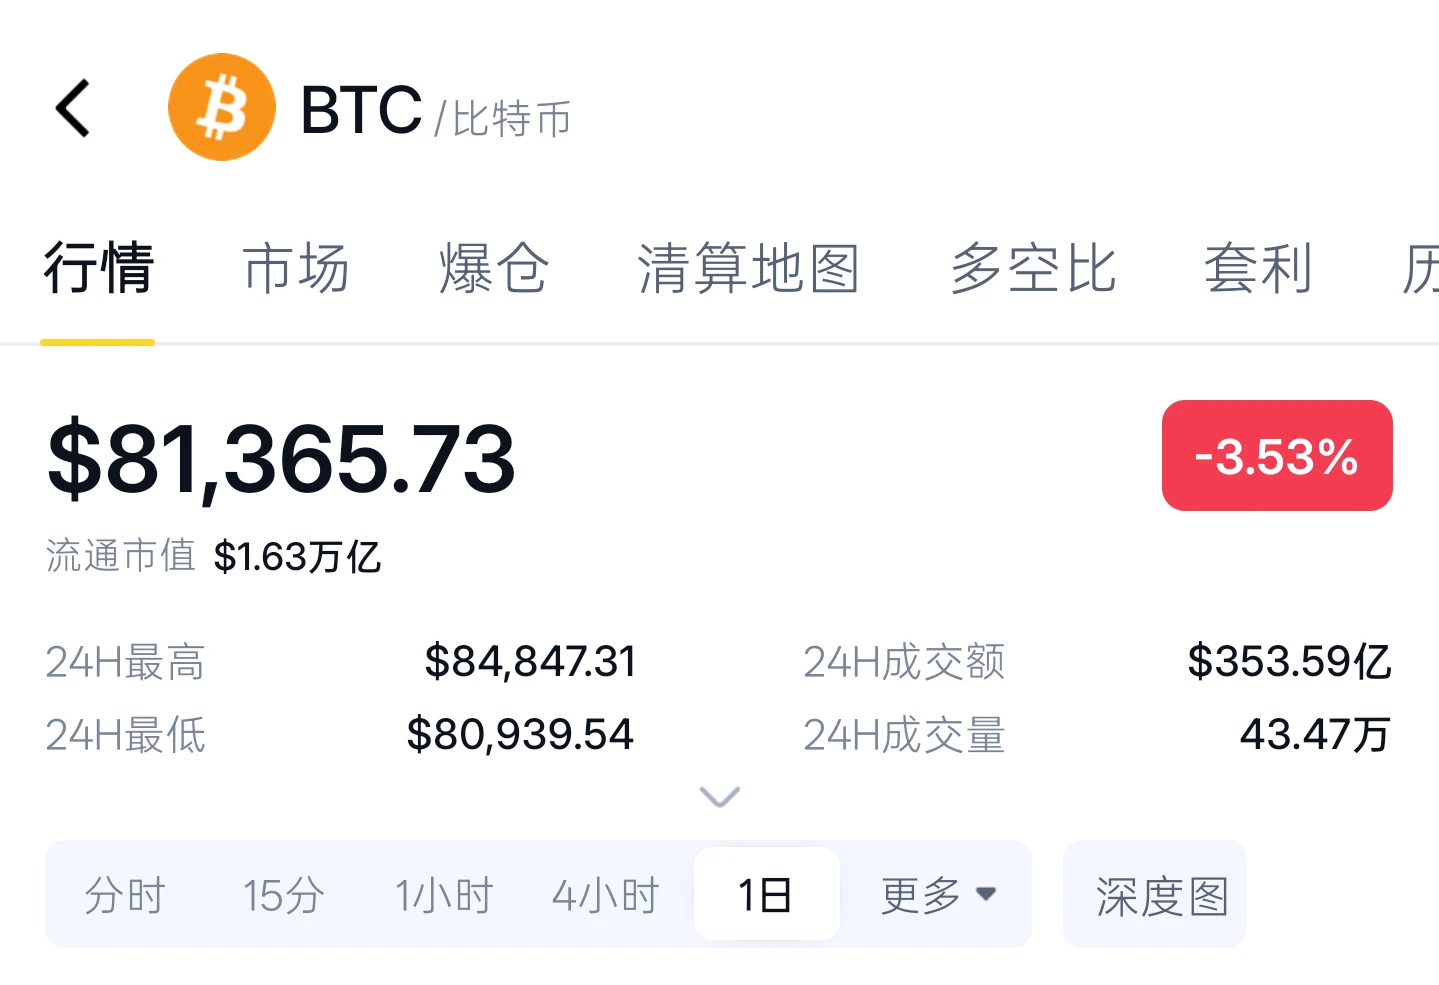
I’ve been watching $81K on Bitcoin. This week it tested that level, and then some.
On Tuesday, Korean stocks fell 5.5%. Bitcoin dipped to about 81,040 on Gate, then climbed back above $83K within hours. On Wednesday evening it slid again, and that drop has the heaviest volume on my chart. It fell to around 81.6K.
The 24h low on Gate now shows 79,795. So at some point in the last day it went under my line. Right now it’s back around 82.3K.
I can’t see that dip on the candles I’m looking at, so I don’t know how long it stayed down or how fast it came back.
My read: the line didn’t hold cleanly,
post-image
BTC+0.84%
$FET took me through a trade like this: the hardest part is knowing when to exit.
This feels like a good spot. Close the position right here. Watching these two today: $SO and $BAT .
post-image
FET+4.24%
BAT+28.99%
LayerZero built Akita, a post-quantum proof scheme, with researchers from a16z crypto, Carnegie Mellon and USC. Its first deployment will be in Jolt, the prover behind the Zero blockchain, with proofs 2x to 3x faster.
@LayerZero_Core
ZRO+9.15%
Load More

Join 40 M users in our growing community

⚡️ Join 40 M users in the crypto craze discussion

💬 Engage with your favorite top creators

👍 See what interests you

Trending Topics

USSeptemberPPIBeatsExpectations

91.35k Views1.88k Discussing

US September PPI came in at 6.3% YoY, well above the 5.3% market expectation, pointing to renewed producer-side inflation pressure. Weekly jobless claims were 199K, broadly in line with forecasts. Could hotter inflation further reduce room for rate cuts, and what does it mean for $BTC, US stocks, and gold?

DrLinHanSpeaksAtOxfordUnion

135.63k Views1.86k Discussing

JapanAndKoreaStocksPlunge

47.27k Views1.76k Discussing

View More