








Square
Following
Hot
News
Notifications
Profile
Share your thoughts
placeholder
Article
$ADX is approaching a key resistance level! $ADX is showing bullish momentum near $0.0490. If a breakout is confirmed, it could rise further. Entry: $0.0478 – $0.0482 Target: $0.0490 / $0.0500 / $0.0510 Stop-loss: $0.0468
post-image
ADX-3.54%
Retail traders are betting against $BARD , volume ratio 36.723, I'm bullish
Wow, with the Fear & Greed Index at 20 and defensive trading, $BARD has surged 14.353% against the trend, now at 0.145. This kind of strength is one of a kind across the market. I'm bullish.

BTC is at 68653.98, down -4.052% in a day, with market breadth at 18/43. Amid defensive trading, BARD has climbed from 0.0829 to 0.145 in three days, retested 0.1333 early this morning, then reclaimed it the same day. The fact that it won't budge is a signal in itself.

First, 24h trading volume is 23325165 USDT, 36.723 times the 3
BARD-1.24%
Trenches
FOOD
F
bade
b
FOOD
FTu5...pump
Market Cap
$.
Change
.
24h Vol
$.
Holders
.
mihao
m
bade
b
mihao
4Cxj...pump
Market Cap
$.
Change
.
24h Vol
$.
Holders
.
AGT
A
bade
b
AGT
0x5d...e274
Market Cap
$.
Change
.
24h Vol
$.
Holders
.
IDOL
I
bade
b
IDOL
0x3b...ab07
Market Cap
$.
Change
.
24h Vol
$.
Holders
.
Sakura
S
bade
b
Sakura
9sFG...pump
Market Cap
$.
Change
.
24h Vol
$.
Holders
.
£750 million a week—that’s enough to make anyone wince. That’s the bill for rebuilding ties between the UK and the EU and reconnecting with some EU mechanisms and programs. At that rate, it comes to about £39 billion a year, or nearly 400 billion yuan. Who pays? In the end, it’s taxpayers, businesses, and consumers. The bill ultimately lands on budgets, taxes, and public services.

So many years after the Brexit referendum, the Vote Leave crowd have reappeared under new guises. Back then, they shouted “Take back control” from the rooftops. Now some are writing memoirs, others are making podcas
post-image
#每周来晒 #黄仁勋辞职 According to a statement by Nvidia’s Board of Directors on Thursday, Huang stepped down as president and CEO and resigned from the board, effective immediately. The resignation comes amid allegations of two extramarital relationships: one with an executive at Singapore-based Megaspeed, whom US intelligence agencies suspect of working on behalf of China’s Ministry of State Security; the other with Nvidia’s vice president of healthcare, who reported directly to Huang. The matter took on national security dimensions after the FBI opened an investigation and the US Congress summoned
NVDA-1.92%
  • 3
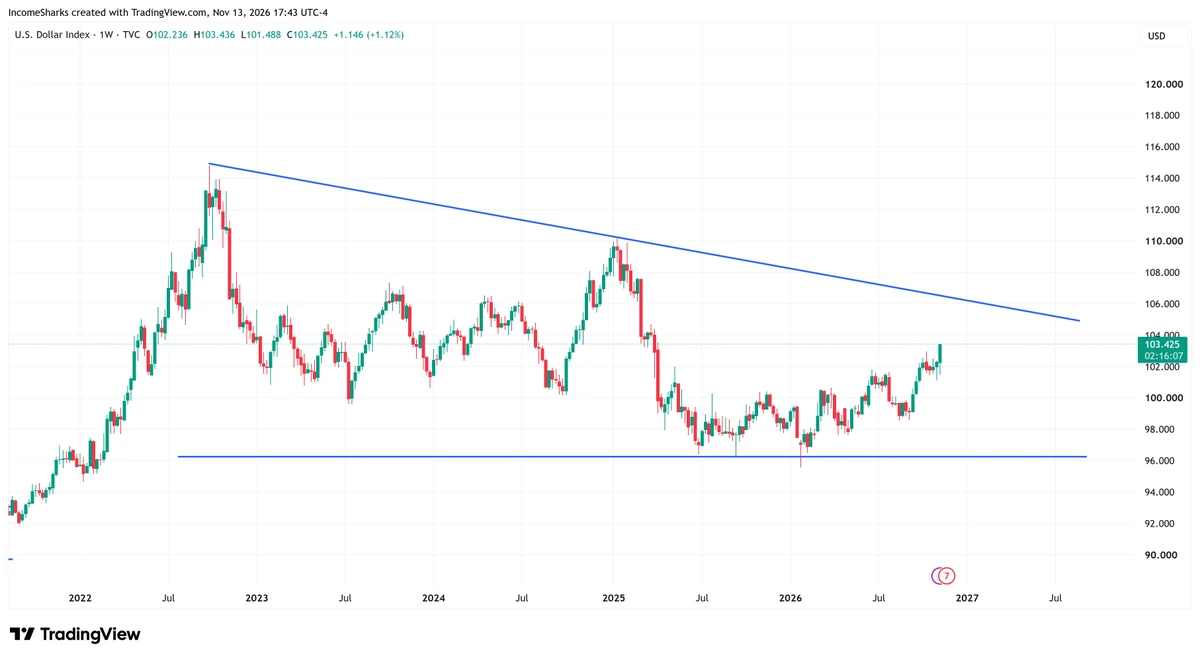
US dollar getting stronger continues to hurt crypto, precious metals, and stocks.
post-image
US-7.23%
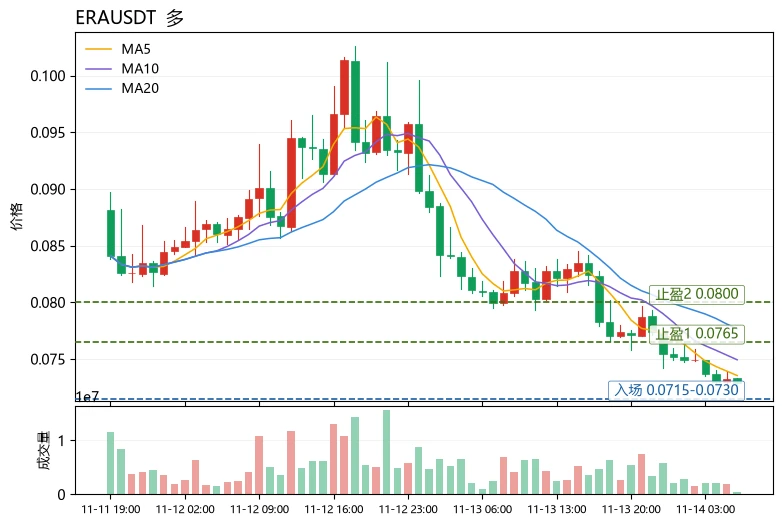
Many people equate “deeply oversold” with “a rebound opportunity”—this is the easiest trap to fall into when making cross-asset comparisons. A large drop does not mean relative strength; what matters is who is holding up and who is collapsing within the same sector.
$ERA fell 10% in the past 24 hours, while $SUI fell just 1.16% and
$NVDAB fell 2.76%. Among similarly active assets, ERA’s decline has clearly deviated from the sector midpoint, making it one of the assets being sold off on its own. Technical indicators confirm this: MA5 is below MA20 and the gap is widening, the MACD histogram
post-image
NVDAB
NVDABNVDAB
Pump.Fun
MC:$3.5KHolders:1
4.36%
ERA+24.21%
SUI-1.05%
#黄仁勋辞职 Bitcoin (BTC) Price Analysis: Market Crash, Critical Support Levels and Recovery Outlook – November 14, 2026

Bitcoin is facing renewed selling pressure after dropping below the important $70,000 psychological level. The latest correction has increased uncertainty across the cryptocurrency market, with traders watching institutional ETF flows, inflation concerns, and leveraged liquidations.

BTC recently traded around $68,900, putting the $67,000–$68,000 region in focus. The coming sessions could be important in determining whether Bitcoin starts a recovery or continues its downward mov
post-image
BTC-0.67%
A late-night glance at capital flow data revealed strikingly divergent signals among major cryptocurrencies.
$BT and $SOL both saw outflows, while $ETH was accumulating against the trend—the three were moving in completely opposite directions.
Specifically: $BTC : net outflow of 92.78 BTC$ETH : net inflow of 5494.81 ETH$SOL : net outflow of 13,900 SOL
Despite all being major assets, capital is moving in different directions, indicating that bullish and bearish divisions in the market are widening. With this divergence, it will be difficult for the market to move in one direction with a unif
post-image
ETH-1.26%
$ARX 's 1-hour RSI has surged into extreme overbought territory. As the price neared its intraday high, momentum noticeably stalled—a setup that often gives bears a good opportunity to lie in wait. Once the pullback signal was confirmed, this trade netted a 74% gain. 📉⚡

Profit: $23

Keep a close eye on how $SOPH and BTC perform next.
Bearish setup: Catch this spike-and-reversal move on $ARX . Entry range: 0.2311 - 0.2362 Targets: 0.2200 / 0.21 Stop-loss invalidation level: 0.2456
A parabolic rally eventually needs a breather. The RSI hit 93 and stalled near the highs—that's clearly a trap f
post-image
SOPH-3.83%
$BTC This is not first time for me. I experienced similar setup in past.
BTC-0.67%
  • 1
#ZECFallsBelow1000
ZEC falling below the 1000 level gives a picture that at once calls into doubt the view of the market on privacy focused assets, and this move stands out as a sharp correction that came after the strong rise formed in recent weeks.

By the latest data, ZEC moves near the 979 level and, by easing to the 962.85 level in the day, it falls to the lowest level seen since September, while the weekly loss moves above the 23 percent level.

Rather than seeking one cause behind this fall, it is needed to see that a few forces came together at the same time, because outflows on the
post-image
discovery
#ZECFallsBelow1000
ZEC falling below the 1000 level gives a picture that at once calls into doubt the view of the market on privacy focused assets, and this move stands out as a sharp correction that came after the strong rise formed in recent weeks.
By the latest data, ZEC moves near the 979 level and, by easing to the 962.85 level in the day, it falls to the lowest level seen since September, while the weekly loss moves above the 23 percent level.
Rather than seeking one cause behind this fall, it is needed to see that a few forces came together at the same time, because outflows on the fund side, the closing of leveraged positions, and the way the inflation data above views hurt the sense of risk together form a ground that lifts selling pressure.
Though the upgrade on the network side brought a gain that shortens the block gap, this technical gain alone did not form enough support on the price, because the market gives more weight in the short term to fund flow and to the balance of positions, and it judges the effect of technical steps over a longer term.
Seen from a technical view, the loss of the 1000 level means that a psychological threshold has been passed in the market, and the 870 to 900 range stands out as the next watched zone, because this range is seen as a zone where longer term averages meet, and how the price will react in this zone is watched closely.
For this reason, when watching this fall, it will give a far healthier and more whole view to judge together the strength of trade volume, whether fund flow keeps going or not, how the balance in leveraged positions takes shape, and the path of broad risk appetite, rather than focusing only on the closing number of the day.
In the end, ZEC below the 1000 level should be seen less as a cause for fear and more as a threshold where the current trend is being judged again, and choices made at this threshold should take shape with a staged, disciplined, and long term view rather than with sudden moves based on one day, which stands out as the most right approach both for keeping capital safe and for judging openings in a healthy way.
The market rewards patience and calm in each strong period as it does in this period, tiring those who fall into noise, while it makes the road look clearer for those who read the move with a whole view and make choices with calm judgment rather than with mood.
$ZEC ‌
#ZECFallsBelow1000
#ShareWeekly
#WCTCS9

repost-content-media
ZEC+1.16%
BNY, with $63.4T under custody and administration, supports XRP and RLUSD on its digital asset custody platform.
Eligible institutions can hold and transfer both through the bank's existing servicing controls.
@XRP @JoelKatz
XRP-1.15%
RLUSD+0.00%
Crypto Market Volatility Explained (No Signals)
live-cover
LIVE1,084
What is a Crypto Wallet?
A crypto wallet does not really store coins. It stores the keys that prove you can move coins recorded on the blockchain.
If you have the keys, you can send funds. If you lose the keys, the coins are still on the chain, but you can no longer access them.
👛 Think of the wallet as your keyring, and the blockchain as the vault.
💡 Key takeaway: your wallet holds keys, not the coins themselves.
post-image
  • 2
  • 1
🚀 HAPPY NEW WEEK, LEGENDS! 💎
New week. New opportunities. New crypto gems to watch! 👀🔥
What's the ONE $TICKER you're most bullish on this week?
👇 DROP YOUR PICK AND LET THE COMMUNITY KNOW!
#Crypto #Memecoins #Altcoins #Bullish
post-image
GEMS-0.75%
$BTC A Healthy Reset or More Downside Ahead?

A third $1B+ liquidation event in just two weeks shows how aggressively leverage is being flushed from the market.

History tells us the 200-week moving average matters:

- 2018 $BTC bottomed near this level.
- 2020: A brief breakdown preceded a strong recovery.
- 2022 $BTC spent 36 weeks below it.

But history is context, not a guarantee.

Liquidations can eliminate excessive leverage, but sustainable recovery needs real spot demand.

I'm watching spot buying, selling pressure, and the 200-week MA for confirmation.

Is this leverage reset creatin
post-image
BTC-0.67%
📉 Macroeconomic pressure compounded by a technical breakdown

On the 4H chart, BTC broke below its previous low on heavy volume, hitting a low of 67,444.3 and currently trading at 68,571.2. The market is showing the following signs of extreme weakness:

1. Bearish moving averages overwhelm price: EMA5 through EMA30 are fanning downward in a waterfall pattern, with price firmly pinned below all moving averages and no strength to rebound.
2. Break below the lower Bollinger Band: The candlestick body plunged straight through the lower Bollinger Band (67,601.7), leaving price in an extreme breakd
post-image
BTC-0.67%
Crypto bros have only 2 moods.
I just got my Raenest physical usd card.
I was told i can use this card anywhere in the world & pay for any shit i want without limit.
Also comes with the tap to pay feature. can’t wait to test this out.
post-image
[New Streamer] MArket Updates !
live-cover
LIVE504
Load More

Join 40 M users in our growing community

⚡️ Join 40 M users in the crypto craze discussion

💬 Engage with your favorite top creators

👍 See what interests you

Trending Topics

JensenHuangResigns

535.1K Views8.7K Discussing

Jensen Huang has resigned as NVIDIA CEO and stepped down from the board. CFO Colette Kress will serve as interim CEO while NVIDIA considers internal and external successors. $NVDA fell more than 10% in premarket trading following the announcement. With one of AI’s most influential leaders stepping aside, markets are now reassessing NVIDIA’s leadership stability, AI strategy, and long-term valuation.

GateIPOAccessAnthropic

292.1K Views2.7K Discussing

Dr.HanOxfordUnionSpeech

145.8K Views526 Discussing

View More