Square
Following
Hot
News
Profile
Share your thoughts
placeholder
Article
Sometimes I wonder what evil I must have committed in a previous life. It goes beyond X - in real life i've always been ignored and "surprised" people afterwards - just because I don't follow the norms of being a loud person as a default.
I see hype posters doing 50 a day, ragebaiters, extreme racists, sexists, and general closed minded bigots continue to thrive on this platform. Hence why I pulled back and will continue to do so over time.
Then I saw a quote and it brought some peace:
"If you want to improve, be content to be thought foolish and stupid with regards to external things. Don't w
post-image
BNB’s four-hour chart is beginning to show a bullish continuation pattern.
Once the uptrend is confirmed and it holds above 750, a weekly uptrend channel will emerge, followed by an unimaginable massive rally. BNB normally does not diverge from the broader market, so this time platform tokens are very likely to lead BTC, ETH, and other major coins in kicking off a bull market.
post-image
BNB+1.43%
BTC+0.06%
ETH+0.28%
Trenches
STONK
S
bade
b
STONK
6GmA...UNgx
Market Cap
$.
Change
.
24h Vol
$.
Holders
.
BTC
B
bade
b
BTC
C5xp...pump
Market Cap
$.
Change
.
24h Vol
$.
Holders
.
CNPY
C
bade
b
CNPY
0xc6...ddd2
Market Cap
$.
Change
.
24h Vol
$.
Holders
.
ZIG
Z
bade
b
ZIG
0x8c...1145
Market Cap
$.
Change
.
24h Vol
$.
Holders
.
LAUNCH
L
bade
b
LAUNCH
AhBi...Qj6C
Market Cap
$.
Change
.
24h Vol
$.
Holders
.
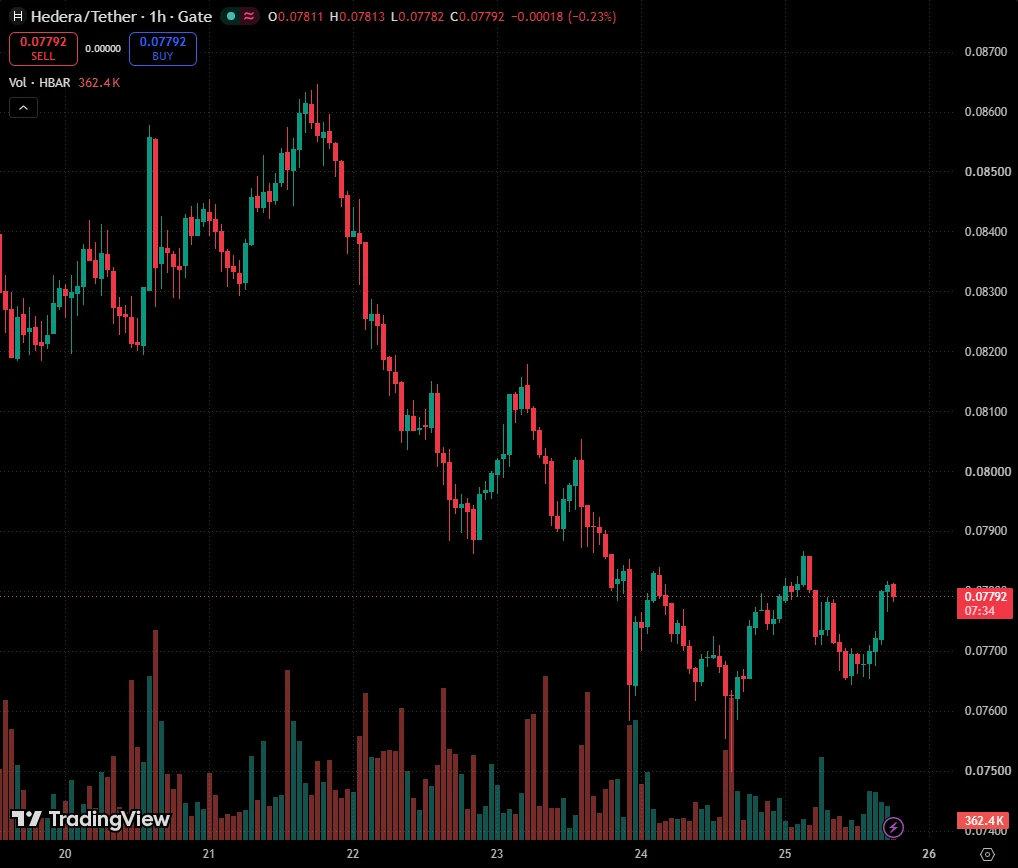
$HBAR HBARUSDT Analysis
HBARUSDT
Market Structure Analysis:
HBAR remains bearish on the 1H chart, with lower highs and lower lows. However, price is reacting from the 0.07648 support area, creating a short-term bullish setup against the prevailing trend.
Entry & Exit Signal:
Buy Entry: 0.07713
Stop Loss: 0.07648
Targets: 0.07843 R/R:2 - 0.07953 - 0.08141 - 0.08718
Key Support & Resistance:
Key Resistance: 0.07834 / 0.07953 / 0.08141 / 0.08718
Key Support Area: 0.07648
⚠Risk Management:
Maximum 1% risk per trade.
post-image
HBAR-0.26%
🚨 PI NETWORK: THE NEXT BIG TEST IS NOT JUST PRICE — IT'S REAL UTILITY! 🔥
Pi Network has announced its first-ever Pi Ecosystem Summit for November 17–19, 2026, focusing on developer tools, new platform features, app showcases, and an upcoming hackathon. 👀
Why does this matter? Because the future of Pi depends on more than the number of Pioneers. It depends on useful apps, real transactions, and businesses willing to accept Pi.
The big question is: Can Pi turn its massive community into a thriving digital economy? 🤔
I'm watching the ecosystem, not just the price chart!
💬 Pioneers, what woul
post-image
PI-2.14%
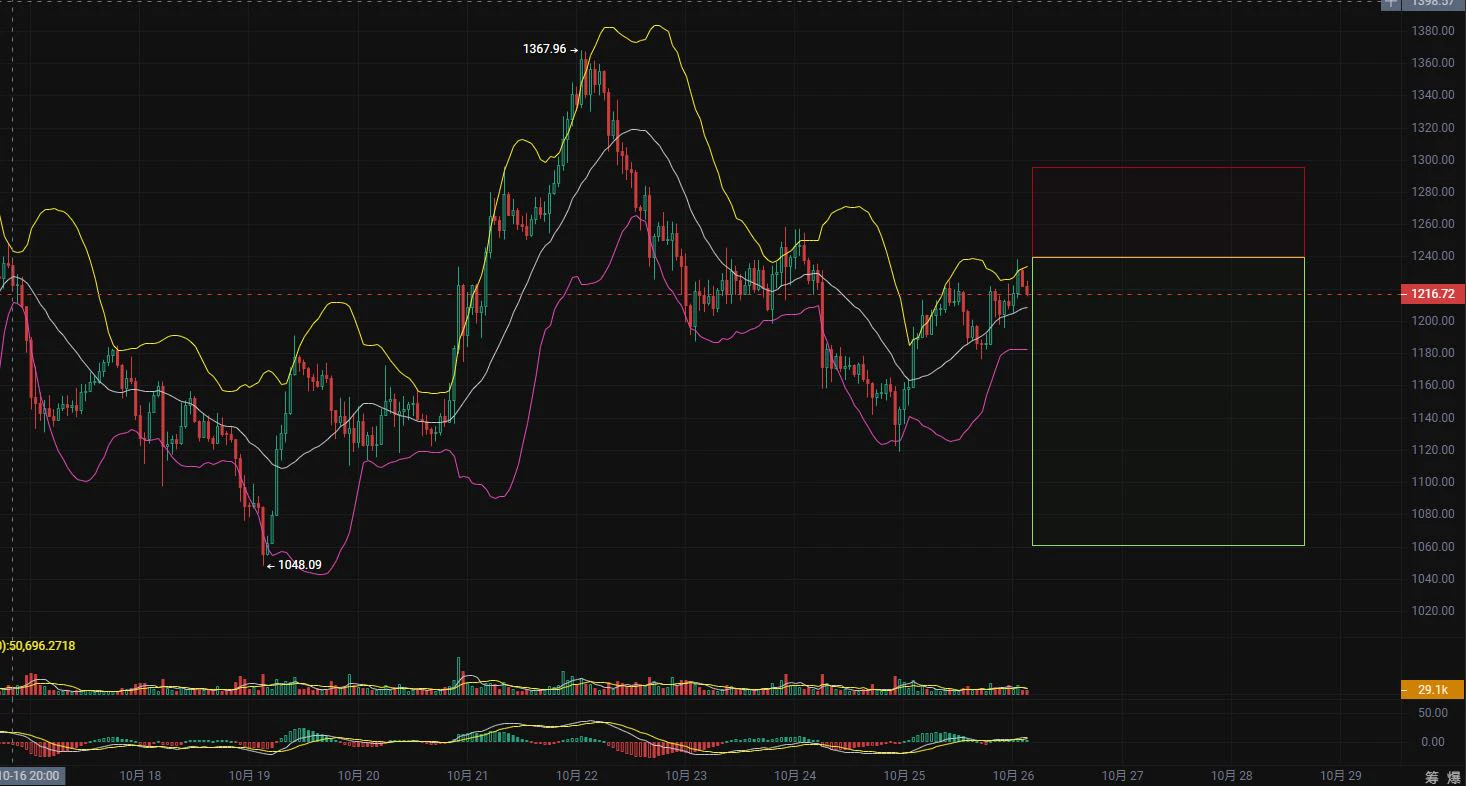
10.26 ZEC Long and Short Strategy (Public Version)
Long Strategy$ZEC
  Entry range: around 1080-1120
  Stop-loss defense: around 1040 (depending on entry price and position size)
Take-profit targets
  First target: around 1180
  Second target: around 1120
Third target: 1220 (in view if the second target is broken)
Fourth target: 1280 (in view if an evening trend develops)
Factors: The Bollinger Bands show signs of widening, and MACD is below the zero axis. As for market depth data, there are few large buy orders and more medium and small orders. Overall, retail traders
post-image
ZEC+1.26%
BTC+0.07%
ETH+0.31%
Market update BTC
live-cover
LIVE442
The current bitcoin structure looks bullish
post-image
BTC+0.06%
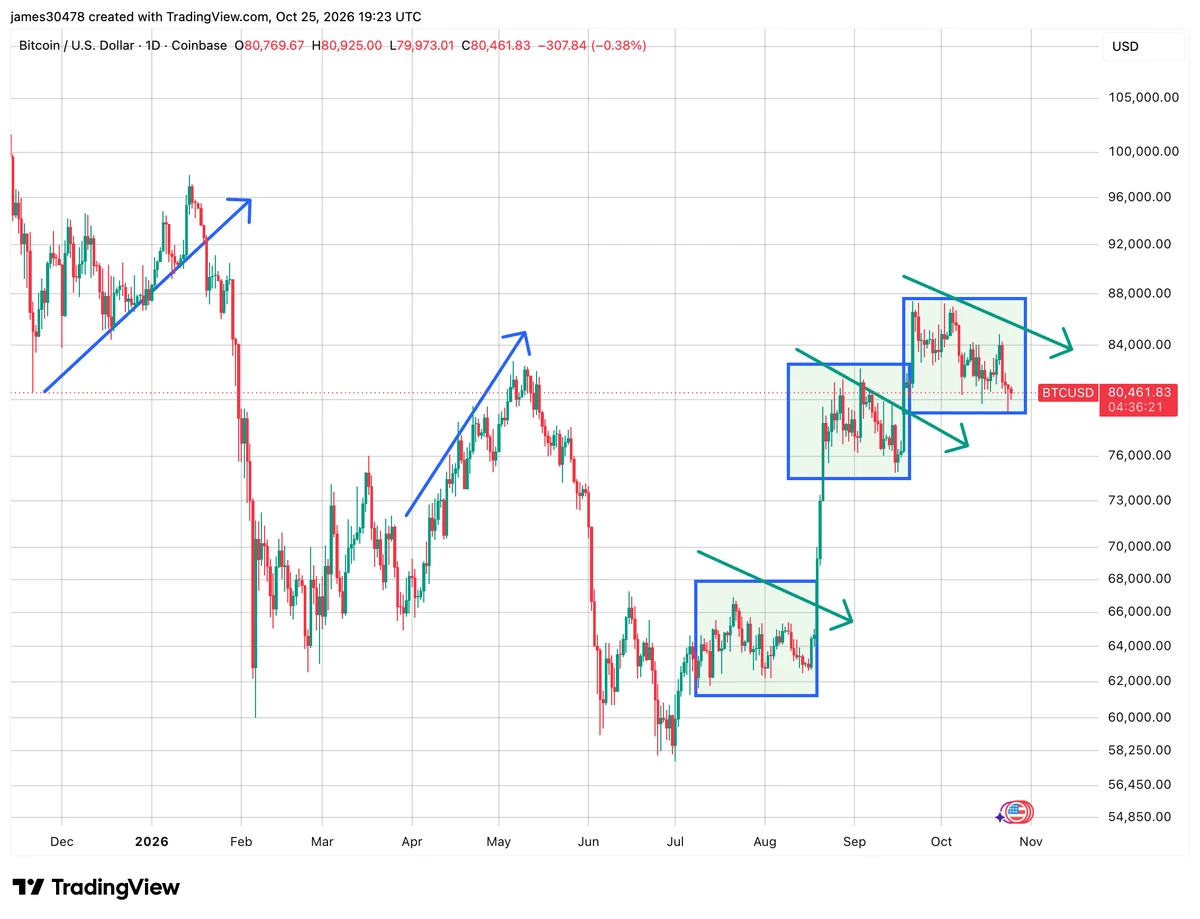
$BTC Is Bitcoin’s long-term bullish structure still intact?
Everyone is focused on what happens next. I’m focused on the bigger picture.
On the higher-timeframe chart, $BTC is trading near $80k, with the $41,000–$56K area marked as the main accumulation zone.
My key levels:
Accumulation zone: $41,000–$56K. The bullish structure must hold.
Long-term targets: $126K→ $300K→ $600K→ $1M. A deeper pullback doesn’t automatically invalidate the bullish thesis. The key question is whether BTC can hold its macro structure.
Are you focused on the macro structure, or just watching the daily noise?$XAU
post-image
BTC+0.07%
BTC+0.06%
XAU+0.20%
  • 1
@WalrusProtocol, a Walrus-backed project in the SUI ecosystem
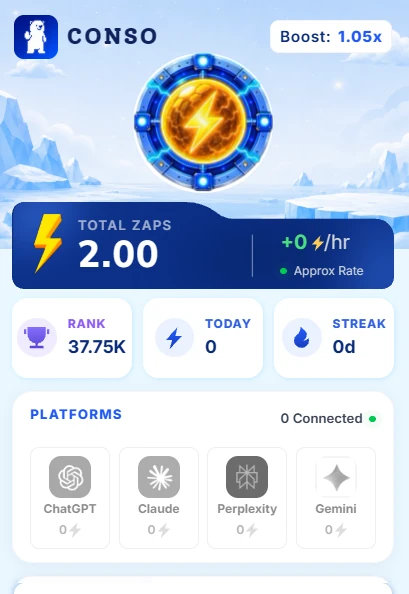
@conso_xyz is now mining!
Download the extension on Chrome:
Enter referral code: CONSO-SV14Q
Daily check-ins are now available; link X and complete social tasks
Connect AI platforms such as ChatGPT, Claude, etc. After each eligible BOT completes the connection, ZAPS mining speed can get an additional 25% boost
#CONSO #ZAPS
post-image
SUI-1.29%
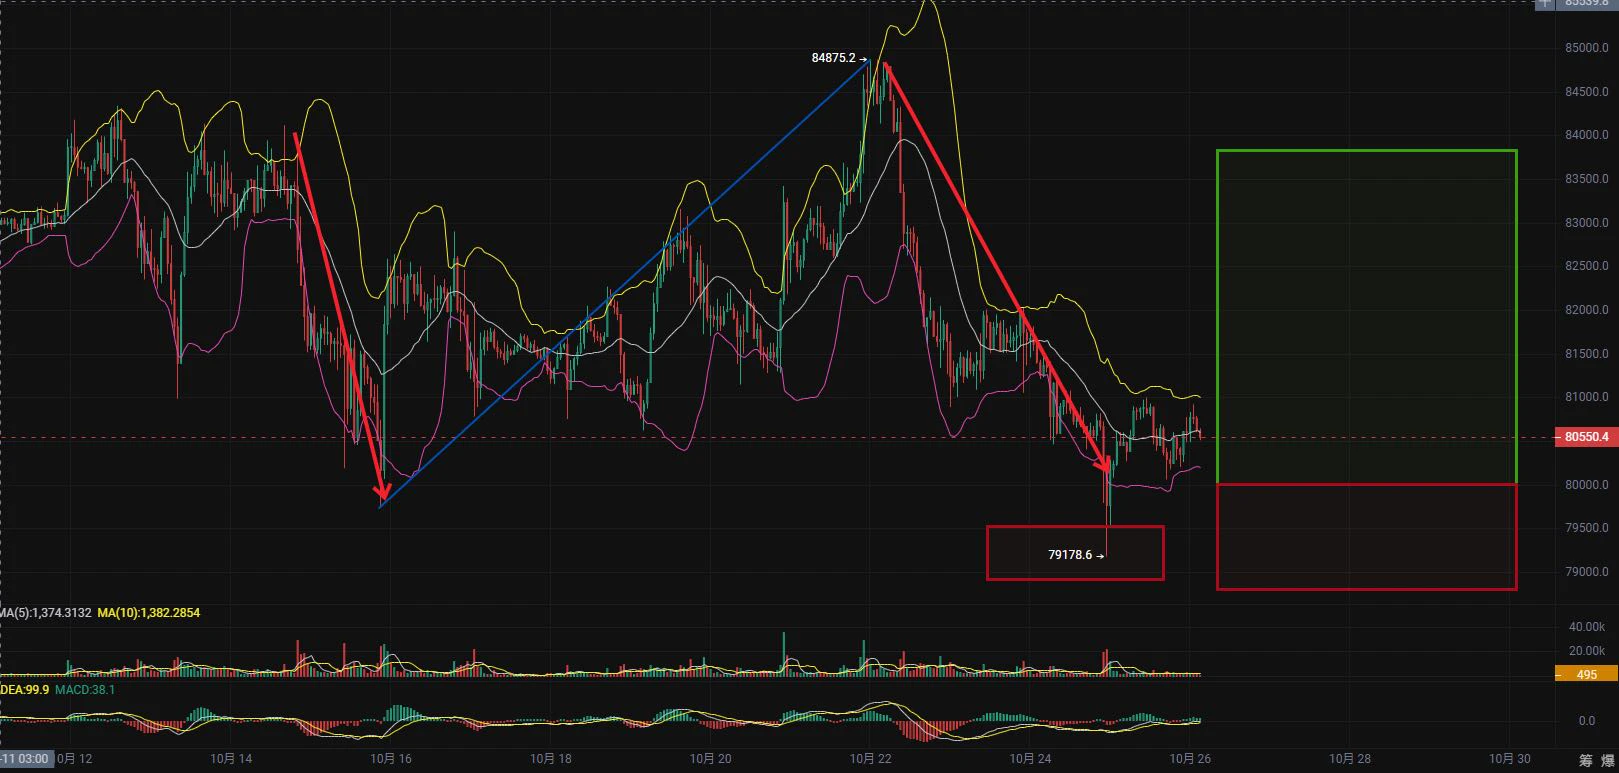
10.26 BTC Public Trading Outlook
Long Trade Setup$BTC
  Entry range: 795-802
  Stop-loss: around 788 (depending on the entry price and position size)
Take-profit targets
  First target: around 810 (middle Bollinger Band support turns into resistance)
  Second target: around 820 (upper Bollinger Band resistance)
Third target: 828 (in view if the second target is broken)
Fourth target: 838 (in view if an evening trend develops)
Trading factors: Brent crude oil remains at elevated levels, pushing up inflation expectations. This, in turn, will constrain the Fed’s room to e
post-image
BTC+0.07%
ETH+0.31%
ZEC+1.26%
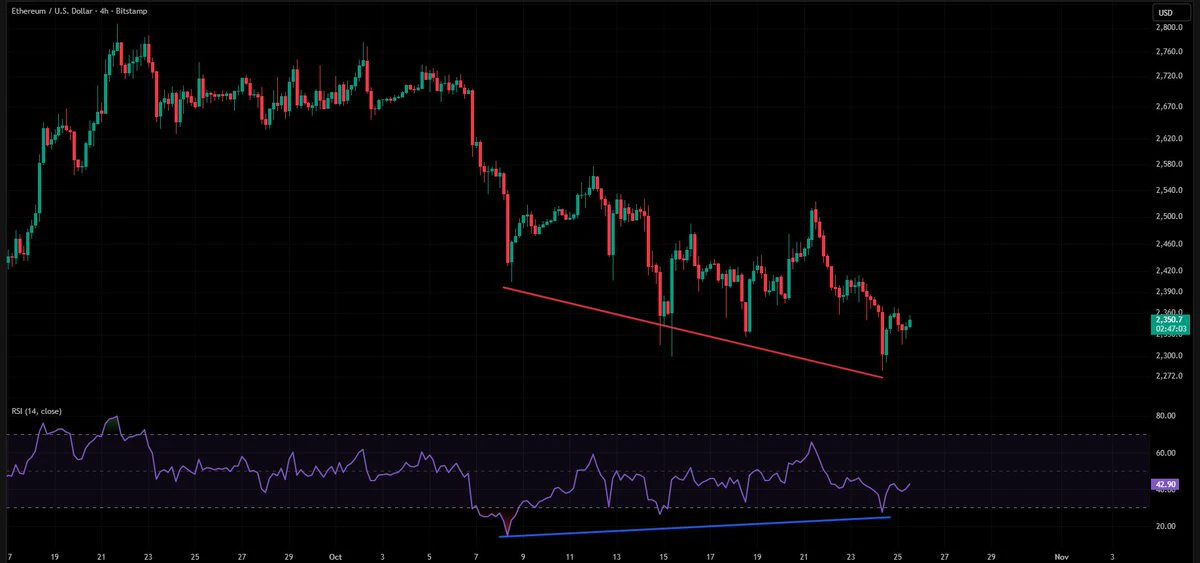
$ETH is showing bullish RSI divergence with price making a lower low while RSI forms a higher low.
Selling pressure may be fading. A break above $2,420 could trigger a relief rally towards $2,520, with a stronger reversal possible if resistance breaks.
post-image
ETH+0.28%
Which is your most favourite Dogs?
$CKOM #Ping #WIF #Drover #Aido #BabyDoge #Doge
#Milo #PolyDoge #Shib $DOGS
#Elon #Kishu #Floki #BONK
post-image
DOGS+0.39%
WIF-2.67%
BABYDOGE-1.97%
DOGE-0.01%
MILO+4.29%
$BTC ‌ is approaching a make or break zone. Will buyers defend $79.5K or give bears more room?
Bitcoin is trading near $80.7K after another rejection around $83K. Price is still above the daily Supertrend at $79.5K, but the recent lower highs show buyers need to step up soon.
Levels to keep on your radar:
Support: $80K to $79.5K
Major support: $78.8K
Resistance: $81.85K to $82K
Next hurdle: $84.9K
Holding $79.5K could keep a recovery attempt alive. A clean reclaim of $82K would improve the picture, while a breakdown below the Supertrend could expose lower support.
BTC is at a key decision po
BTC+0.06%
TSLA-0.62%
  • 3
  • 1
$TAG 24-hour turnover is $47 million, yet the price only ground from 0.0004 to 0.0005, and after an 11% rise people are already shouting that the bull market is back? Let me pour some cold water on that: this price-volume relationship is a classic prelude to high-level distribution. That wick at 0.0007 was a test, not a launch.
My strategy in one sentence: don’t chase the breakout; wait for a pullback. Accumulate in batches in the 0.00045-0.00048 range, cap your position at 15% of total capital, and enter in three tranches. Set a stop-loss at 0.00038; if it breaks, don’t hold on—this coin’s vo
TAG+10.97%
$GRIFFAIN This coin’s funding rate was once very high, with longs willing to pay significantly elevated costs to keep their positions open. If that situation persists, the market can easily become overheated.
I opened a short when the funding rate was high and the price was struggling to rise. The logic was that longs’ costs would keep piling up, and their subsequent position reductions could themselves push the price down. Later, the market weakened, and forced selling amplified the decline.
This short trade returned more than 2x, mainly by capturing the deleveraging phase. What really drives
GRIFFAIN+1.96%
BTC+0.07%
ETH+0.31%
$CAP ‌ is back in the spotlight, but can this breakout push beyond $0.11?
CAP is up over 41% today, reclaiming the $0.10 level after consolidating around $0.07. The move is backed by strong momentum, and price remains above the daily Supertrend at $0.06086.
Levels I'm watching:
Support: $0.100 to $0.0888
Key support: $0.075 to $0.070
Resistance: $0.1117
Major target zone: $0.1219
A clean break above $0.1117 could set up a retest of $0.1219. If price slips below $0.10, a pullback toward the breakout zone would be worth watching.
CAP has made an impressive move. Now the real strength will be i
CAP+37.44%
NVDA-0.60%
  • 4
  • 2
Analysis crypto coin
live-cover
LIVE2,073
$CAP Up 37% in a day to 0.1117, then dumped back to 0.1079. I looked back at the altcoin rally patterns after the previous three halvings—every cycle, between the fifth and seventh month after the halving, we saw this “violent shakeout first, then a major rally” pattern. The current 179.7M trading volume at a price just above $0.10 shows a price-volume profile close to that of small-cap coins before they took off in Q4 2020, but the market cap base is a full order of magnitude lower than at the same point in the last cycle.
Bull case: The 24h low was 0.0773 and the high was 0.1117, a 44% range
CAP+37.44%
gn frens.
hope you enjoyed your weekend 😊.
post-image
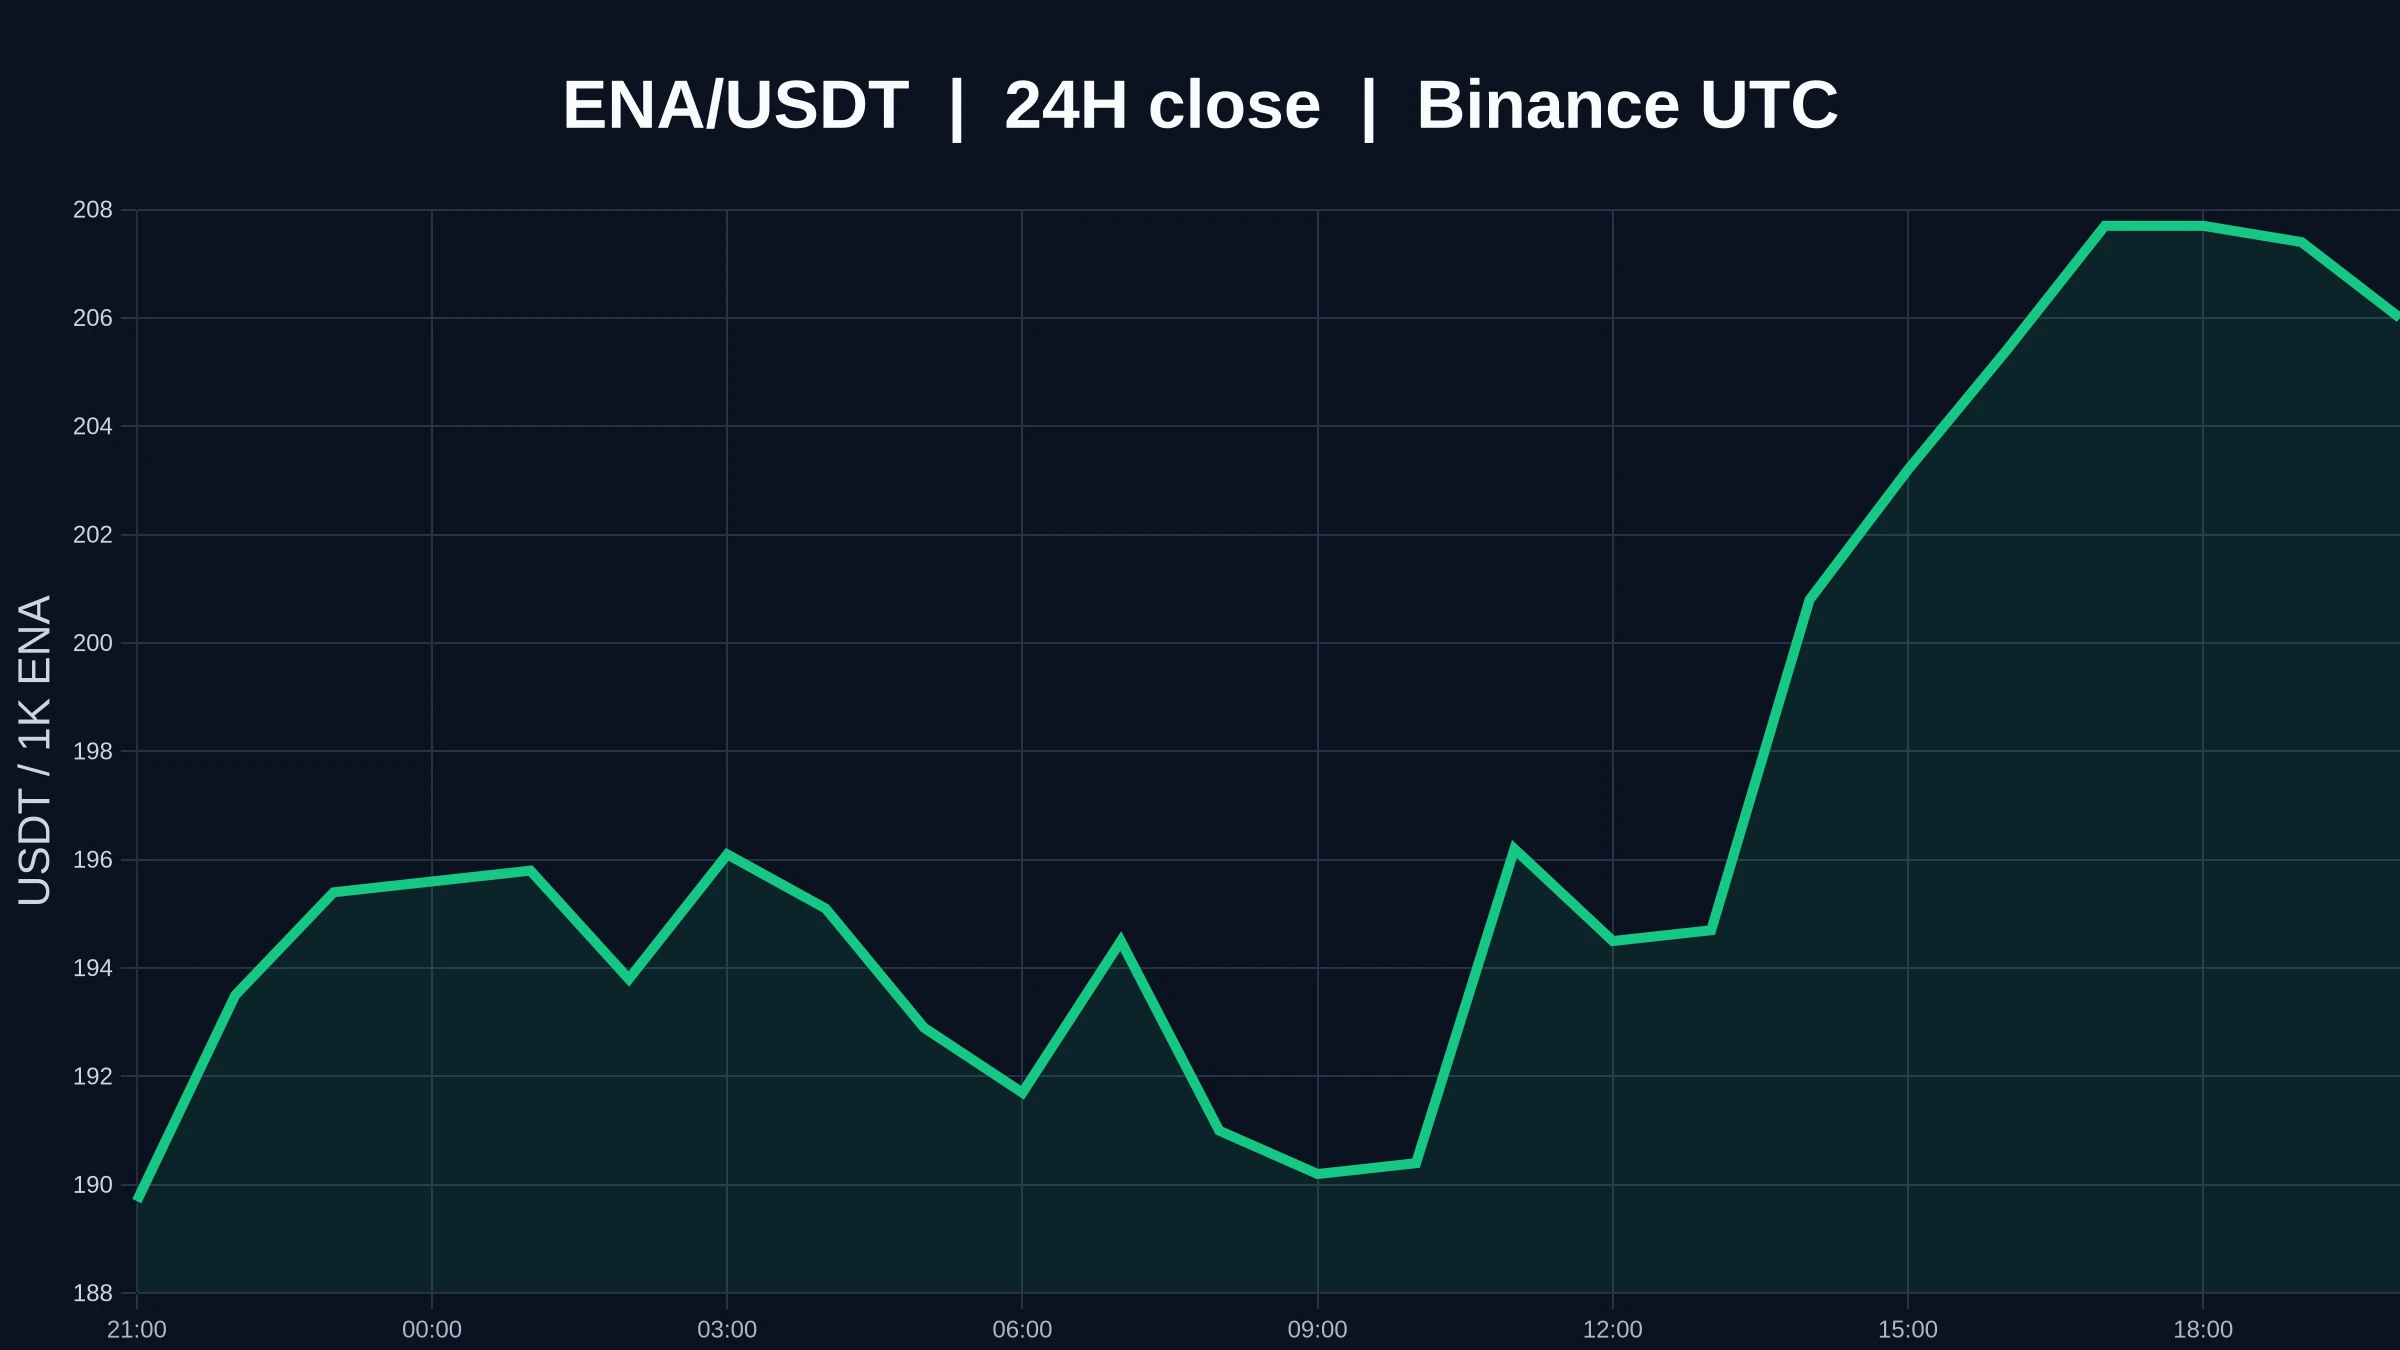
Treat $ENA as a question to be verified: current price 0.2059, up 8.88% over 24 hours, with participation at 0.05x. What is known is clear; what remains unknown is key: whether there will be real buying once key levels are reached. Here’s a simple rule of thumb: a sharp 24-hour rise or fall describes what has already happened; whether the next move can continue depends on whether key levels and trading volume continue to align. Gainers and losers lists record the past, and what’s most misleading is treating the past as the next move.
Don’t draw lines all over the screen. This time, just note
post-image
ENA+9.06%
Load More

Join 40 M users in our growing community

⚡️ Join 40 M users in the crypto craze discussion

💬 Engage with your favorite top creators

👍 See what interests you

Trending Topics

USEarningsSeason

102.33k Views3.53k Discussing

The U.S. Q3 earnings season is in full swing, with major tech companies including Tesla and Meta reporting results. Market focus is shifting beyond revenue and profit toward AI spending, capital expenditure, margins and forward guidance. Which company’s earnings are you watching most closely?

GateWCTCS9GlobalTradingCompetition

729.68k Views8.1k Discussing

USConsumerSentimentNearRecordLow

12.61k Views304 Discussing

View More