



Share your thoughts
placeholder
Article
Everyone’s staring at FLOCK’s green dildo—but the 4H chart is screaming something else entirely.

$FLOCK /USDT - SHORT

Trade Plan:
Entry: 0.07105 – 0.07357
SL: 0.08437
TP1: 0.06326
TP2: 0.05723
TP3: 0.04819

Why this setup?
Why now? The 1D trend is *range*, not reversal. RSI on the 15m is weak at 43.65—no buying fuel. ATR (0.005) shows tight coils, which snap hard. Your entry window (0.07105–0.07357) is sitting under a falling knife. SHORT bias at 55% is the only honest signal here. TP1 at 0.06326 is a 12% drop; TP2 at 0.05723 is a 20% flush. This is a range breakdown play, not a dip-buy.
FLOCK+31.82%
I wasn’t expecting this move to hold anyway, but the market directly handed me a big gift in the form of a short position. Now that’s what I call great service.
When I checked the charts after lunch, $COLLECT was still stubbornly holding up, but every rebound looked increasingly weak, with volume shrinking each time while the sell orders showed no mercy. With fewer and fewer buyers stepping in, I knew it was time to act. I entered a short around 0.06470 and left the rest to time.
The current price has now slipped to 0.04253, pushing the return to +674.69%. This profit feels great; even the lo
post-image
COLLECT-34.52%
ZEC+14.91%
LAB-3.00%
#GateEventContractTradeSharingChallenge #ZEC
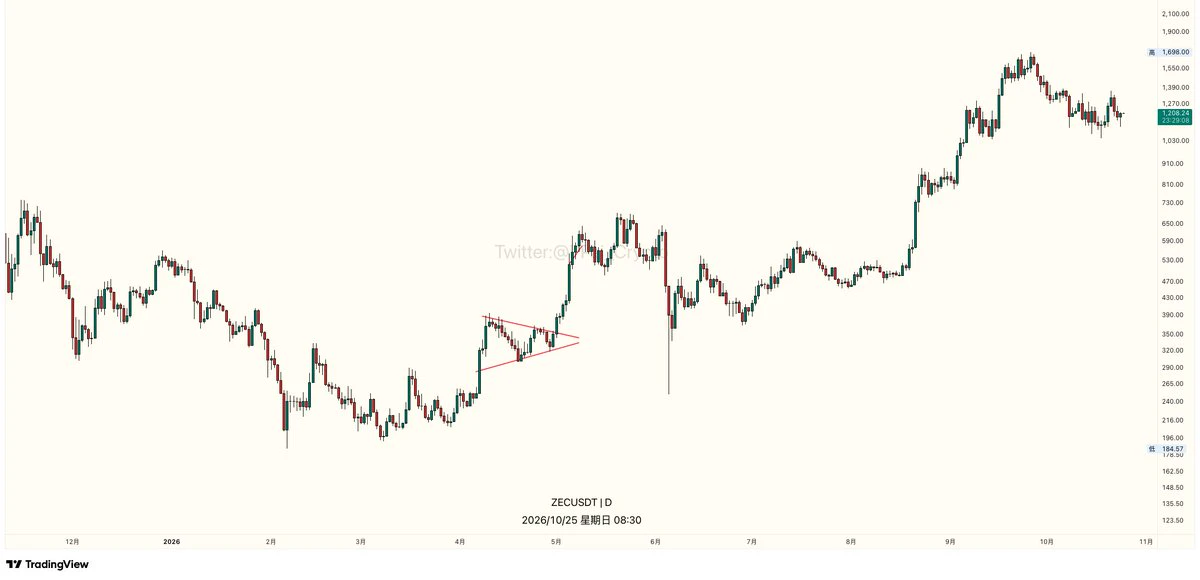
Zcash (ZEC) is showing exceptionally strong momentum. With your quoted current price around $1,189, the latest market data places ZEC around $1,184, with an intraday high near $1,204 and low around $1,005. That means the 24-hour move is roughly +16–19%, depending on the exchange and exact snapshot.
The most important development is that ZEC has successfully moved above the psychological $1,000 area after breaking through a major multi-year resistance zone. Recent reports attribute the acceleration partly to a short squeeze, with roughly $13M+ in Z
post-image
ZEC+15.10%
#ETH Ethereum is trading around your quoted $2,492, and the latest market snapshot is also around $2,494, with an intraday high near $2,521 and low around $2,452. The broader 24-hour move is roughly +1.5–2%. Recent market analysis shows ETH continuing to hold its strong monthly recovery, while institutional demand and ETF flows remain important catalysts.
ETH Momentum — Why Traders Are Watching $2,500
ETH's current structure is interesting because price is sitting directly around the major $2,500 psychological level. This is the decision zone between continuation and another rejection.
Recent
post-image
ETH+0.50%
Crypto Academy: Ethereum (ETH) High-Level Consolidation on September 7 Is Not a Rest—Is Ethereum Completing a Major Shakeout of Positions? Latest Market Analysis Reference
  
Ethereum is currently priced at 2490, and the market has once again fallen into an agonizing state of neither rising nor falling. Many friends are now caught in a dilemma: they fear being trapped at the top if they chase the rally, but also fear that another upward move will sweep away their stop-losses if they go short, leaving them repeatedly battered by the market. Many people always want to catch a major surge or plun
ETH+0.40%
Layout for Bitcoin, Ethereum, and Dogecoin
live-cover
LIVE3,488
  • 1
I was just about to go to the forum and start cursing, but then I saw my balance. Forget it—the market is always right. 😂

When the sell-off hit during the early session, many people panicked and cut their losses. I kept an eye on $BTR and instead thought: each rebound was weaker than the last, volume kept shrinking, and nobody was buying on the way up. How much longer can a market with insufficient support hold up? I went straight in with a short order at 0.17647.

The later script played out exactly as I predicted, with the price slowly drifting downward to 0.04716, securing +1441.79%. Ma
post-image
BTR-0.84%
DOGE+1.62%
BNB-3.75%
#Gate60MillionUsers
A HUGE CONGRATULATIONS TO GATE ON SURPASSING 60 MILLION GLOBAL USERS! 🎉💙
60 million users is not just a number — it represents 60 million individual journeys, experiences, decisions, opportunities, successes, and lessons. Behind this massive milestone are millions of people who have made Gate part of their crypto journey, and I am proud to say that I am one of them.
My own journey with Gate has been much more than simply opening an exchange and placing trades. Over time, Gate has become a platform where I have followed the crypto market, explored different assets, watche
BTC-0.33%
GT-4.92%
  • 3
I had just switched the app to the background, and it shot right back up—are you playing hide-and-seek with me? 📈

A few days ago before bed, I was thinking: $LIT had been hovering around 3.753 for so long without breaking the key level, while the buy orders kept getting thicker little by little. Wasn't it about to make a move? So I opened a long position, set my stop-loss, and went to sleep.

When I opened the chart in the morning: the current price was 4.565, with +1043.98%% secured. That's absolutely wild. Here's your answer, folks—this run wasn't a waste of waiting. It dragged on for so
post-image
LIT-2.55%
SOL+2.66%
DOGE+1.62%
$WLFI
WLFI is much less convincing here.
It had the big spike to $0.0748, but failed to hold the breakout and has been grinding lower since. Price is currently below the 4H SuperTrend at $0.0585, so momentum is still weak.
I’d want to see $0.0585 reclaimed before getting bullish again. Until then, $0.055–0.0506 is the area I’d watch for support.
post-image
WLFI-0.91%
  • 2
Jinman’s Gold Forecast for Next Week: Under Pressure After a Bottoming Rebound, Key Long/Short Levels and Trading Strategy for Gold Next Week!
Gold was quite volatile this week, falling first before staging a sizable rebound. After plunging to a low of 4282, it surged, reached a high of 4510, and then quickly fell back. It is now consolidating around 4431, with bulls and bears locked in a fierce short-term battle.
Next week, focus on two key events: successive speeches by Federal Reserve officials and the nonfarm payrolls report. If policy turns dovish, gold could continue rising; if rate hike
post-image
BTC-0.33%
ETH+0.50%
obese lesbian @orangie and the rest of the @potionalpha ret#rds send their best wishes to you for dumping on your head $grass
post-image
GRASS+0.34%
I didn’t chase $EDGEX when it surged during the day, as a long-term trendline was right above it and it would have been difficult to place a stop-loss after entering. I waited for it to pull back and regain its footing before entering a long position based on the lower-timeframe structure.

After entering, it consolidated for a while. I didn’t rush to trade back and forth; once the price moved a certain distance away from my cost basis, I first closed 80% to lock in the profit on the core position, leaving the remaining 20% to follow the trend.

After the breakout candlestick appeared, I too
post-image
EDGEX-2.21%
XRP-0.20%
LAB-3.00%
Everyone’s staring at the bid, but the 4h tape just whispered a secret about TRUMP that nobody wants to hear.

$TRUMP /USDT - SHORT

Trade Plan:
Entry: 2.296 – 2.312
SL: 2.381
TP1: 2.246
TP2: 2.208
TP3: 2.150

Why this setup?
- The 15m RSI is already bleeding at 29.2—oversold, but that’s not a buy signal; it’s a warning that momentum is still pointing down.
- Price is hugging 2.304 with a hard ceiling at 2.381 (SL) and a daily trend that’s flat—meaning no rescue rally is coming.
- Why now? The ATR (0.032) shows volatility is compressing, and when that happens inside a range, the breakou
TRUMP-2.61%
The microstrategy of Robinhood is sitting at 300K.
post-image
HOOD-2.12%
$DOOD It surged 25% in an hour, with trading volume hitting $17.8 million and the high reaching 0.0018, coming straight for the jugular. My hands were shaking while watching the chart—this move isn’t retail sentiment; it’s being driven by expectations for macro liquidity. Don’t ask why there was no CPI: after the nonfarm payrolls data was released, the market’s rate-cut pricing had already changed. CME FedWatch shows the probability of a September rate cut soaring to 78%, while the U.S. Dollar Index DXY fell 0.4% in tandem. The U.S. 10-year Treasury yield curve steepened, capital flowed out of
DOOD+22.82%
BTC-0.33%
NAS100+0.15%
Everyone’s watching gold, but you’re blind if you missed $XAU /USDT’s 4h trap door.

$XAU /USDT - SHORT

Trade Plan:
Entry: 4432.35 – 4434.39
SL: 4443.13
TP1: 4426.05
TP2: 4421.17
TP3: 4413.84

Why this setup?
Why now? The 1D trend is *range*, yet the 4h signal just armed SHORT with 55% confidence. RSI on the 15m is crushed at 38.81—momentum is fading fast. Price is pinned at 4433.37, squeezing between entry support and a 4.06 ATR that’s begging for a 10-point drop. TP1 at 4426 is the first crack; TP3 at 4413 is the floor if sellers commit. This isn’t a gamble—it’s a low-risk slide with inv
XAU-0.14%
crypto market
live-cover
LIVE969
I originally just wanted to mooch a free breakfast, but the market ended up trapping me for half a year. I opened the chart this morning, and $TRUTH shot straight up from the 0.010718 area on a bullish candle, without even giving me time to hesitate.

I had my eye on it during those days of sideways trading at the bottom. Funds were quietly flowing in, key levels kept moving higher, and pullbacks never broke support. I was actually worried that going long would mean getting dragged through another round, but thankfully it didn't play games this time.

Now at 0.012348, with +732.91% secured.
post-image
TRUTH0.00%
ADA+0.32%
LAB-3.00%
Load More

Join 40 M users in our growing community

⚡️ Join 40 M users in the crypto craze discussion

💬 Engage with your favorite top creators

👍 See what interests you

View More