

Square
Following
Hot
News
Profile
Share your thoughts
placeholder
Article
$SNDK Hey, I stared at this chart for a while, and now I want to share a few heartfelt words with you guys.
Looking at the market, you can't just see that it's up 2.21% and start celebrating. Let's dig into the chart and see what clues we can find.
First, the market's overall “climate” is off.
Look at the scrolling news in the chart: “Trader Loracle's Nasdaq short position has turned profitable.” What's the implication? The broader environment is falling! The shorts on U.S. tech stocks are popping champagne and counting their money. As a stock token, no matter how strong SNDKG is, can it withs
post-image
SNDK-0.56%
  • 2
  • 1
live market update
live-cover
LIVE2,099
Last night’s low-point resonance was very timely, zec handsome guy #韩国KOSPI大涨3.3%
ZEC+10.21%
PPI 6.3% Blows Up, Yet the Market Actually Rebounded: Who Is “Pretending Not to See” Inflation?
When you see the 6.3% PPI figure, your first reaction is, “It’s over—rate hikes are coming. Run.”
Then you open the charts—the three major US stock indexes all closed higher, while Bitcoin was pulled back to $82k after breaking below $80k.
You’re baffled: With data this bad, why are prices rising?
US September PPI rose 6.3% year-on-year, versus expectations of 5.4%, hitting its highest level since December 2022. Core PPI rose 5.0% year-on-year, versus expectations of 4.4%. The month-on-month increas
post-image
BTC+1.10%
ETH+2.43%
SKHY+4.34%
Most funds are betting that BTC will hold above $85,000 in October, and this expectation is already fully priced in, leaving limited room for upside.
A breakout above $87,500 and a sharp drop to $77,500 offer better odds, representing moves that deviate from mainstream expectations; when the market is uniformly bullish, beware the reversal risk from those expectations failing.
post-image
BTC+1.10%
Uninstalling Hongguo is the first step for young people toward success
How much would you need to be paid to uninstall it?
$KORUB Short-term outlook is bullish, but the risk of chasing highs is already considerable. Here is the conclusion first: the current price of 11.9 is above MA5 (11.744) and MA20 (11.389), the bullish moving-average alignment remains intact, and the MACD histogram at +0.1204 is still positive, with the trend structure under bullish control; however, RSI is only 53.4, indicating that this +11.84% rally has not pushed momentum into overbought extremes, leaving room for support on a pullback, while also meaning that the upper Bollinger Band at 12.4672 is the nearest resistance test.
From a capit
post-image
MEGA+0.04%
#美国9月PPI大超预期 #美国9月CPI超预期 The Federal Reserve, Inflation, and Employment: How Ordinary People Can Understand U.S. Macroeconomic Indicators
Don’t confuse CPI, PCE, and PPI
CPI: Price changes on the consumer sideCPI, the Consumer Price Index, measures the average change in the prices of a basket of goods and services purchased by urban consumers, including food, housing, transportation, and medical care. Every household has a different consumption structure, so personal experiences and the index average may differ. The “core CPI” often mentioned in the news excludes food and energy. This does not
XAU+0.44%
#USSeptemberPPIBeatsExpectations 🇺🇸 US September PPI Beats Expectations: Inflation Concerns Return to Global Markets
The United States has released its September 2026 Producer Price Index (PPI) report, delivering a stronger-than-expected reading and bringing inflation back into focus for investors, economists, and cryptocurrency traders. The latest data suggests that price pressures across the US economy remain elevated, creating fresh uncertainty around the Federal Reserve’s future monetary policy decisions.
According to the US Bureau of Labor Statistics, the Producer Price Index for final
post-image
BTC+1.10%
ETH+2.43%
GAS-0.46%
#USSeptemberPPIBeatsExpectations Wholesale Inflation Surges, and Energy Is the Main Driver
Producer prices in the United States rose far more than analysts expected in September 2026, and the report is drawing attention from traders, businesses and policymakers.
The headline numbers
The Producer Price Index (PPI) rose 1.3% month over month, more than double the roughly 0.6% increase economists anticipated. The Bureau of Labor Statistics said this was the largest monthly advance since March 2022. The prior months were smaller: 0.5% in August and 0.2% in July.
On an annual basis, the index rose
Falcon_Official
#每周来晒 #USSeptemberPPIReleased
#ShareWeekly Producer Inflation Meets a $80K Bitcoin Test: Can the Fed Afford to Ease?
Bitcoin is entering September’s U.S. Producer Price Index release with a difficult macroeconomic backdrop. The key question is whether wholesale inflation confirms the price pressures already visible in consumer data or offers the Federal Reserve some room to reconsider its policy path.
Economists are forecasting a 0.6% monthly increase in headline PPI for September, compared with 0.4% in August. Core PPI, excluding food and energy, is expected to rise 0.3%, up from 0.2%. The annual headline rate is forecast at 5.5%, compared with 5.4% previously. These are expectations, not confirmed results; the actual figures must determine whether producer inflation has surprised markets.
The starting point is already uncomfortable for policymakers. September CPI rose 0.6% month-on-month and 3.7% year-on-year, while core CPI increased 0.3% monthly and 2.6% annually. Gasoline prices climbed 9.1% during the month, adding to headline inflation pressure. If producer prices also exceed expectations, markets may worry that higher business costs could feed into consumer prices and make a near-term shift toward easier monetary policy more difficult.
The composition of PPI will matter as much as the headline. A surge concentrated in energy or goods could signal a different inflation problem from persistent increases in services. Investors should watch final-demand goods and services, energy-related components, transportation and trade services, alongside any revisions to earlier readings. A softer headline accompanied by stubborn core services would not necessarily deliver a clean bullish signal.
Bitcoin’s sensitivity to interest-rate expectations is already visible in the current market backdrop. On October 15, Barron's reported BTC at $80,743, down 1.2%, after an overnight low of $80,247, as hotter consumer inflation strengthened rate-hike concerns. These are reported market levels, not a verified PPI-release reaction.
Three scenarios now matter. If headline and core PPI both come in below forecasts, Treasury yields and the dollar could face downward pressure, potentially improving conditions for BTC and other risk assets. If both exceed expectations, renewed rate-hike concerns could strengthen the dollar and weigh on crypto. A mixed report may leave markets focused on core services, revisions and whether the increase is broad-based.
The confirmation test is the cross-market response: BTC’s price and volume after publication, the U.S. dollar index, Treasury yields and Nasdaq futures. A brief Bitcoin bounce alone would not establish a lasting trend; sustained movement alongside rates and the dollar would provide stronger evidence of a macro-driven repricing.
The central issue is not whether one inflation report automatically makes Bitcoin bullish or bearish. It is whether producer-price pressure changes the expected path of monetary policy and whether traders have already priced that risk into BTC.
Will September PPI reinforce the case for tighter U.S. monetary policy, or give Bitcoin room to recover? The actual release and the market’s reaction not the forecast alone will decide which signal carries more weight.
repost-content-media
GAS+3.50%
FUEL-2.96%
EURUSD-0.42%
  • 2
#USSeptemberPPIBeatsExpectations CPI and PPI Both Run Hot: Is the Market Entering a New Inflation Shock?
The inflation debate has taken another serious turn. After stronger-than-expected U.S. CPI data, September’s Producer Price Index (PPI) has added further pressure to an already sensitive macroeconomic environment. With producer inflation reportedly rising to 6.3% year-over-year and 1.3% month-over-month, investors are being forced to reconsider one of the most important questions in financial markets: Is inflation becoming more persistent than expected, and what does that mean for risk asse
post-image
  • 1
Finally ran into it
Turns out it was an older man sprinkling water
post-image
10.16 ETH Positioning Strategy
  Entry zone: around 2410 for a long position (the dense chip exchange zone during this rally)
  Stop-loss defense: 2385 (a break below invalidates the long thesis; exit immediately)
  First target: around 2445 (resistance level where the Bollinger middle band converges)
  Second target: around 2485 (upon a high-volume breakout above yesterday’s high, reduce the position by 60%)
  Third target: 2510 (the ultimate target above the 2500 round-number level)
  ETH is currently in a short-term pullback within a clear bullish trend. The Bollinger Bands remain broadly u
post-image
ETH+3.13%
Tong-ge's 10.16 ETH strategy
$ETH Enter a short around 2460-2480, stop-loss at 2500, targets 2400-2350-2300
Current price: 2442. Yesterday morning, it plunged to a low of 2313, then rebounded slightly. In the evening, bearish PPI news prompted BTC to retest 2323, but it did not break the morning low. It then rebounded sharply to a high of 2466 and has now pulled back to 2438. The fact that even bearish PPI news failed to break the previous low shows that bears are struggling to push prices lower in the short term. However, the rebound to 2466 failed to hold, so overhead resistance remains effe
post-image
ETH+3.13%
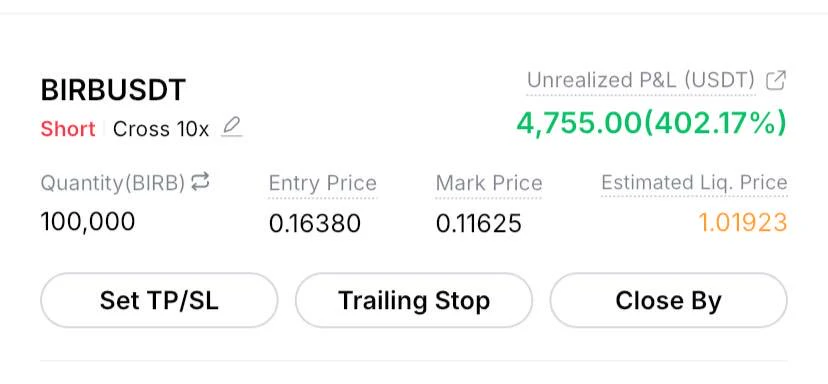
Everyone, trust me, $ZEREBRO is ready for a major drop, and I’m opening a 10x leveraged short position now
Sell: 0.0520 - 0.0515Take profit: 0.04800 / 0.04400 / 0.0400Stop loss: 0.0560Everyone, I’m 99% certain the price will drop sharply and keep falling because it has already surged significantly and is now clearly showing signs of weakness. Who wants to open a confirmed short position with me? Not investment adviceTrade here 👉🏻 $ZEREBRO
post-image
ZEREBRO+32.17%
$FIL5L The gap between the current price and NAV is so large—30% already. Doesn’t the platform care? Is there any fairness left????
post-image
FIL5L+1.49%
  • 2
ELON DOESN’T BUILD ANYTHING!!!
post-image
$BTC Earlier today, I mentioned that late shorts were at risk of getting squeezed.
This is exactly what we’ve seen now, resulting in price pushing up roughly 3.5% from the lows.
However, that does not mean that longs are safe yet.
BTC still needs to reclaim $84.4k first in order to break bearish structure and shift momentum back in favor of buyers.
Until there is a confirmed break back above that level, another retest of the lows remains possible.
That said, with all the unswept lows taken out and the majority of the remaining liquidity now resting above price, I would still slightly favor a f
post-image
BTC+1.10%
Aptos Labs' Shelby storage network, co-developed with Jump Crypto, now runs production workloads for Teepin, Pictor Network and PathPulse AI in private beta. The three customers span enterprise AI, 3D rendering and spatial data.
@Aptos
APT+9.08%
market updates on today $BTC & $XAU
live-cover
LIVE1,525
Load More

Join 40 M users in our growing community

⚡️ Join 40 M users in the crypto craze discussion

💬 Engage with your favorite top creators

👍 See what interests you

Trending Topics

USSeptemberPPIBeatsExpectations

91.35k Views1.9k Discussing

US September PPI came in at 6.3% YoY, well above the 5.3% market expectation, pointing to renewed producer-side inflation pressure. Weekly jobless claims were 199K, broadly in line with forecasts. Could hotter inflation further reduce room for rate cuts, and what does it mean for $BTC, US stocks, and gold?

GateWCTCS9GlobalTradingCompetition

37.87k Views6.4k Discussing

WarshIMFSpeech

62.4k Views744 Discussing

View More