Square
Following
Hot
News
Profile
Share your thoughts
placeholder
Article
Guys! We’ve tested the daily moving average for the second time—do you still believe the bull market will continue? #比特币反弹至8.3万美元
post-image
BTC+0.79%
$BTC NOONE has this chart.
Bitcoin is in an upward Macro trend.
Bottom is in unless Global mayhem.
$ETH $QNT $XRP $SOL
post-image
BTC+0.79%
ETH+0.48%
QNT+2.87%
XRP+1.39%
SOL+0.18%
BTC,GT,AND RAVE LIVE TREADE
live-cover
LIVE1,047
Layout: Bitcoin, Ethereum, Dogecoin
live-cover
LIVE1,251
  • 1
People often ask whether market moves can be seen in advance.
There’s no supernatural foresight—just keeping your own rhythm in the fog. $BTC $ETH
Fear not the clouds that obscure your view; the direction set yesterday morning—BTC at 830 and ETH at 2515—came through as promised.
When the mountains seem to end and the waters run out, a new village appears amid the shade of willows and bright flowers.
The market is ever-changing, and most people simply follow the crowd.
So-called precision is not foreseeing the future, but calmly understanding the underlying trends. #Gate亮相TOKEN2049
BTC+0.87%
ETH+0.57%
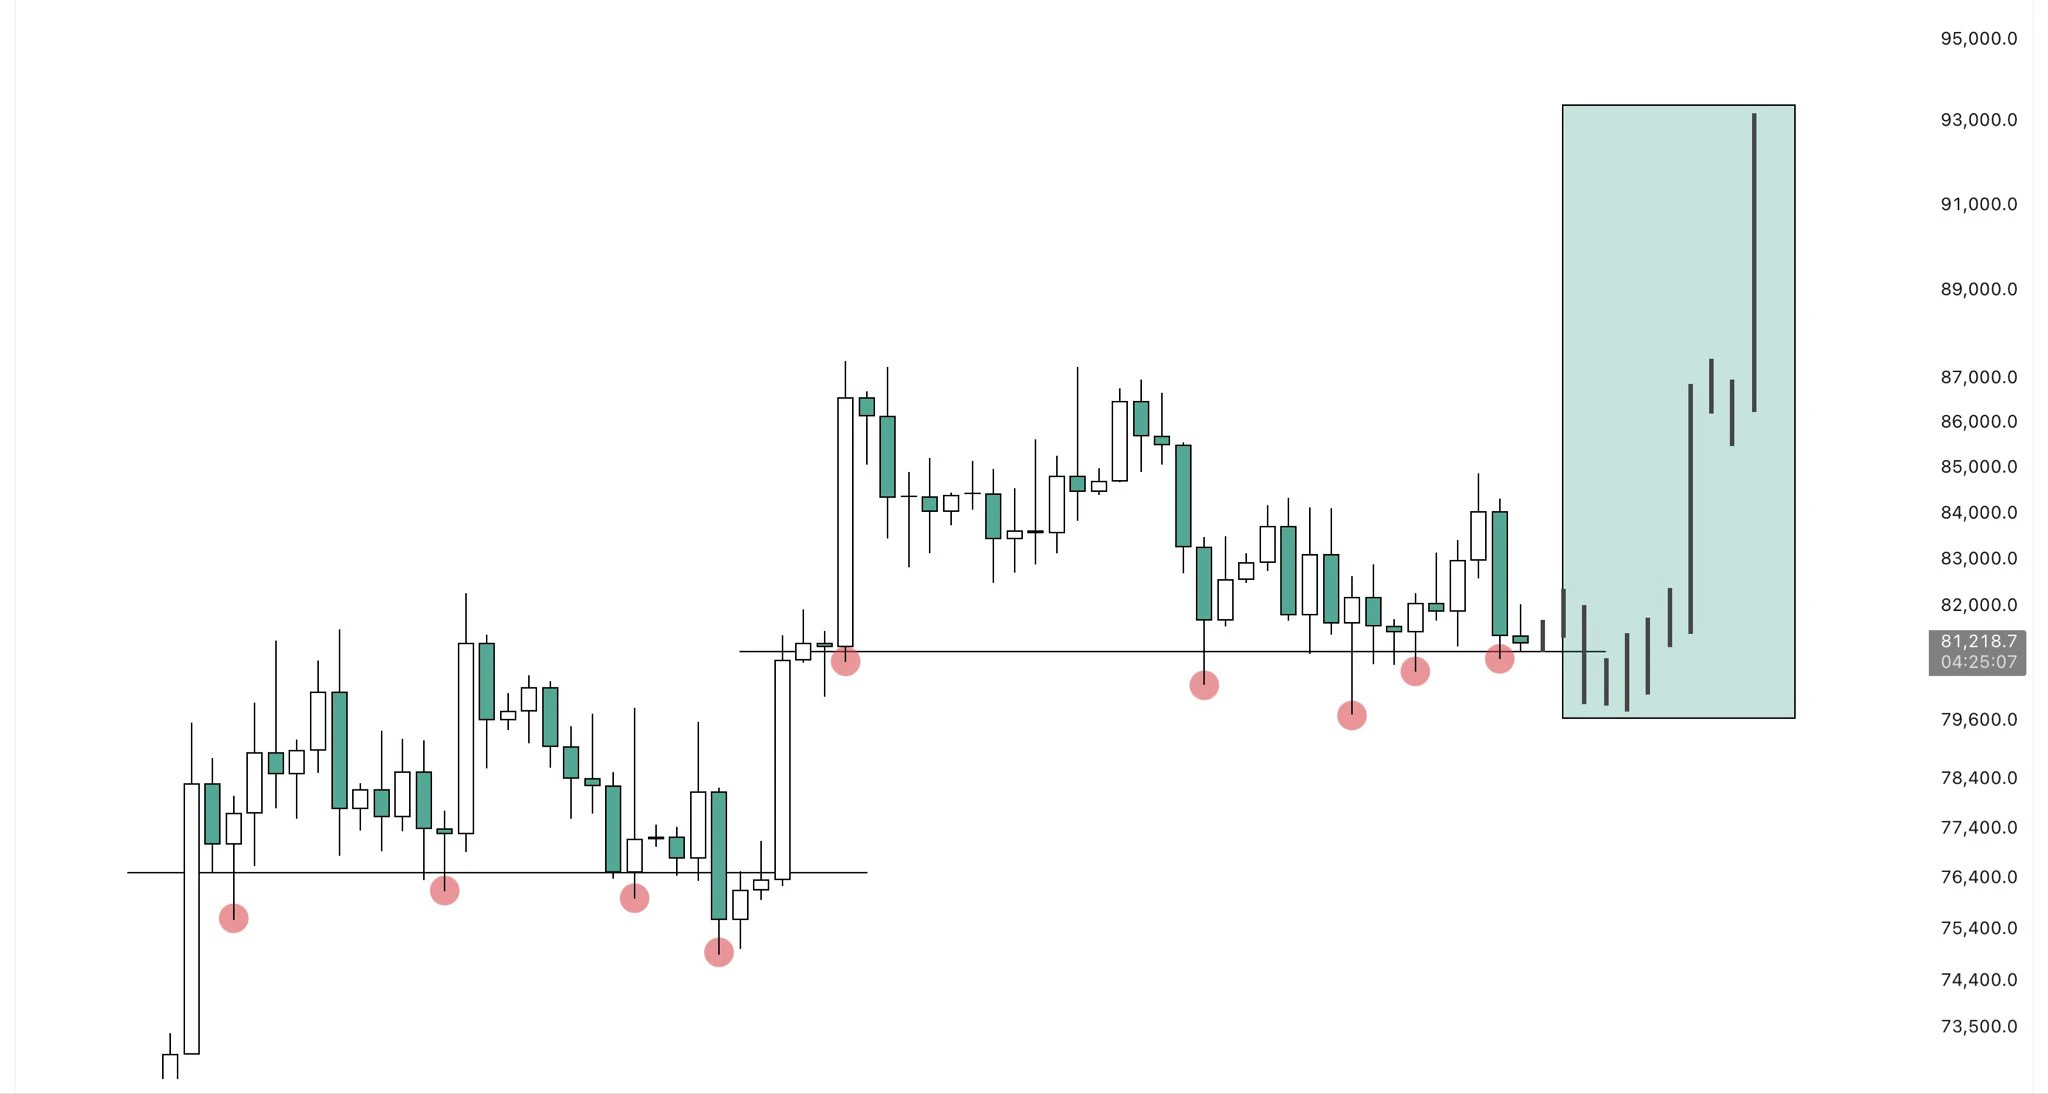
ETH on the weekly. Testing the zone that rejected it before
Sharp recovery into resistance after the sell-off. Same structure as a lot of these names — quiet base, then a push that catches people flat
Clear that box and the next move won’t feel gradual
$ETH
post-image
ETH+0.48%
#SimpleEarnUSDTLimitedTime11%APRWriting
#余币宝USDT享11%年化
Gate Idle Funds Treasure × Coin Treasure Phase 2: Put Your Idle USDT to Work With Annualized Returns of Up to 11%
In a market where cryptocurrency prices can change rapidly, successful fund management is about more than identifying the next trading opportunity. It is also about knowing how to manage the capital you are not currently using.
Many crypto investors keep USDT available to buy Bitcoin during market corrections, enter promising altcoin positions, or respond to sudden market movements. However, when those funds remain unused for a
post-image
BTC+0.79%
  • 2
BTC Support and Resistance Levels Every Trader Should Watch
Bitcoin’s price action can change quickly, making support and resistance essential tools for understanding potential market movements. These levels help traders identify areas where buying or selling pressure may increase and prepare for different market scenarios.
Join my Gate Live session today at 6:20 AM PKT as we explore Bitcoin’s technical structure, key price zones, breakout signals, and risk management strategies.
What We’ll Discuss
1. Understanding Bitcoin Support Levels
Support zones are areas where buying interest may emerge
post-image
BTC+0.79%
  • 3
“The whales aren’t philanthropists; they’re squeezing shorts so they can liquidate longs even more brutally.”
$MAGIC : The whales are getting ready to turn around and harvest everyone, guys.
Don’t get carried away by the chart. After MAGIC climbed to 0.142, it pulled back, with $2.48 million in short positions liquidated over 24 hours. But the whales have a weapon called the “funding rate,” which is still positive. The intention is obvious: liquidate shorts first, then longs. Spot net inflows are nearly 100%, indicating that someone deliberately pushed the price higher to force shorts out arou
MAGIC+108.48%
Holding a heavy position in $XPRT , even a little pump each day means making money.
XPRT+36.72%
Many people reflexively go long when they see a negative funding rate, believing that “shorts are paying, so longs have the advantage.” In extreme market conditions, this logic can instead become a trap—the negative funding rate often means shorts are crowded, and crowded directions are usually the best hunting grounds for liquidity snipers.
$KAIA surged 62.87% in 24 hours to a current price of 0.0614, yet the funding rate is -0.1435%, creating a highly conspicuous divergence. A price rise accompanied by deeply negative funding indicates that shorts are continuously adding positions to fight
post-image
KAIA+61.66%
BAT+32.34%
ZK+24.19%
#AIStocksFallALABDropsOver9%
The core focus of this report is the 9.21% drop in Astera Labs (NASDAQ: ALAB) on October 8, 2026 (closing at $347.05), and how it reflects broader shifts in the AI semiconductor market.
1. Key Triggers Behind the Sell-Off
OpenAI Revenue Uncertainty: A Financial Times report noted OpenAI's annualized revenue expectations dropped from $70 billion to ~$50 billion (partly due to cloud revenue accounting differences), raising concerns over AI ecosystem profitability.
Product Launch Overshadowed: Astera Labs announced its new Aries 7 PCIe 7 connectivity portfolio on
post-image
ALAB-1.40%
NVDA-0.52%
AMD-2.03%
AVGO+0.43%
MU-0.69%
  • 2
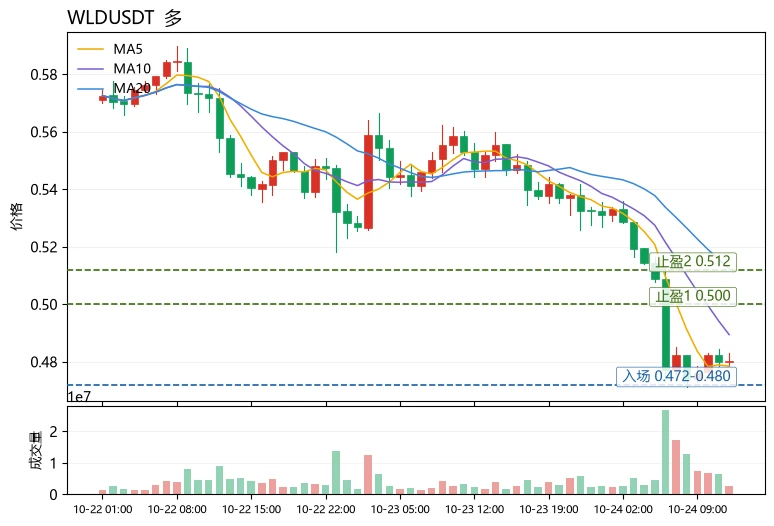
WLD down 8% to $0.49. Meanwhile: WLD just went live on Solana via Sunrise, Meteora added WLD pairs, SwissBorg listed it. Price dumps. Distribution expands. The market prices fear. Builders price the future. $WLD
#WLD #Worldcoin #Solana
post-image
WLD+7.57%
SOL+0.18%
MET-5.58%
$BTW DigiFinex announced that BTW will be delisted, requiring users to exchange their holdings for USDT themselves and providing a reference exchange rate of 1 BTW ≈ 1.49 USDT; this rate is below the current market price of $1.544, meaning holders exiting through this channel face a discount of approximately 3.5%. The delisting also means a contraction in BTW’s spot liquidity on some secondary markets, with pressure from forced selling and liquidity diversion consequently increasing; marginal changes on the supply side in the short term are worth tracking.
post-image
BTW+12.27%
$JCT This data looks a bit off.
The 24-hour trading volume is $111.7 million. I checked the circulating supply, and even at the current price, the fully circulating market cap would only be a little over $20 million. The turnover rate has gone straight above 40x. This isn't an ordinary pump; someone is betting their life on it. The low was 0.0021 and the high was 0.0029, with a 38% amplitude. It closed at 0.0027, up 27.75%—a typical high-volume short-squeeze structure.
This anomaly indicates at least three possibilities:
First, the main players are wash trading to create the illusion of liquid
#GateWCTCS9全球交易赛
🏆 Gate WCTC S9: The 6 Million USDT Trading Challenge Is Here! 🚀
💰 Millions in potential rewards, three major competition tracks, and opportunities for traders worldwide! Gate WCTC S9 brings together individual traders, competitive teams, and event contract participants in a campaign designed to test trading skills, strategy, and market knowledge.
But winning is not just about trading more. Understanding the rules, choosing the right competition, and managing risk are equally important. Let's explore what makes this competition worth watching! 👇
📅 1. Competition Schedule
post-image
BTC+0.87%
  • 4
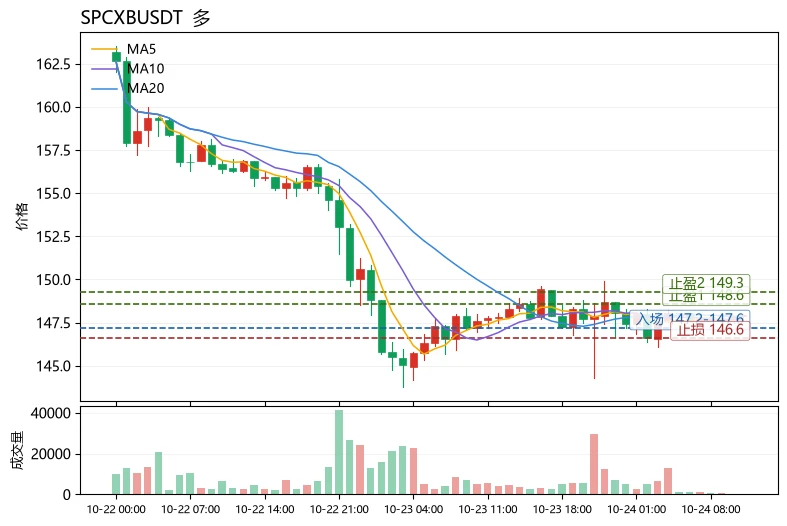
$STRK 's strength is undeniable, but treating overheating as safety often comes when sentiment is at its most expensive.
I am watching just one divergence: whether there is still buying support after breaking above 0.07716. The current price is 0.07478, with volume at 0.47x. The 1-hour and 4-hour trends are both strong, with RSI at 57 and 79, respectively.
If volume continues to expand after breaking above 0.07716, control will favor the bulls; if it falls below 0.06004 and fails to reclaim it, the short-term outlook is invalidated, and the next level to watch shifts to 0.04797.
Don't rush to
post-image
STRK+22.55%
Don’t rush to assign a direction to $ADA . The 1-hour and 4-hour charts are still at odds, and this is when it’s easiest to mistake a rebound for a reversal. I’d rather lay out the bearish case first.
The bears see risk after a break below 0.2319, while the bulls need to prove that buyers remain after a breakout above 0.2458. Current volume is 1.85x.
The current price is 0.2452, about 5.42% from the 1-hour support at 0.2319 and about 0.24% from the resistance at 0.2458. Position determines which side is more urgent; the next level to watch is 0.2238.
Waiting for the boundaries to provide the a
post-image
ADA+9.23%
October 10, 2026 (Saturday) BTC Futures Analysis Reference
BTC is currently trading roughly in the $82,500–$82,700 range (recent high around $83,500, low around $80,400–$81,600). Weekend liquidity is low, and after retreating from the early-October highs, the market has entered a period of range-bound consolidation.
Brief Market Background
• Rising to around $87,000 on October 2, BTC continued to retreat, breaking below $85,000 this week and currently oscillating in the $82,000–$83,500 range.
• Technically: Short-term weakness and consolidation; watch support defense and the impact of weeken
post-image
BTC+0.87%
In October, bitcoin:native ETFs have been experiencing sustained outflows:
In particular, $729 million flowed out over the past two full trading days,
Coupled with the 10-year U.S. Treasury yield at 5.24% and DXY above 102, this indicates that the external liquidity environment has not provided significant support for BTC.
Observation is the priority for now!
post-image
BTC+0.66%
Load More

Join 40 M users in our growing community

⚡️ Join 40 M users in the crypto craze discussion

💬 Engage with your favorite top creators

👍 See what interests you

Trending Topics

GateAtTOKEN2049

38.14k Views21.24k Discussing

Gate brought a series of major events to TOKEN2049 Singapore! From the official launch of Gate Money to the F1 Red Bull driver meet-and-greet and the Gate Gala, we witnessed a new chapter of "One Gate, Borderless Finance." Which moment from TOKEN2049 stood out most to you?

GateWCTCS9GlobalTradingCompetition

32.89k Views3.52k Discussing

BTC Pulls Back to 81000

26.59k Views36.01k Discussing

View More