Square
Following
Hot
News
Profile
Share your thoughts
placeholder
Article
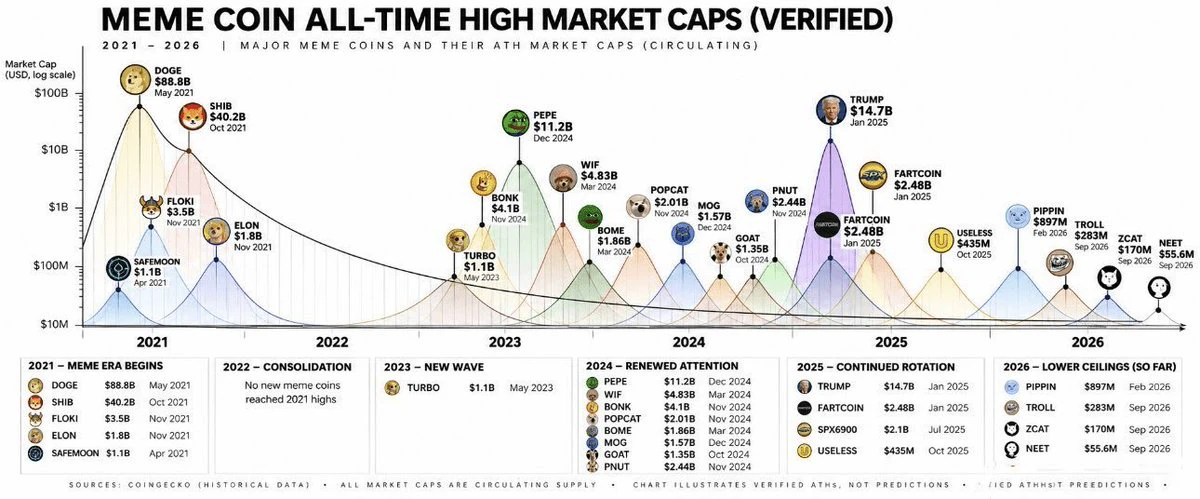
$DOGE About To Make Some Gains!?
Just locked into a long on $DOGE!
NFA, DYOR ⚠️
#Crypto #Trading #DOGE
post-image
DOGE-0.40%
Broke $5K in profits today! ✅️
Looking at a $500 prize! 🎊
Copy Trading Available Soon!
Come trade with me on AlphaX!
NFA, DYOR ⚠️
#Crypto #Trading #ETH #AlphaX
post-image
ETH+1.41%
Gm everyone ☀️
post-image
While XRP has seen significant developments on the institutional front, its price has followed a more cautious trend. Despite approximately $1.8 billion in net inflows into XRP exchange-traded products (ETPs) over the past 13 weeks, the token’s price currently sits at $1.39—a decline of over 8% in the last week alone. This divergence raises a fundamental question that is now at the forefront of investors' minds.
The developments on the institutional side are noteworthy. Evernode—a company holding 473 million XRP and $300 million in cash—has begun trading on the Nasdaq under the ticker symbol X
post-image
XRP+0.94%
  • 8
  • 1
Zero Hunters Crypto Lounge 🎯 | Historical Bangla Adda
live-cover
LIVE686
I make about $29k a month with options.
NO Day trading
NO Swing trading
NO Covered calls
NO Cash secured puts
NO BS
INSTEAD, I DO THIS:
Build base portfolio
Sell portfolio secured puts (not cash secured)
Buy LEAPS with the premium from sold puts
BUY shares with the premium from sold puts
Keep ratios in check
I can explain it to a 13 year old & I will likely outperform 95% of people that read this.
Simple wins.
post-image
$WULF had an intraday recovery of +20% which is pretty significant. It was down -65% from its high of $29 at some point today which still isn't as bad as the pullback in April 2025 where it saw -75% drawdown, but I'd say the sentiment in the space was just as bad
It almost seems irresponsible to show this chart. But it's currently forming a handle in this cup & handle pattern.
I don't make the fibs either, price currently found support around the 0.707 fib and if we get back above 0.786 and 0.887 fib then the upside targets could get wild. I don't see them happening anytime soon. For no I'd e
post-image
WULF+9.27%
I need a memecoin
Low market cap
Shill me tickers $________? 🔥🚀💸
#100x #1000x #memecoin #Gems
post-image
MEME+0.90%
GEMS+1.25%
  • 1
$XAU /GOLD, I am swing long here.
Price deviated below the March lows through the summer and reclaimed them. The October pullback is now retesting that level from above, with today's wick sweeping into it and closing back above.
It can take some time to play out but the structure is clean.
Targeting the March highs for the full setup. Invalidation is acceptance back below the level.
post-image
XAU+1.57%
first day calling on @Pumpfun
bullish tek!
post-image
With the same 1000U, some people are holding the bag at $WAL 0.0677, while others who bottom-fished at 0.0502 are already laughing. It is now 0.0512, down 15.7% in 24 hours, with a 565M trading volume—what does that indicate? Panic sellers are fleeing, but with selling this fierce, who is taking the other side?
Round one: the volume showdown. A 565M trading volume at this market-cap level means the turnover rate has been pushed to the limit. Rising volume during a decline either means the main players are unloading or that the market is shaking out and rotating holders. What is the difference
WAL-16.21%
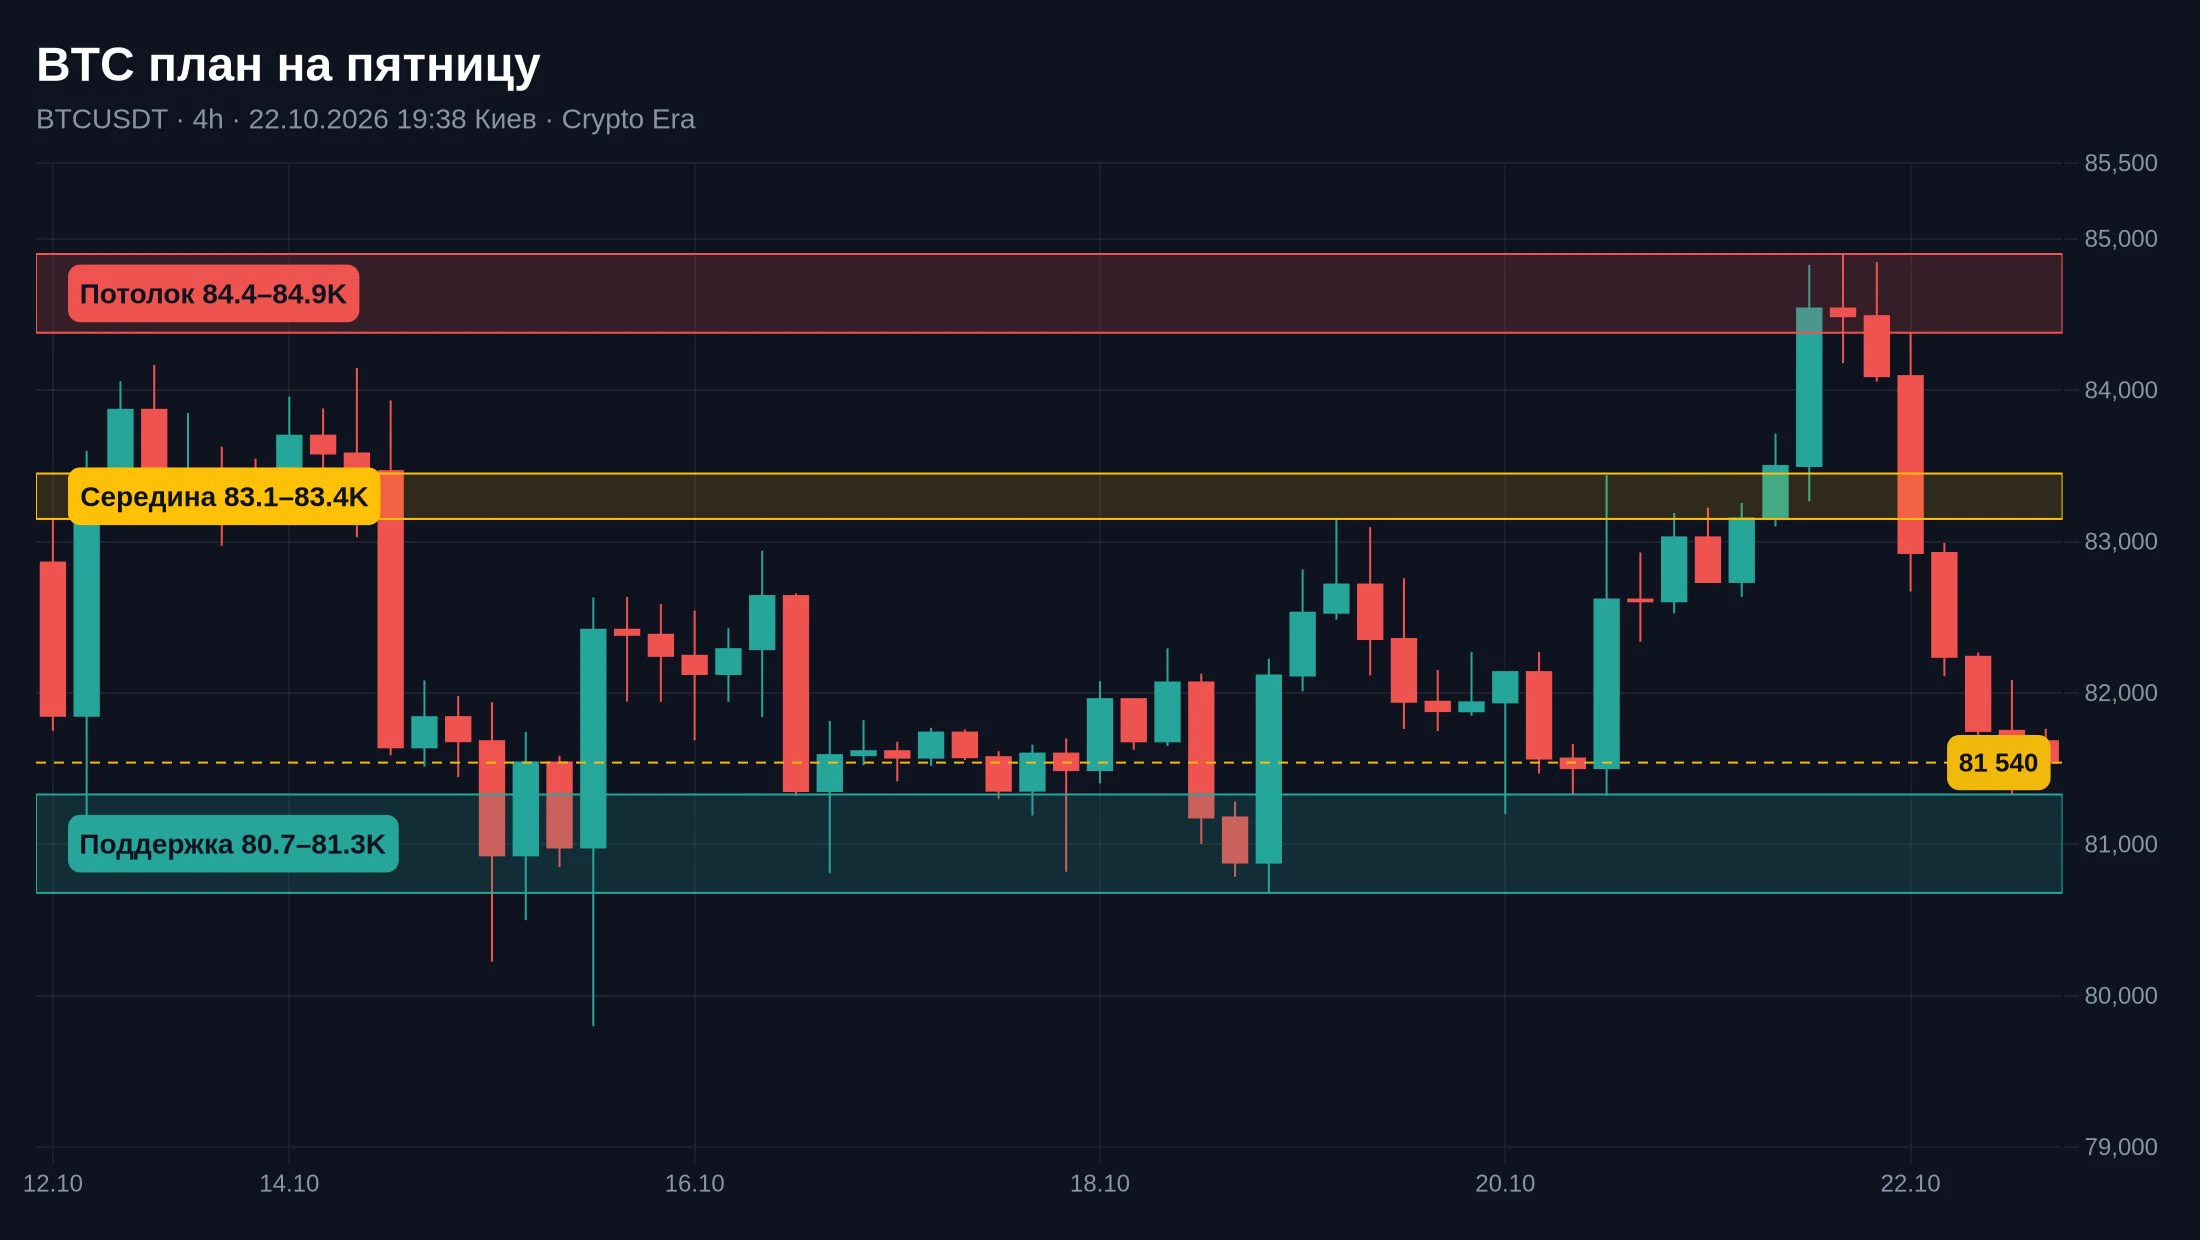
October 16 $BTC Strategy: Based on the current market, BTC's upward movement is being blocked by the 84200 resistance level. We continue to expect a pullback in the near term, but the decline has not been deep.
Do not rush to buy the dip. Open short positions in the 83500-84000 range, with a stop loss at 84500 (the starting point of the decline on October 7). If a solid bearish candle continues to break below 81800, keep the stop loss at breakeven.
Wait for a new low to appear. Reduce short positions in the 79200-78000 range and look for an opportunity to enter long positions.
post-image
BTC+0.35%
$SNDK
Key levels respected; bounced from the $1,279.29/share support zone
I will only pick this at $995.69/share, or I leave it
#NFA
SNDK-0.56%
ETH is currently around 2,450, maintaining an overall weak recovery. This rebound is merely a technical bounce after the decline, not a reversal, and the bearish structure remains intact.

On the 4-hour chart, the price is pressured by the moving averages, rebound volume is insufficient, the Bollinger Bands remain in a downward trend, and overhead resistance is dense. This rise is merely a corrective move within the downtrend, with limited upside and relatively high pullback risk.

On the 1-hour chart, short-term fluctuations are showing a mild recovery, but bullish momentum is lacking. This
post-image
ETH+1.52%
are cats gonna end up trading better than pigs?
post-image
I’m checking out every decent shill today.
Shill me some good #tickers 👀
post-image
1016 $DOGE Recent entry position for DOGE—just look at the daily chart. Every time the broader market makes any move, DOGE starts falling in advance.
I've bought at 0.06888 many times before and played the August range quite a bit. The last time, I held DOGE until it started moving at 0.083 and then exited. I haven't really watched DOGE since, because I think DOGE can sometimes be difficult to trade short-term.
We'll continue placing long orders around 0.06888 and 0.07, with a stop loss at the bear-market low of 0.067. Keep the stop-loss range slightly wider. Leave this long-term lottery orde
post-image
DOGE-0.33%
SOL oscillated downward from the earlier high of 124.99, with the intraday low dipping to 100.51 before a slight rebound, reaching a high of 106.49. This rebound is merely a minor corrective bounce during the decline; the overall broader downtrend channel remains intact, and a rebound to resistance presents an opportunity to enter short.

From the chart, the daily highs have been gradually moving lower, and the bearish trend structure remains intact. This rebound is only a brief pause amid the decline. MACD remains weak and trending downward, while heavy pressure from previously trapped posit
post-image
SOL+1.48%
CPI Comes in Hotter Than Expected
live-cover
LIVE27
10.16 $BNB Strategy chart 1 is the BNB 4-hour candlestick chart, and chart 2 is the BNB hourly candlestick chart.
From the larger timeframe in chart 1, we can see that BNB has touched the lower major ascending trendline today, namely the positions at 10 a.m. and 10 p.m. on October 15, corresponding to 708 and 712, respectively. Given the very obvious signs of price control in BNB recently, when BTC falls and ETH falls, BNB can always recover its price after falling.
If the broader market continues to make new lows in the near term, BNB is very likely to break below this 4-hour ascending trend
BNB+0.32%
Load More

Join 40 M users in our growing community

⚡️ Join 40 M users in the crypto craze discussion

💬 Engage with your favorite top creators

👍 See what interests you

Trending Topics

USSeptemberPPIBeatsExpectations

91.35k Views1.88k Discussing

US September PPI came in at 6.3% YoY, well above the 5.3% market expectation, pointing to renewed producer-side inflation pressure. Weekly jobless claims were 199K, broadly in line with forecasts. Could hotter inflation further reduce room for rate cuts, and what does it mean for $BTC, US stocks, and gold?

DrLinHanSpeaksAtOxfordUnion

135.63k Views1.86k Discussing

JapanAndKoreaStocksPlunge

47.27k Views1.76k Discussing

View More