Square
Following
Hot
News
Profile
Share your thoughts
placeholder
Article
I just opened a quick short trade on $JCT
. The risk is extremely high. Entry now: sell at 0.002650 or 0.002800. First target: 0.002500. Second target: 0.002400. Third target: 0.002300. Final target: 0.002200++. Stop loss above 0.002950.
post-image
JCT+60.18%
$SKL Current price: 0.00533. The first resistance above is the Bollinger upper band at 0.00547, while the first support below is MA5 at 0.00512; if that level is lost, watch MA20 at 0.00473.
The bias is bullish, but this is a trend-following trade in a high-volatility environment, not a bottom-fishing trade. Reasons: MA5>MA20 shows a bullish alignment, the MACD histogram is positive, RSI at 62.8 has not yet entered the overbought zone, and the trend structure remains intact; however, the amplitude over 30 candles is close to 29.6%, volatility is extremely high, and the Fear and Greed Index at
post-image
SKL+14.29%
ZEC-10.71%
ADA-7.33%
I didn’t do anything—just went to the restroom, and when I came back, that upper wick had already done the work for me. I opened the chart in the morning, and $SOL surged toward the previous high. Every push upward fell just short, with sell orders pressing it down hard, so I laid out my short plan around 120.80. At the time, I said just one thing: under pressure at the highs, volume hasn’t followed—don’t rush to catch a falling knife.

The result: from 120.80 to 109.61, this short trade delivered +860.32%. Those who were on board should have woken up laughing.

I’d rather miss a limit-up m
post-image
SOL-4.75%
ETH-3.69%
XRP-2.64%
$AAOI
is holding around the 105 support level, while open interest has dropped 10 points🤯. Fewer people, but the price hasn’t collapsed—that’s called a shakeout, not a trend reversal. 66% of longs still dare to stay, and the positive funding rate is scorching hot. The fact that it can’t be pushed down means strength; this move is giving longs a chance to get on board.😏
post-image
AAOI-10.50%
$RLC is moving, but trading volume has yet to confirm it, which is more worth watching than the 24-hour gain of +28.83%.
I’m watching just one divergence: whether there will still be support after a breakout above 1.0845. The current price is 0.8619, with volume at 0.11x. The 1-hour and 4-hour trends are both strong, with RSI readings of 59 and 53, respectively.
If volume continues to expand after breaking above 1.0845, control will favor the bulls; if it falls below 0.6515 and fails to reclaim it, the short-term view is invalidated, and the next level to watch shifts to 0.3637.
Don’t rush to
post-image
RLC+27.50%
ripple:native
Will be interested in longs at bottom range.
Bounce here to take out late shorts, then steady decline to bottom range before bounce there.
post-image
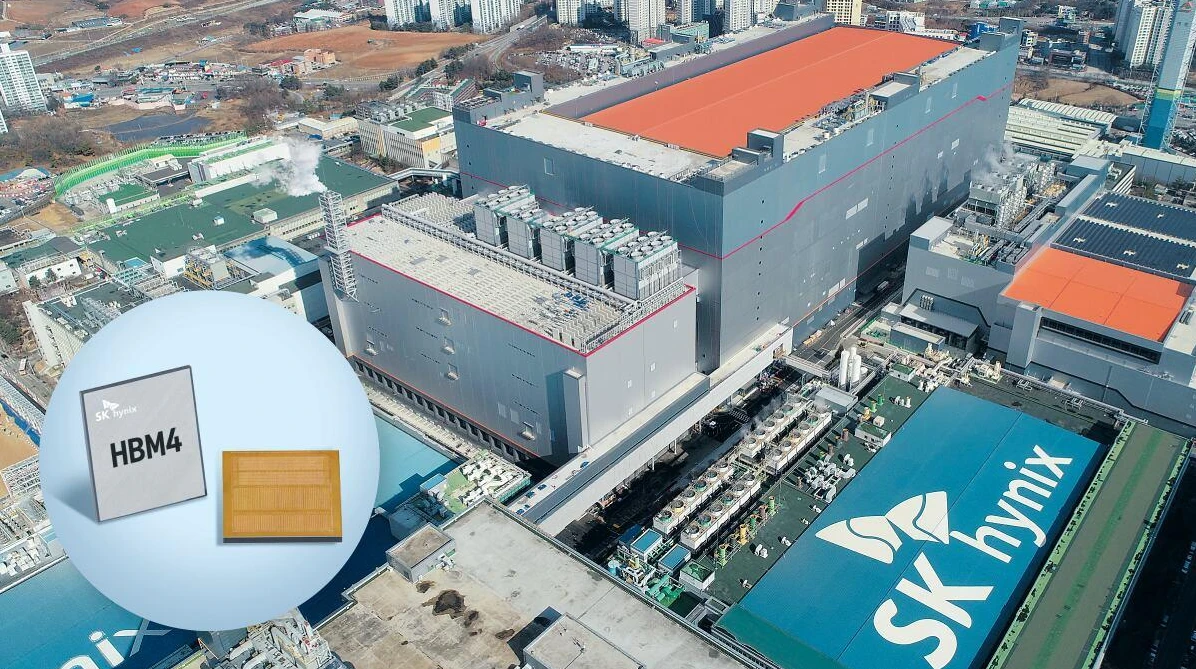
🔥Explosive earnings, yet hammered overnight: Samsung’s guidance sent chip stocks crashing, while money quietly flowed into two places
The most surreal scene last night: Samsung previewed a surge in operating profit, but because it was “just a little lower” than the market expected, its stock plunged on the spot—SK Hynix -5.6%, Samsung -4.8%, SanDisk -4.7%, Micron -4.6%, a 3x chip ETF -10% overnight, and Korean leveraged products -12%.
Absurd? The shortage is real: DRAM is sold through 2027, and memory sticks have more than tripled in price in a year. But stock prices peaked back in June—Samsu
post-image
SK Hynix-2.43%
SNDK-4.91%
DRAM-5.07%
GLDX+0.67%
PAXG+0.65%
Bullish Cross for the TOTAL #Crypto cap!
post-image
No complaints about this $AIOT trade.
Take it while the money is still there. Close here. ROI: 358% Funds: 2290 USDT Market watch: $BT : Current price 81,773.4 - 24-hour change: -1.73%
$Q : Current price 0.026155 - 24-hour change: +21.99%.
post-image
AIOT-14.75%
PUMP hit by reverse-engineering access revocation -7.9%, rebounds +2.41%; I’m bullish
$PUMP Access was revoked through reverse engineering last night; current price 0.00568, 24h -7.9%, yet the chart didn’t collapse: after the incident, it moved from 0.005557 to 0.005691, rebounding +2.41%. I’m directly bullish at this level.

The daily structure remains intact—RSI 65.2 is strong, MACD has remained above the zero line for 11 days since the bullish crossover, MA7 has stayed above MA30 for 14 days, and the short-term moving averages remain in a bullish alignment.

Funds haven’t fled either—OI v
post-image
PUMP-8.28%
$UNI 's low is beginning to attract attention, but the sense of cheapness can never replace evidence of a bottom forming.
This time, let's ignore the gainers and losers ranking and focus only on the levels. The current price is 7.362, about 4.92% above the 1-hour support at 7 and about 9.06% below the resistance at 8.029.
My criteria are simple: only a breakout above 8.029 followed by continuation would count as follow-through higher; a break below 7 invalidates the original assessment. The 1-hour and 4-hour trends are both weak, with RSI at 34 and 15, respectively.
The issue now is not a slog
post-image
UNI-6.00%
This isn't a rebound—it's CPR for my short-position account, isn't it? While everyone else was running, $ZEC pulled up once and then weakened, volume failed to follow, and the bull-trap flavor was strong. I shared the short thesis around 1441.41. Pressure at highs is still pressure at highs; every surge falls just short. If you don't short this structure, what are you waiting for?

The market slid from 1441.41 to 1183.89, putting +1268.91% straight in my pocket. Nailed it.

The market exists to cure all kinds of defiance, especially in those who think they're the smartest.

Close 80% first
post-image
ZEC-10.74%
DOGE-4.86%
BNB-4.47%
market overview
live-cover
LIVE562
$JCT Quickly, quickly, open a short! This is a selling opportunity from the top,
I’ve already entered a short with 1 thousand—come on, let’s make profits!Target: 0.0020
post-image
JCT+60.18%
Many people reflexively buy the dip when RSI falls near 30, while ignoring the bearish alignment of the moving averages—this is a typical mistake of “isolating indicators.” Currently, $BNB is priced at 734.87, with MA5=729.892 still below MA20=752.96, the MACD histogram at -2.259 maintaining a bearish signal, and RSI=31.5 approaching oversold territory but showing no divergence. More importantly, the amplitude over 30 candlesticks is as high as 8.05%, indicating heightened volatility. Heavily buying the dip at this point is equivalent to using a fixed stop-loss to fight random noise.
My view
AVAX-8.28%
Hope you all managed to pick up some of your favourite tokens at a discount today. I know we did 🤝
Taking the rest of the night off, but I’ll be updating the major charts and key levels in the subscribers’ section tomorrow 🤟
post-image
👑🔥 The next meme-coin king is coming…
Who do you think will #1000× next? 🚀💰
post-image
MEME-4.46%
Took a small loss in the choppy market, but this one-way move brought us all the way back. Caught the rebound too. Take it slow and keep it up.
post-image
crypto market update
live-cover
LIVE24
$BTC | 50 weekly EMA
post-image
BTC-1.67%
Load More

Join 40 M users in our growing community

⚡️ Join 40 M users in the crypto craze discussion

💬 Engage with your favorite top creators

👍 See what interests you

Trending Topics

Gate Money Officially Launches

3.45k Views12.86k Discussing

Gate officially launches Gate Money, a global integrated financial services app that brings digital assets, fiat, stocks, ETFs, gold, bank accounts, and payments into one Gate App. Users can manage assets, invest, send and receive funds, convert currencies, and make payments — all from a single account. Which use case are you most excited about? [👉 Learn more](https://www.gate.com/announcements/article/102094)

Fed September Minutes Lean Hawkish

64.14k Views2.72k Discussing

Samsung Q3 Operating Profit Surges 782.5%

36.88k Views1.93k Discussing

View More