Square
Following
Hot
News
Notifications
Profile
Share your thoughts
placeholder
Article
$AIN At this point, the people I’ve let down the most are my family
AIN+3.85%
  • 3
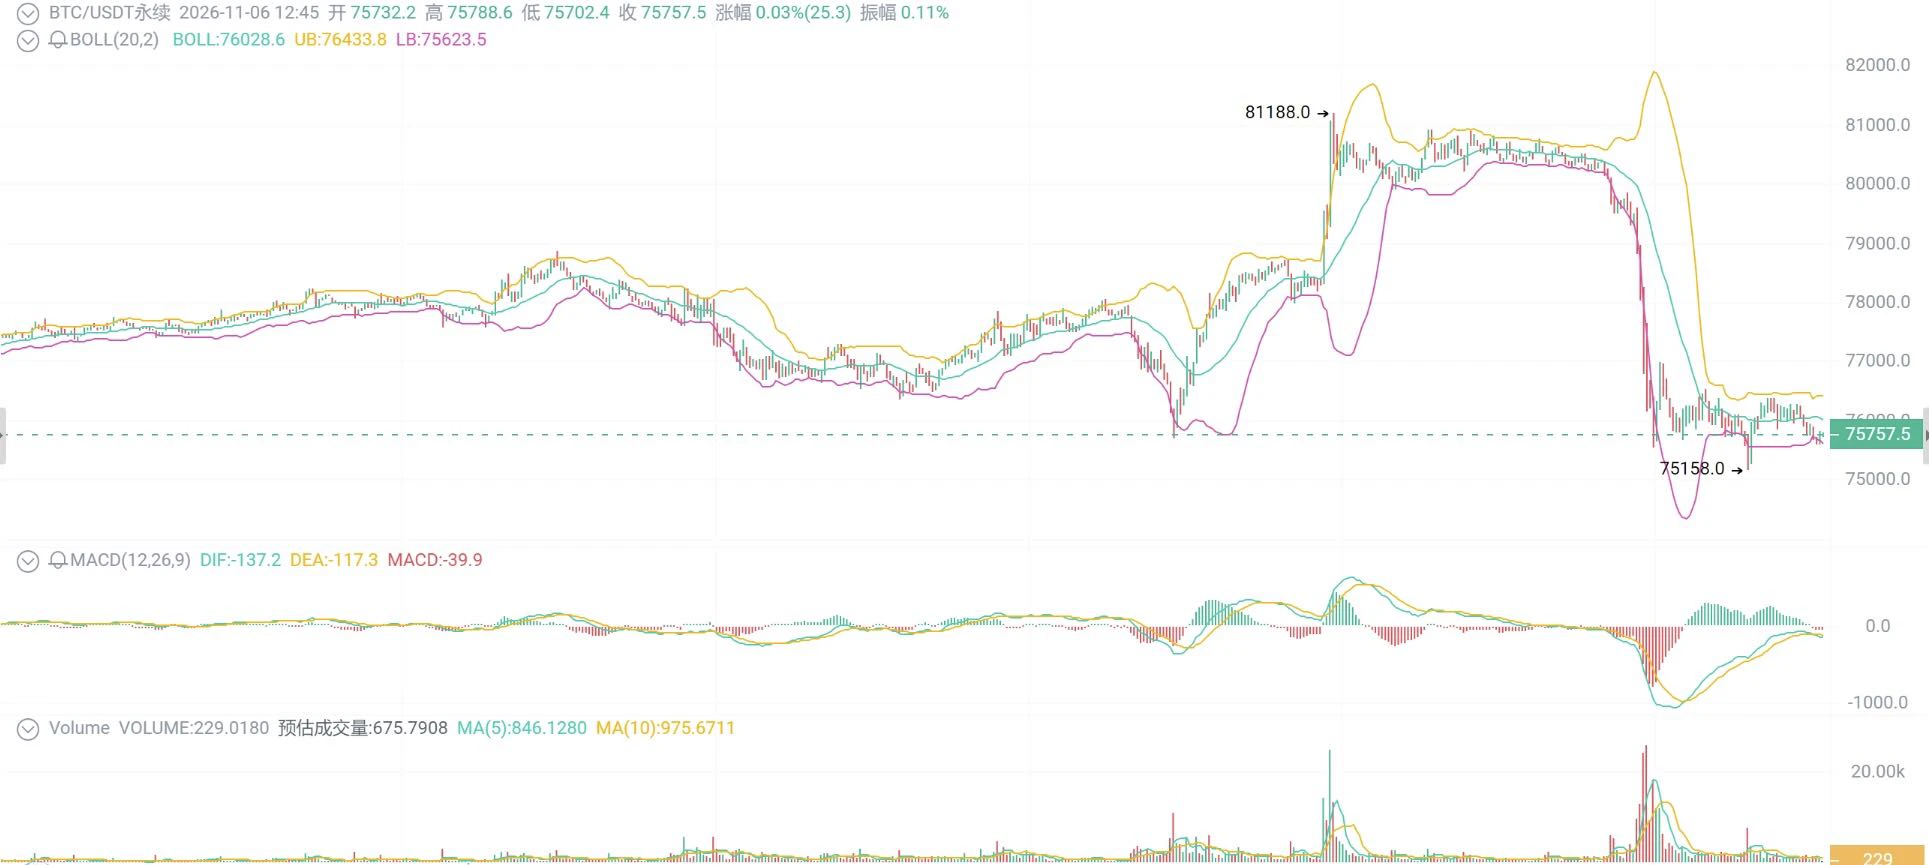
Bitcoin outlook: At this stage, we are bullish and looking for suitable opportunities to go long at lower levels. This pullback is more of a deep shakeout during the uptrend and has not directly damaged the broader bullish structure. After repeated tests of key support below, buying interest has continued to come in.

Although the short-term market may remain choppy, downside momentum is weakening, and conditions for a bullish counterattack are gradually maturing. A reminder to everyone: being bullish does not mean entering blindly. Entry levels are crucial. Chasing highs carries very high ris
post-image
BTC-0.65%
ETH-1.23%
SOL-0.74%
Trenches
ZIG
Z
bade
b
ZIG
0x8c...1145
Market Cap
$.
Change
.
24h Vol
$.
Holders
.
BTC
B
bade
b
BTC
C5xp...pump
Market Cap
$.
Change
.
24h Vol
$.
Holders
.
STONK
S
bade
b
STONK
6GmA...UNgx
Market Cap
$.
Change
.
24h Vol
$.
Holders
.
DESSA
D
bade
b
DESSA
npz2...pump
Market Cap
$.
Change
.
24h Vol
$.
Holders
Diamond
D
bade
b
Diamond
5VCE...pump
Market Cap
$.
Change
.
24h Vol
$.
Holders
.
🤖 AI Stocks Sell Off — Could AI Applications Lead the Next Rally?

AI chip, server, and data center stocks are under pressure as investors question massive AI spending and stretched valuations.

But the AI story is far from over.

The focus is shifting from AI infrastructure spending to real revenue and profits.

🔍 Google: AI Search & advertising revenue

☁️ Microsoft & Amazon: Cloud and AI monetization

🚀 Meta, Palantir & Oracle: Enterprise AI growth

If capital rotates from AI infrastructure to applications, which company could lead the rebound?

Share your stock picks, market outlook, or
post-image
Gate_Square
🤖 AI Stocks Sell Off — Could AI Applications Lead the Next Rally?

AI chip, server, and data center stocks are under pressure as investors question massive AI spending and stretched valuations.

But the AI story is far from over.

The focus is shifting from AI infrastructure spending to real revenue and profits.

🔍 Google: AI Search & advertising revenue

☁️ Microsoft & Amazon: Cloud and AI monetization

🚀 Meta, Palantir & Oracle: Enterprise AI growth

If capital rotates from AI infrastructure to applications, which company could lead the rebound?

Share your stock picks, market outlook, or trading strategy on Gate Square with #USTechSelloff.

🎁 Gate's AI Applications Trading Event is live. Trade eligible AI and cloud stocks for chances to win rewards, including up to 1,888 USDT in Google stock trial funds.

👉 Event link: https://www.gate.com/campaigns/6916
repost-content-media
GOOGL-2.22%
MSFT-3.65%
AMZN-2.11%
PLTR-9.79%
ORCL-7.02%
  • 3
This level once again tested the previous low from the early-morning drop without breaking it. Accumulation at the bottom continues, though there is still some pressure. Go long at the current price—bulls, charge with me!#美股史诗级抛售 #Gate首创资金安全证明
The AI Stock Crash Brings Back Memories of
live-cover
LIVE1,895
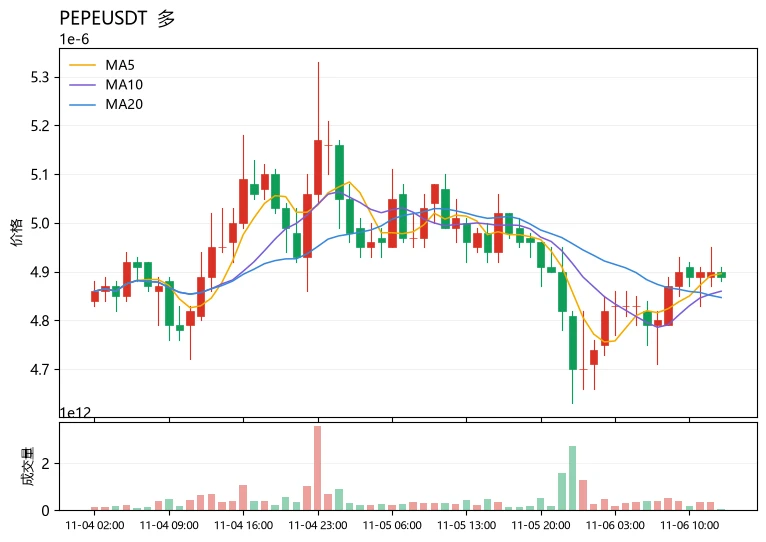
Amid fear, which way is capital leaning? The answer is bullish—$PEPE 's contract structure is quietly shifting.
At around the current price of 4.89e-06, MA5 (4.896e-06) has crossed above MA20 (4.847e-06). The short-term moving average turning upward is the first sign of capital returning; the MACD histogram at +1.433e-08 remains bullish, while RSI at 51 is neutral-to-warm, indicating that bulls are not overheated and still have room to add positions. The Fear & Greed Index at 28 is in the fear zone, with retail sentiment bearish, yet the price has not broken down. This divergence of “cold sent
post-image
MSTRB
MSTRBMSTRB
Four.meme
MC:$3.29KHolders:4
0.07%
PEPE+0.97%
#StockTalkSeason
#StockTalkSeason

The global stock market is entering another interesting period, and StockTalkSeason is bringing more attention to important market trends, investment opportunities, and financial developments. Stocks have become a major topic among investors because market movements can create both opportunities and challenges.

The stock market is not only about buying and selling shares. It is also about understanding businesses, studying company performance, following economic news, and making decisions based on proper research. Every price movement tells a story about ma
  • 3
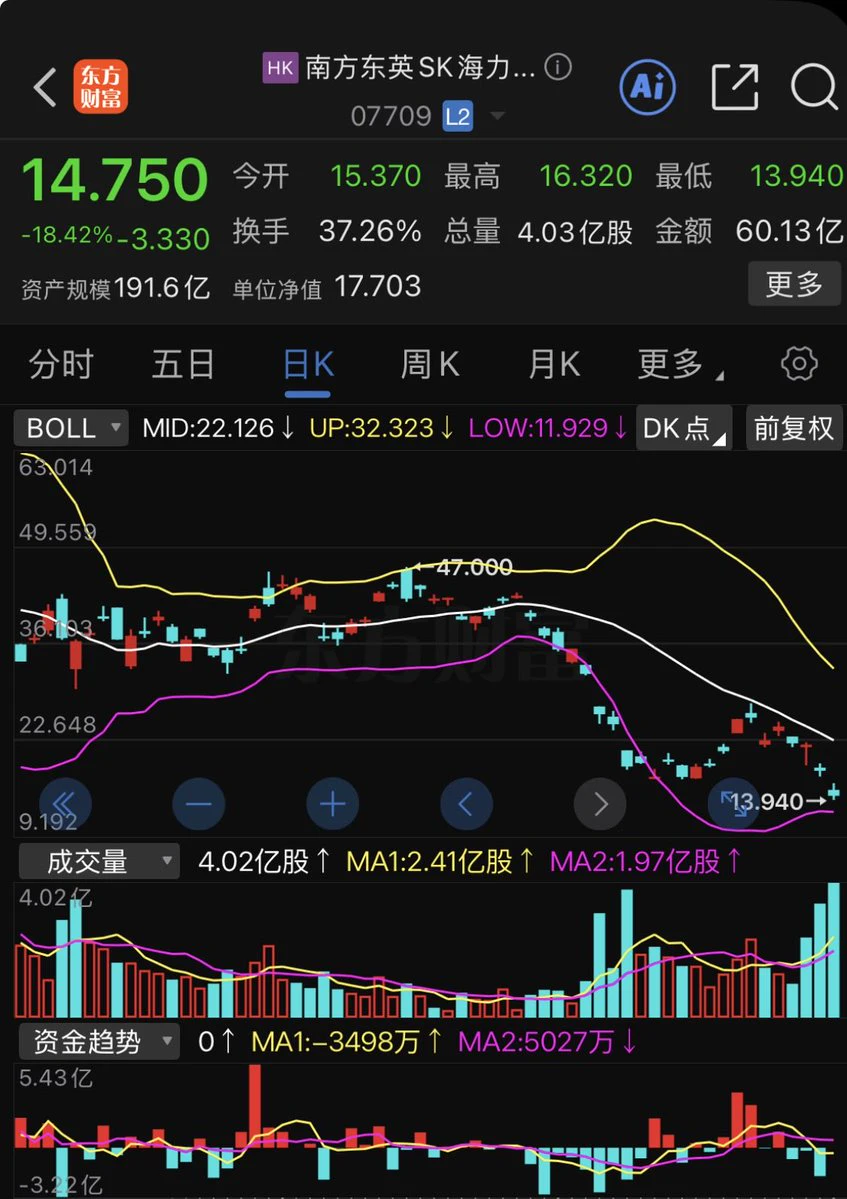
For most of those years, I was a firmly bullish Builder, so I think the best strategy is to be there when prices fall
Look for opportunities amid panic, stay greedy
Just as I'm looking at a 2x leveraged long on Hynix right now, I think the turning point for memory stocks also depends on tonight's data: the U.S. October unemployment rate and nonfarm payrolls will be released tonight at 21:30 (UTC+8).
The U.S. October unemployment rate is expected to be 4.2%, and seasonally adjusted nonfarm payrolls for October are expected to rise by 65k.
post-image
ETH is currently showing a multi-timeframe confluence of pressure and a downward structure:
On the daily timeframe, the previous rebound structure has come to an end, with price retreating under pressure and closing with a large bearish candle, breaking below the short-term support platform. Bullish rebound momentum has faded, and the trend has shifted into a corrective phase;
On the 4-hour timeframe, candlesticks have repeatedly broken down, the Bollinger Bands are opening downward, bearish momentum is being released in force, and the market's center of gravity continues to move lower, with f
ETH-1.26%
#AsiaPacificStocksPlunge 🔬

Is the sea of red in Asia merely profit-taking?

Those fixated on the massive red percentages flashing across their screens during the historic collapse of Asian markets are missing the true paradox: the very companies that ignited the artificial intelligence revolution are now buckling under the political uncertainty of the future they themselves created.

The wave of selling triggered in global markets following the U.S. midterm elections has swept across the Pacific, striking the heart of Asia’s technology sector with the force of a bombshell. In South Korea, th
post-image
User_any
Don’t let the numbers mislead you; those figures don’t point to a market collapse, but rather to an entirely different structural mechanism.

The real story lies within a historic wave of selling—triggered in the artificial intelligence and semiconductor sectors following the U.S. midterm elections—that rippled across the Pacific all the way to Seoul. What unfolded on Thursday, November 5, 2026, was more than just a correction; it was a watershed moment—a stress test for the AI trade, challenging both its valuations and the underlying policy landscape.

Just how severe was the sell-off on Wall Street?

The wave of selling that hit U.S. markets on Thursday marked the sharpest decline in recent years. The Nasdaq tumbled 5.52% to 24,315 points, falling 11.9% from its early-October peak and officially entering correction territory. The S&P 500 dropped 4.36%, while the Dow Jones slid 3.44%, shedding 1,833 points.

The devastation was most acute in the semiconductor sector. The semiconductor index plummeted 12.25% in a single day—its worst performance since March 2020. The stocks on your screen tell the story: Nvidia fell 9.33%, AMD 17.64%, Micron 17.23%, and SanDisk 22.24%, with various Asian ADRs also posting losses exceeding 10%. In total, approximately $2 trillion in market capitalization evaporated in just one day.

What was the hidden cause behind the sell-off?

There isn’t a single reason, but the midterm elections served as the primary catalyst. The Democrats gaining the upper hand in Congress has raised questions among investors as to whether regulations concerning the construction of data centers might become more stringent.

The market has begun to price in the possibility that the development of data centers—the backbone of the artificial intelligence revolution—could slow down due to new energy and environmental regulations. Signals from newly elected officials in states like Texas, Georgia, and Ohio, suggesting potential restrictions on data centers, have further fueled these concerns. According to one analysis, approximately 30% of the projected data center capacity in the United States through 2028 is now at risk due to potential construction delays.

Compounding this, a chip manufacturer’s announcement of a 26% decline in sales for its mobile phone chips has led the market to wonder: is spending on artificial intelligence beginning to cool off?

How did the shockwave from across the Pacific hit Seoul?

The turmoil on Wall Street spread to South Korea the moment its markets opened. The KOSPI index plummeted by more than 8%, falling below the 5,000-point mark and triggering a circuit breaker just three minutes into the trading session.

Korean corporate giants were at the heart of this collapse: SK Hynix shares fell by as much as 11.71% to 1,116,000 won—a sharp reversal, considering the company had reported record-breaking quarterly sales just a week earlier. Samsung Electronics shares dropped 9.98% to 181,400 won. A similar trend emerged in Japan, where Tokyo Electron, SoftBank, and Advantest saw their values decline by 2.58%, 8.59%, and 5.07%, respectively. Because the stock markets in South Korea and Japan are heavily weighted toward the semiconductor sector, they tend to amplify any technology-related shock originating in the United States. What is the secret behind the "-38" figures on the screen?

The extreme figures—such as -38.65% and +38.64%—seen in the leveraged products in the image do not represent a market collapse; rather, they are the result of reverse splits and the structural nature of leveraged ETFs.

For a product designed to deliver triple the daily performance of an index, a 12% decline in the semiconductor index would mathematically result in a drop of approximately 36%. The 38% decline shown on the screen also reflects a price adjustment following a reverse split. Conversely, a product designed to move inversely to the index (betting on a decline) will rise as the index falls. However, because such funds tend to lose value consistently over the long term, they frequently undergo reverse splits. The +38% increase seen on the screen is actually a byproduct of the consolidation process intended to offset the fund's historical loss in value.

In short, these figures are "structural noise" inherent to the nature of leveraged ETFs; they do not reflect the actual performance of the underlying stocks.

Is this a buying opportunity or a new regime?

The market is currently caught between two opposing scenarios. On one side are those who argue that this is merely a temporary correction—a liquidation of overheated positions in the artificial intelligence sector. On the other side are those who believe that AI valuations remain detached from reality and that this is, therefore, not a buying opportunity.

One thing is certain: the market is no longer driven by the same narrative. The triad of valuation, policy, and liquidity is being recalibrated. It would not be surprising to see further macro shocks of this nature until regulations regarding data centers in the United States are clarified. What you should monitor is the distinction between technical price adjustments in leveraged products and the primary market trend; the extent to which the declines in Seoul and Tokyo are driven by regulatory uncertainty in the United States; and whether semiconductor companies—despite these policy-related headwinds—are managing to maintain their order backlogs.

This content is for informational purposes only and does not constitute investment advice.

$MU $AMD $SNDK $TSLA $INTC
#USStocksFaceHistoricSelloff
#GateSquareTradingChallenge #Gate股票畅聊季 #GateStockTalkSeason #ShareWeekly
repost-content-media
HK50+0.27%
JPN225+0.49%
NAS100+1.34%
US30-0.41%
  • 19
  • 1
Why are AI stocks AND Bitcoin crashing?
$2.5 TRILLION wiped from stocks. Nasdaq down 5.5%. Bitcoin below $76K. Wall Street is panicking over Democrats' plans to restrict AI data centers.
But here's the twist, guys.
Trump still has veto power, the proposed restrictions aren't law, and Bitcoin is getting dragged down with tech.
Now Democrats are preparing another fight over crypto regulation. Markets are pricing in a political nightmare. But how much of it can actually happen?
New video coming later today
post-image
BTC-0.67%
NDAQ-2.63%
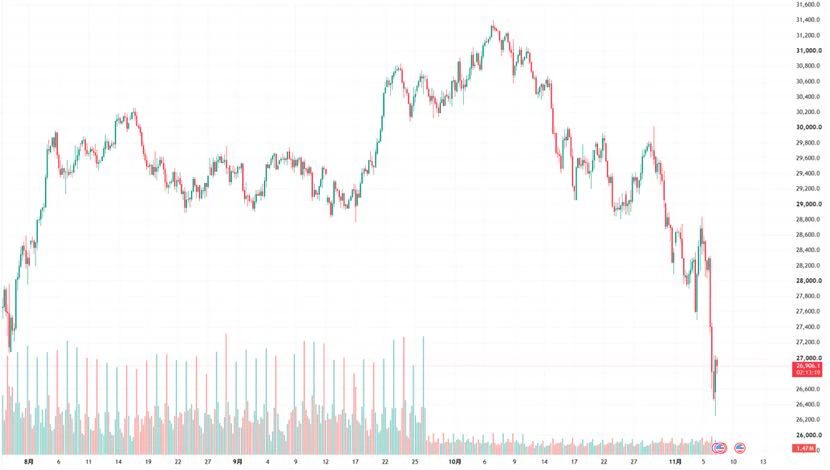
Last night’s Nasdaq 100 was genuinely a little scary😥

$QQQ It plunged 6.36% in a single day, closing near 26,630 and marking an exceptionally rare one-day drop not seen since 1992

What’s even more noteworthy is that the biggest losses came from the AI supply chain that had previously supported the US stock market’s rise. The Philadelphia Semiconductor Index even fell more than 12%

After the Democrats won the midterm elections, the market began to worry that data center construction would face more regulatory restrictions. Combined with ongoing questions about the returns on AI investments,
post-image
QQQ+0.01%
  • 7
  • 2
In a smart contract audit report, what information is more important than “passed an audit”?

In the Web3 world, we often see projects promote that their smart contracts have passed security audits.

But if you actually open an audit report, you’ll find an easily overlooked fact:

“Passed an audit” is not a permanent security guarantee, nor does it mean the contract is risk-free.

The real value of an audit report lies not in its final conclusion, but in what it actually examined, what it found, and what the project did afterward.

Ordinary users don’t need to understand every line of Solidity
post-image
#GateLaunchesPoSECProofOfSecurity #USStocksFaceHistoricSelloff

The US stock market is facing a historic selloff, creating uncertainty and concern among investors. Major stocks are under pressure, and market volatility is becoming an important topic for traders around the world.

A major market selloff can happen when investors become worried about economic conditions, company earnings, interest rates, or future market growth. When confidence becomes weak, many investors choose to reduce their positions, which can increase selling pressure across the market.

This situation reminds us that fin
  • 2
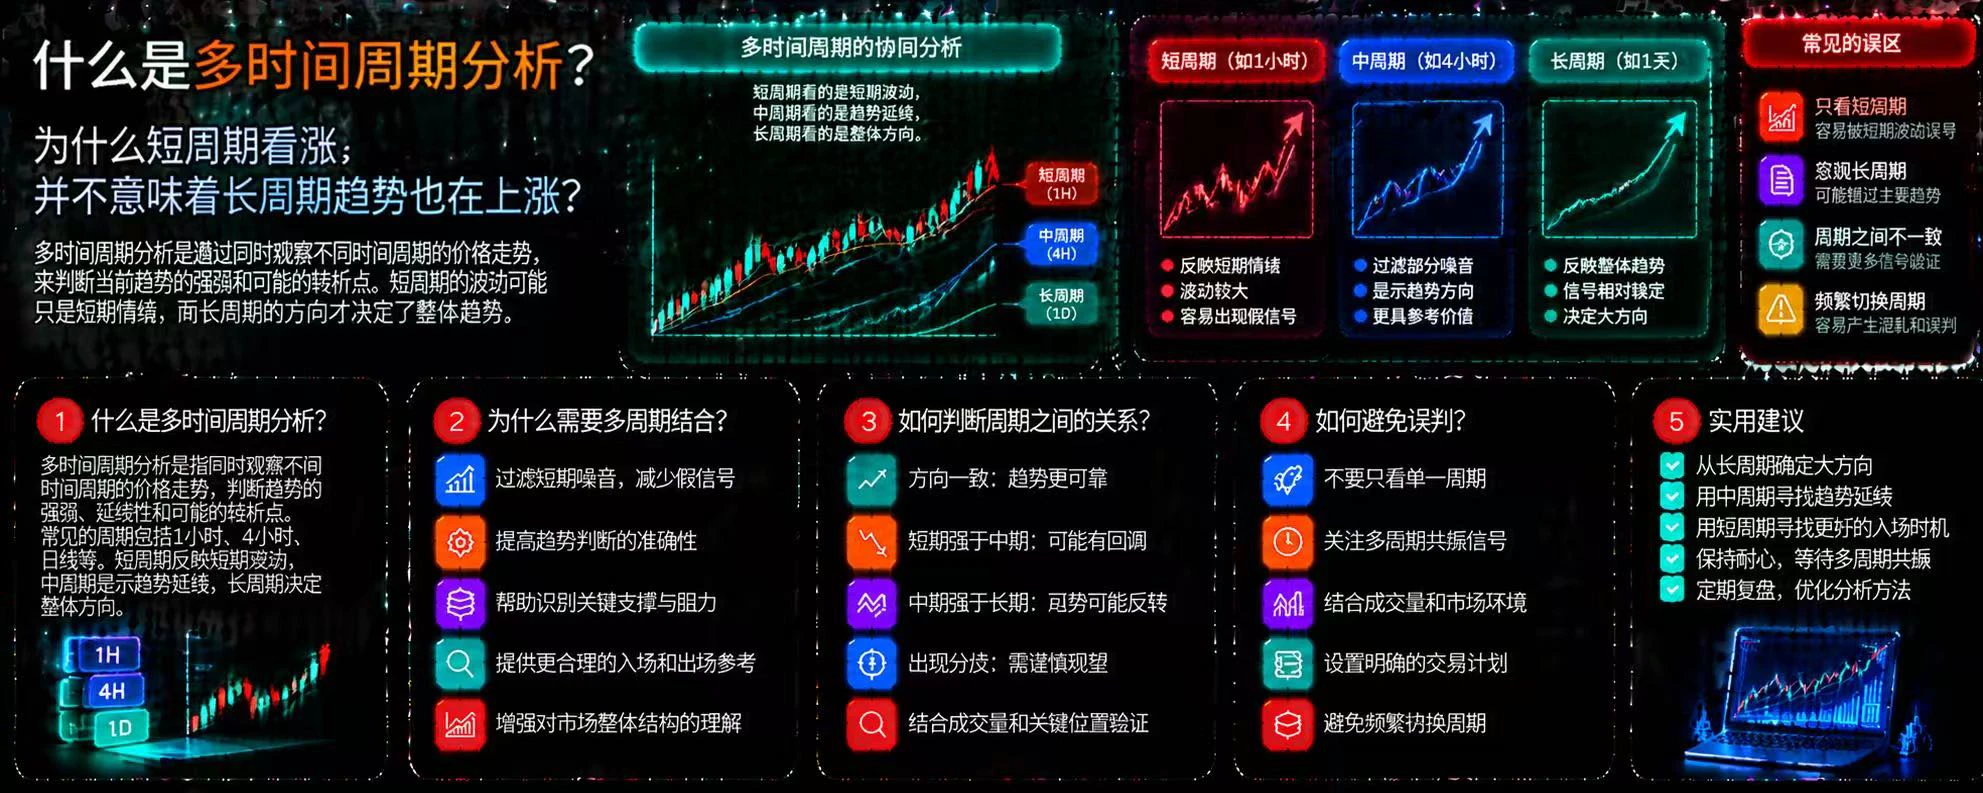
What Is Multi-Timeframe Analysis? Why Doesn't a Bullish Short Timeframe Mean the Long-Term Trend Is Also Rising?

In cryptocurrency trading, the same asset can show completely different price movements across different timeframes. The 15-minute chart may be rising, while the 4-hour chart remains in a downtrend, and the daily chart may show the market moving sideways. Looking at just one timeframe can easily lead you to mistake a brief rebound for a trend reversal.

First, what is multi-timeframe analysis?

Multi-timeframe analysis means observing price movements across different timeframes at
post-image
Aghhh fine'ally made it home.
Have a great night everyone see you all tomorrow.
Everything is fine!
🔥🐶🔥
post-image
The data looks off. $UVXY is currently at 22.67, up 36.32% in 24 hours, with a high of 24.82 and a low of 16.25—going from 16 to 24 in a single day isn't ordinary volatility; panic buyers are scrambling to get in. Trading volume hit 175.4 million, with volume exploding.
Three possibilities: first, the market is pricing in a tail risk, and smart money is hedging early; second, a short squeeze combined with volatility mean reversion—once an asset like UVXY takes off, the rally can be explosive; third, someone is using UVXY as a short-term panic hedge, suggesting institutions are reducing spot e
UVXY+44.07%
  • 9
  • 2
This passage still has a lot of feeling to it.
post-image
$XRP is showing signs of selling pressure after a $9.603K long liquidation around $1.1943. This suggests leveraged buyers are being forced out, potentially creating room for another downside liquidity sweep. Buyers need to defend demand and reclaim nearby resistance before a meaningful recovery can develop.
Support: $1.1800 – $1.1900
Resistance: $1.2100 – $1.2250
Next Target: $1.1600
A breakdown below support could accelerate bearish momentum, while a strong reclaim of resistance would signal improving buyer strength. Patience matters—wait for confirmation.
Let's go $XRP ‌
post-image
XRP-1.15%
Live market update
live-cover
LIVE1,866
Load More

Join 40 M users in our growing community

⚡️ Join 40 M users in the crypto craze discussion

💬 Engage with your favorite top creators

👍 See what interests you

Trending Topics

USStocksFaceHistoricSelloff

2.23k Views3.59k Discussing

U.S. stocks suffered a sharp selloff on Thursday, with the Nasdaq closing down more than 5% and the Philadelphia Semiconductor Index falling over 12%. AI and chip stocks including $NVDA and $AMD were hit especially hard. Markets are reassessing AI valuations, data-center spending and future returns. Is this just short-term deleveraging, or the start of a deeper correction in the AI trade? Which sectors are you watching next?

GateLaunchesPoSECProofOfSecurity

13.06k Views579 Discussing

USNonfarmPayrolls

11.25k Views4.02k Discussing

View More