Square
Following
Hot
News
Notifications
Profile
Share your thoughts
placeholder
Article
Nvidia Brings Forward Employee Pay Raises After Jensen Huang's Exit
Nvidia is moving up its employee compensation schedule as the company navigates a major leadership transition.
According to the Financial Times, interim CEO Colette Kress has promised employees salary increases and additional equity awards in December, several months earlier than the usual March schedule.
The decision comes after Jensen Huang stepped down as CEO following 33 years leading the company.
The move highlights an important challenge for Nvidia: retaining experienced talent and maintaining employee confidence during
NVDA-2.97%
  • 3
  • 2
$ZEC longing with only 1% fund at 916 - 906 , targets would 930, 945 & 960
We will take further entries in this trade . Follow the plan .
post-image
ZEC+1.16%
  • 2
  • 2
Trenches
PIEVERSE
P
bade
b
PIEVERSE
0x0e...25a9
Market Cap
$.
Change
.
24h Vol
$.
Holders
.
DacityCoin
D
bade
b
DacityCoin
DKYc...pump
Market Cap
$.
Change
.
24h Vol
$.
Holders
.
GTA6
G
bade
b
GTA6
4kjr...zDnz
Market Cap
$.
Change
.
24h Vol
$.
Holders
.
mihao
m
bade
b
mihao
4Cxj...pump
Market Cap
$.
Change
.
24h Vol
$.
Holders
.
hSOL
h
bade
b
hSOL
he1i...tn9A
Market Cap
$.
Change
.
24h Vol
$.
Holders
.
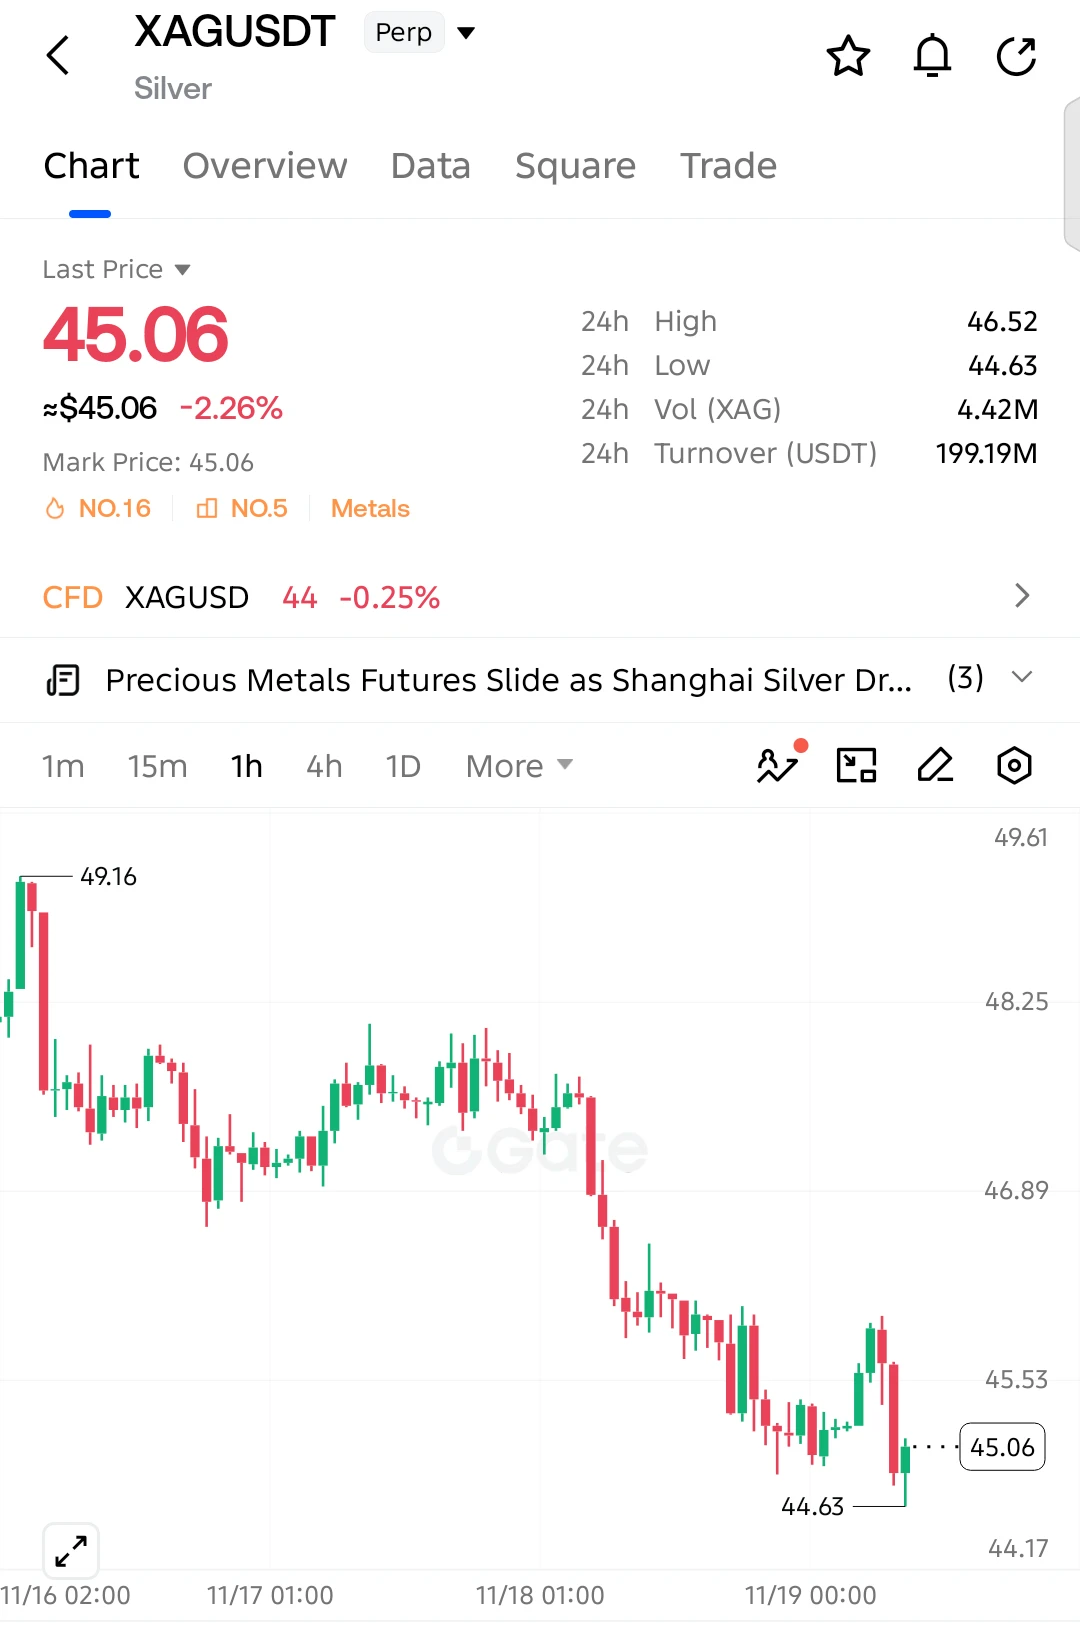
$XAG SILVER UNDER PRESSURE — IS $44.17 THE NEXT TARGET?

Silver has dropped 2.26%, with sellers maintaining control after repeated failed recoveries. The hourly chart continues to show lower highs and lower lows.

Current Price: 45.06
Key Support: 44.63
Next Downside Target: 44.17
Resistance: 45.53

A confirmed breakdown below 44.63 could extend the decline toward 44.17. Buyers need to reclaim 45.53 to ease the bearish pressure.
post-image
XAG+0.47%
  • 1
$1000LUNC It rose 18% in 24 hours, touching a low of 0.0381 and a high of 0.0473. The range is clear, but trading volume was only 22.0M. This combination feels a little odd: the price made a decent move, but volume didn’t follow.
There are a few possible explanations. First, the tokens may not be in retail hands to begin with, so it doesn’t take much volume to push the price up; sell-side liquidity is thin, and a few trades can move it higher. Second, market makers may be testing the waters, pushing it up to see how much follow-through buying there is. Low volume suggests nobody is stepping in
  • 1
BTC ,ETH MARKET PREDICTION
live-cover
LIVE3,397
The countdown is on—there’s really not much time left. This round of the annual celebration is about to end, and I’m still on the leaderboard, just a little short. Just head to the event page and send me support points—it’s completely free. After that, you can still enter the support points raffle, and anything you win is yours. Don’t wait until it’s over and regret it—just tap in now; it’ll only take a few dozen seconds. https://www.gate.com/zh/competition/Annual-Gala?ref_type=165&ch=Direct&ref=UVdMV1w
  • 2
ICNT | Long 🟢 | Bullish | 15m 24h: +17.88% | Volume: 93.1M USDT. Long rationale: Price above EMA200; EMA20/50/200 are in bullish alignment; RSI14 is 62.7; MACD histogram is positive; ADX14 is 14.9; volume is 1.39x the 20-candle average; trend pullback/continuation. Entry: 0.3358. Stop-loss: 0.317011. Take-profit 1: 0.359286 | Take-profit 2: 0.373378 | Take-profit 3: 0.392166. Entry price is for reference only; do not chase. The trading strategy is invalidated if the stop-loss price is hit. Technical analysis only. Not investment advice. $ICNT
post-image
ICNT-10.32%
The short-term bottom is really in; try going long. The entire market may be waiting for Anthropic to list on Nasdaq at 10:30 tonight. If ant can hold steady or move up another step, everything will get better. Previously, everyone speculated on AI through the upstream and downstream, with things like memory and optical modules; real AI has yet to be tested by the market—and that happens tonight!
post-image
PIPPIN’s market maker is probably up to something. Take EVAA, for example: before it rallied to $3.8, it had four spikes followed by pullbacks, each topping out around $1. PIPPIN also has a history of repeated pumps and dumps, with its tops consistently around $0.02. It’s easy to see that the two tokens’ trading patterns are extremely similar: both use frequent pumps and dumps to gradually condition retail traders to think short. This is the underlying logic behind the saying, “Test the top enough times and it will eventually break.” I can’t say whether PIPPIN will break its previous high this
post-image
PIPPIN-2.30%
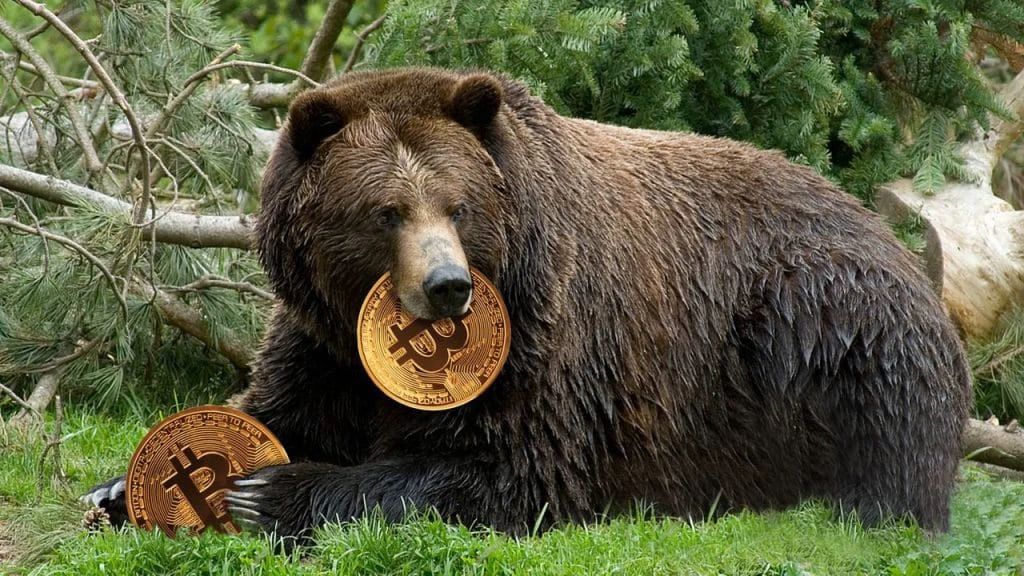
Bitcoin’s current decline may not be a simple technical pullback, but a stress test driven by capital, liquidity, and macroeconomic policy.

The most concerning factor is that three adverse signals are emerging at once: Wall Street is pulling back, buying power in the crypto market is shrinking, and the Federal Reserve is sending hawkish signals.

Together, these forces are making an already fragile market even more vulnerable.

First, institutional capital is contracting.

U.S. spot Bitcoin ETFs have seen sustained net outflows recently, as Wall Street’s risk appetite has clearly declined. Ev
post-image
BTC-0.65%
ETH-1.23%
$PIEVERSE ‌

$PIEVERSE reveals a classic parabolic expansion followed by a localized retracement. The macro flow (4-hour chart) indicates a massive impulsive wave from the ~1.50 base to a peak of 3.6302, heavily driven by volume. The micro flow (30-minute and 1-hour) shows the immediate aftermath: a bearish corrective phase where early buyers are taking profits. The liquidation cascade is visible on the 30m/1h charts as the price violently rejected from the 3.63 top, sweeping long leverage positions built during the vertical climb.

🔷️Volume and Liquidation Dynamics

Volume analysis shows a
PIEVERSE+0.58%
  • 2
  • 1
gm
don't let nobody tell you it can't be done.
be the difference!!!
post-image
The headlines calling it the worst April are still on the front page, but the Nasdaq finished April up. Not a peep. When it fell, the headlines went all out; when it bounced back, they acted like nothing happened. The media sells emotion, not retrospectives. Trust it, and you’ll be stuck buying high and selling low forever. I’ve got a fund statement from when I opened my account in April stuck to my fridge. The red column still hasn’t gotten back to breakeven. So, is this rally a recovery in the narrative or a real reversal? I still haven’t figured it out.
post-image
NAS100+1.11%
  • 2
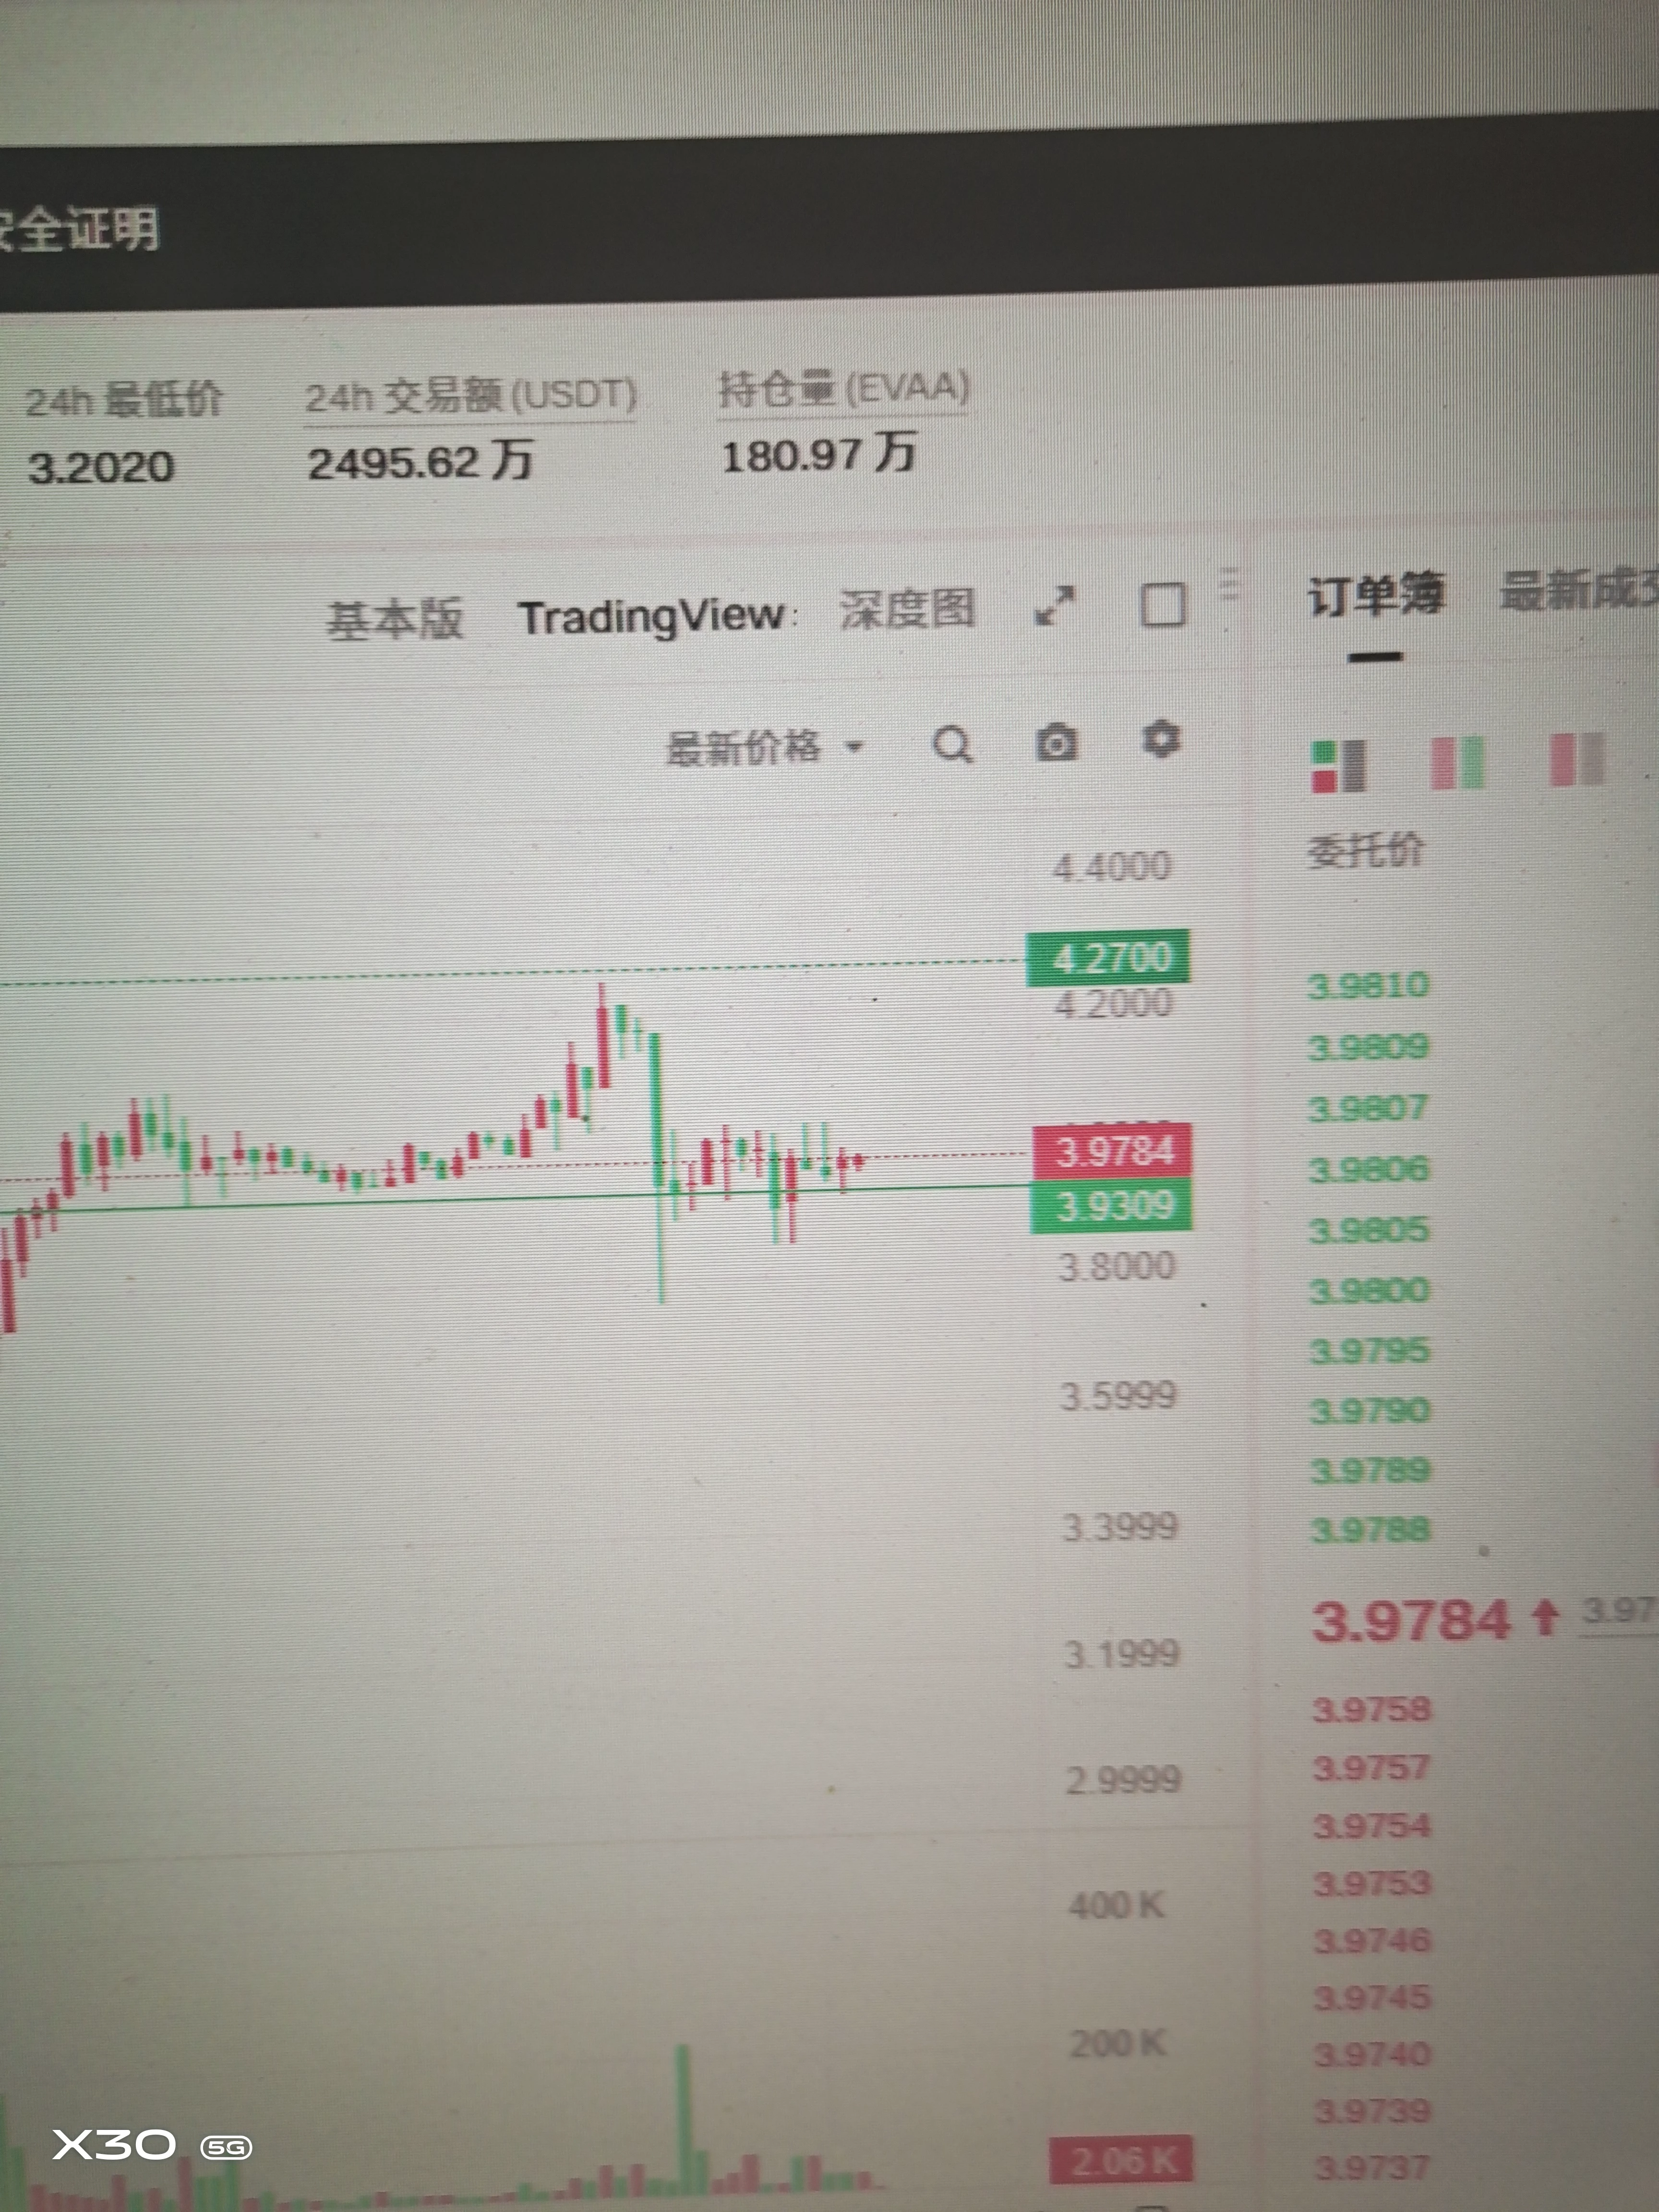
Today's key focus: evaa. It can be shorted at the current price, with a stop-loss at 4.27
post-image
EVAA-0.42%
Ethereum market prediction update
live-cover
LIVE1,477
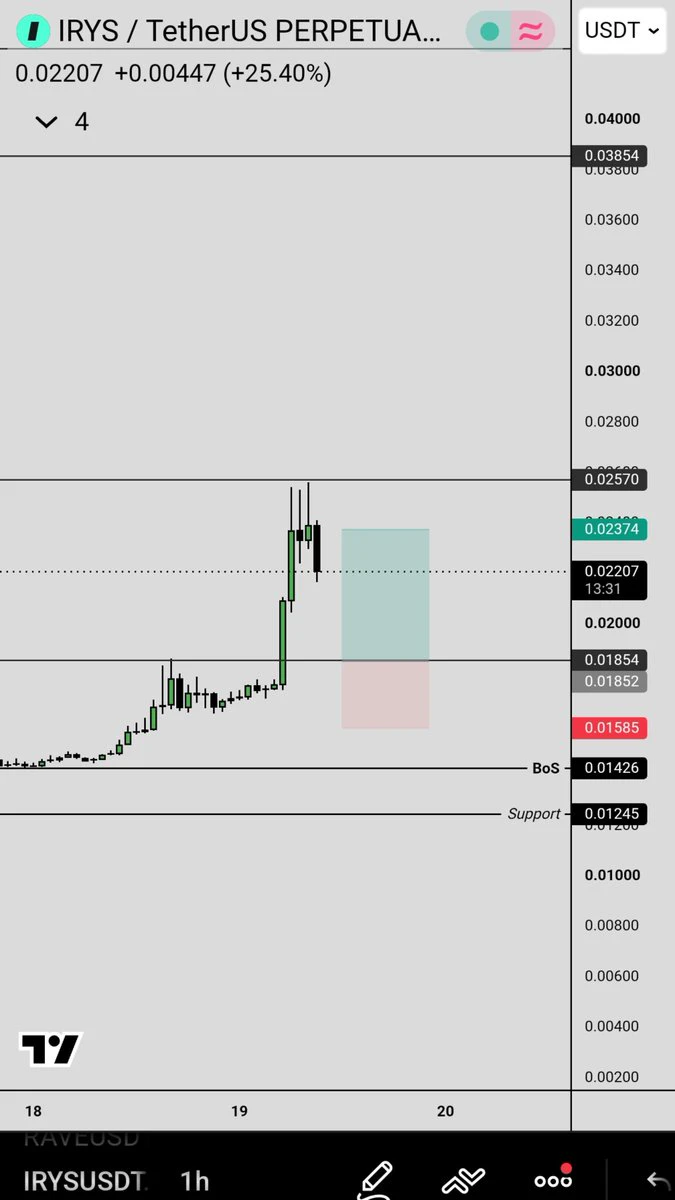
#Irys $Irys second Entry
post-image
IRYS-22.27%
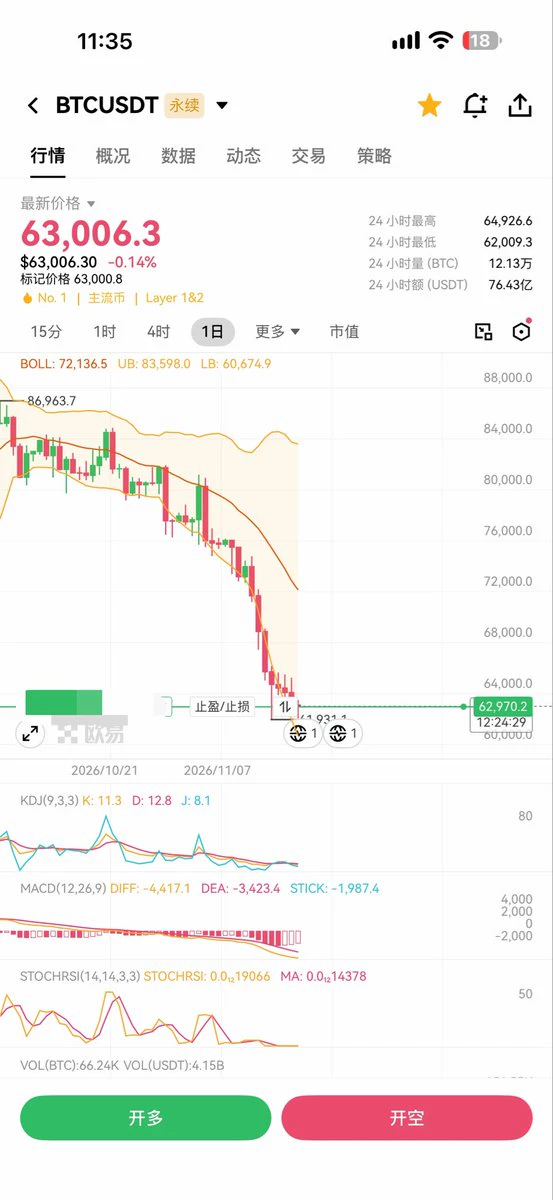
CryptoQuant warns Bitcoin back in bear market, needs to surpass $75,900 to recover
Bitcoin is back in a bearish phase. The largest realized loss since July 13. The $62K–$65K support is in play.
Per CryptoQuant’s “Bear Claw” report published on November 17, BTC fell to around $61,000 — its lowest level in four months — wiping out all gains since August 19.
⚠️ Personal market analysis only. NFA — manage risk and DYOR.
Educational content, not investment advice or a recommendation to buy, sell, deposit, or withdraw any asset. No paid promotion or referral/affiliate links.
post-image
BTC-0.67%
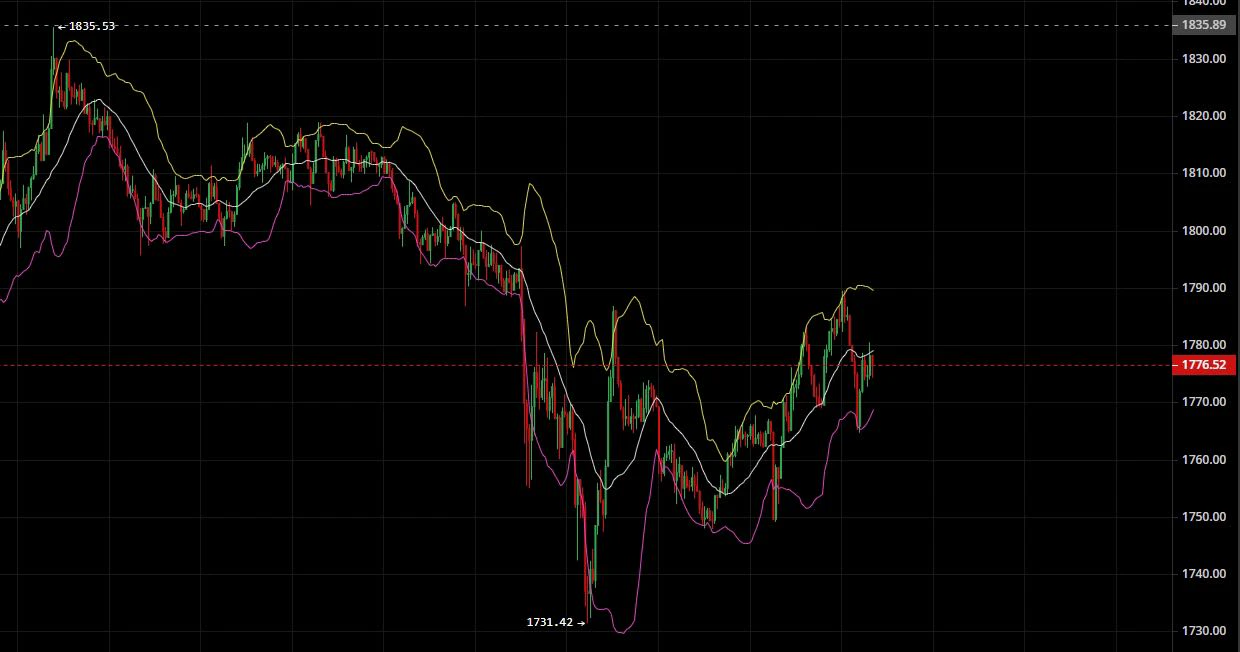
11.19 Thursday Midday Market Analysis
1. Geopolitical escalation, liquidity trap, downward shift in focus
Two months ago, we judged that a deep bear market would begin after the midterm elections. The bear market is quietly arriving, with large funds rushing for the exits early and liquidity weakening by the day.
News from Israel: action may be taken in the coming days. Iran’s commander-in-chief made a hardline statement: if attacked, its response would not be limited by geography, while it steps up defensive preparations.
The result: well-informed large funds have already rushed to exit, and
post-image
GLDX-0.40%
PAXG+0.37%
XAU+0.38%
XAG+0.47%
NAS100-0.07%
  • 5
  • 2
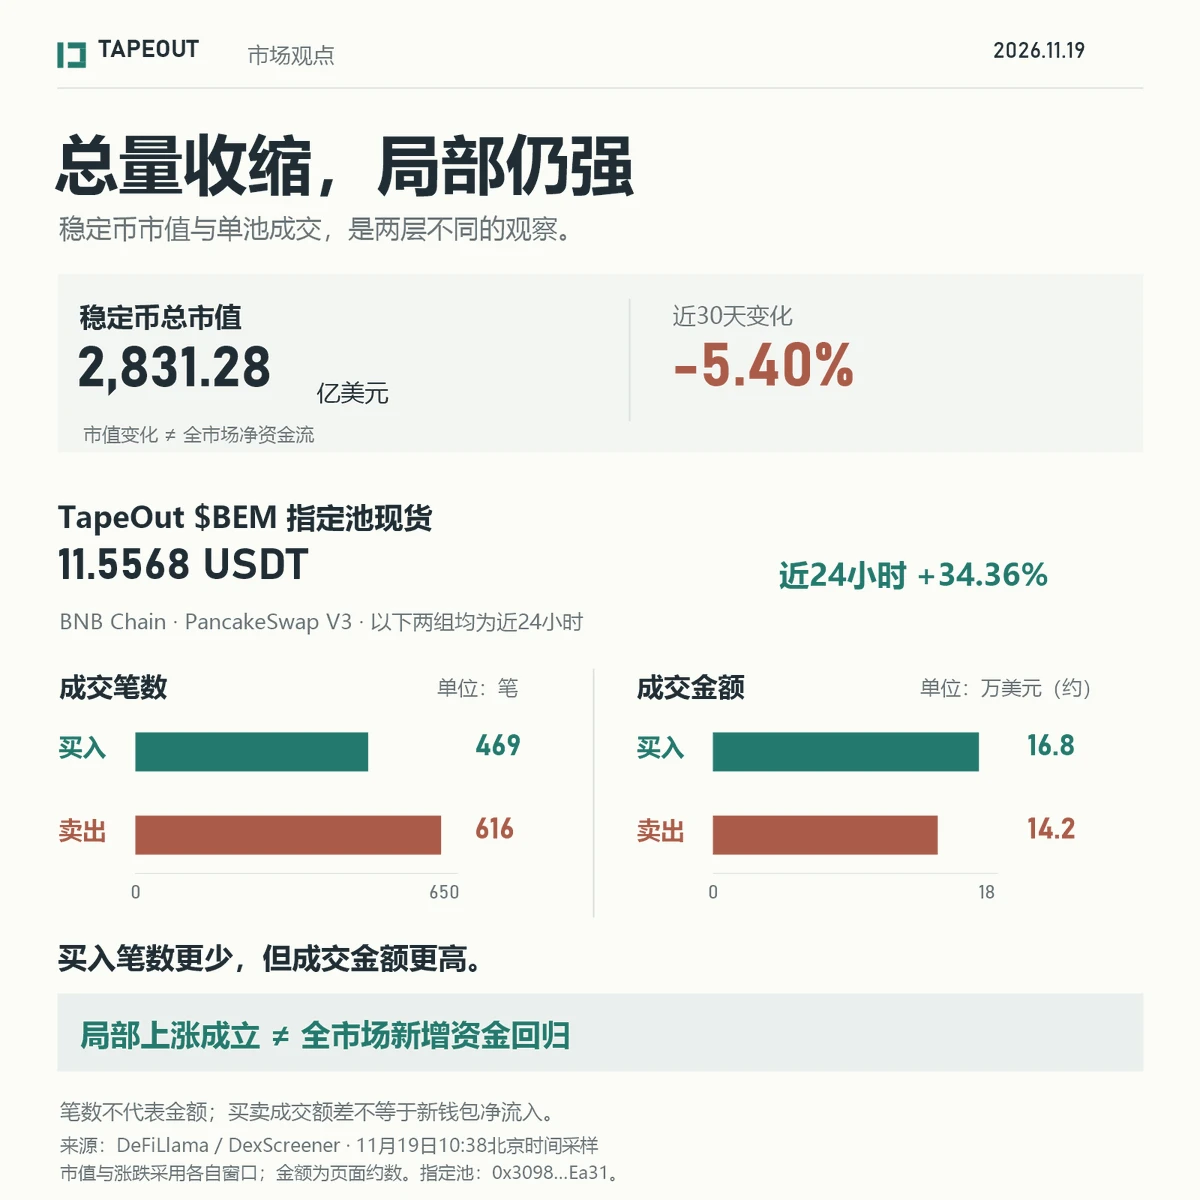
November 19 Market View | Funding Conditions Are Tightening—Why Are Some Assets Still Surging?
Today, I see the crypto market as a structural market: key funding indicators remain under pressure, but some parts of the market are already seeing strong trading activity. To assess a token’s performance, you need to look at its own trading. To assess funding conditions across the market, you can’t look only at the best-performing assets of the day.

First, let’s look at two different sources of funding.

The DeFiLlama page, viewed at 10:38 Beijing time, showed a total stablecoin market cap of $283
post-image
BTC-2.21%
IBIT-2.21%
CAKE+0.58%
  • 2
Load More

Join 40 M users in our growing community

⚡️ Join 40 M users in the crypto craze discussion

💬 Engage with your favorite top creators

👍 See what interests you

Trending Topics

FedMayNeedA50bpRateHike

381.2K Views2K Discussing

Minutes from the Fed’s October meeting showed that while officials kept rates unchanged, “almost all” policymakers still believed further rate hikes would be needed if the economy evolved as expected. More importantly, a few officials said that if inflation remained too high, the Fed could even need a 50bp hike at a future meeting. Recent inflation data have already moved closer to that kind of trigger. The market is no longer just debating whether the Fed will hike again, but whether it may need to move faster. Do you think a 50bp hike will start getting priced back in? If hawkish expectations keep rising, which faces more pressure: $BTC or U.S. equities?

AnthropicIPOPricesAt83

493.9K Views4K Discussing

GateRanksThirdIn24HNetInflows

86.3K Views58.3K Discussing

View More