Share your thoughts
placeholder
Article
CELR 0.004133, pulled back after surging 75%; I’ll enter if 0.0038 holds
CELR at the time of posting: 0.004133
Conclusion:
If 0.0038–0.0040 holds, enter long with a light position. Stop-loss at 0.0036, with targets at 0.0048 → 0.0052.
If 0.0052 is cleared, look toward 0.006; otherwise, it indicates distribution at the highs.
If 0.0036 breaks, do not enter; wait for 0.0032.
Market structure:
• From 0.002346 to 0.0052, the token posted a near-doubling 24H gain, with 34.4 billion tokens in volume—an explosive surge in volume
• The pullback to 0.004133 after the spike represents the absorption of
CELR+71.48%
The data looks bearish at first glance, but there’s an interesting part here.
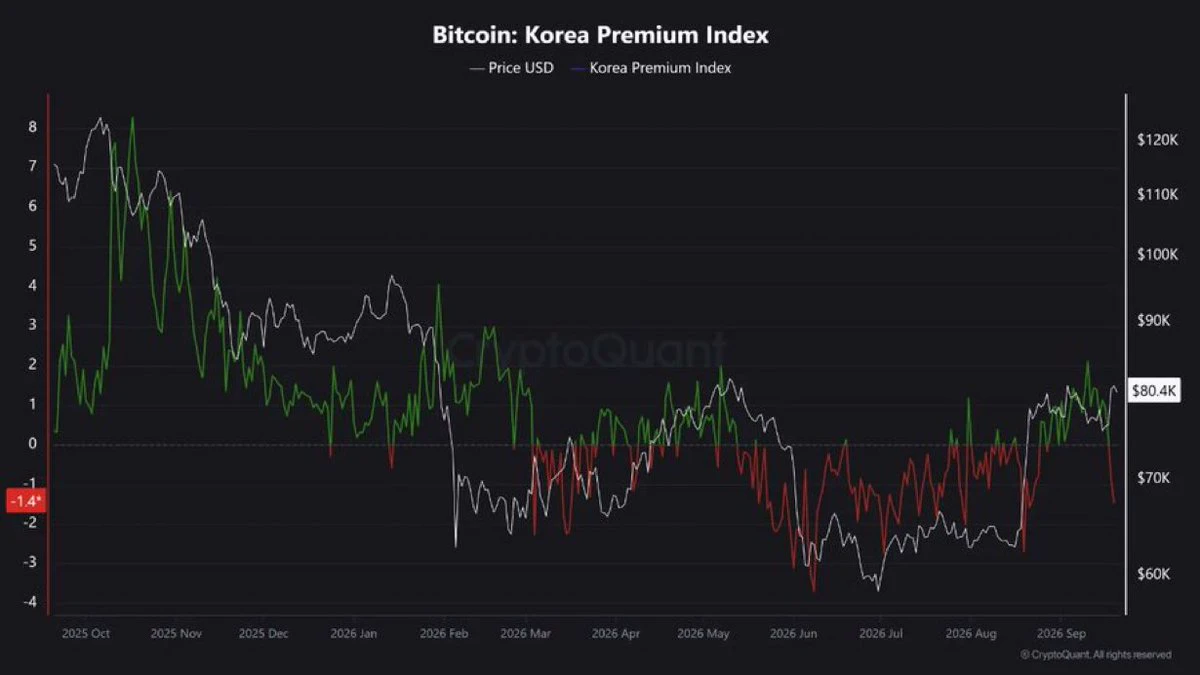
Funding is cooling, OI is coming down and $BTC hasn’t completely lost its structure.
If that continues, we could be watching leverage get cleaned out before the next move higher.
post-image
BTC-1.12%
  • 1
Nobody is talking about this bullish setup forming right under our noses.

$BTC /USDT - LONG

Trade Plan:
Entry: 80345 – 80503
SL: 79665
TP1: 80993
TP2: 81373
TP3: 81942

Why this setup?
Why now? The daily trend is bullish and the 1h price is holding steady at 80424, which aligns perfectly with a 15m RSI of 50.6 to confirm neutral momentum before a push. The 1h ATR of 316.292315 tells us the recent volatility is contained enough for a clean breakout. The entry zone between 80345 and 80503 offers a precise risk-defined opportunity to go long with targets at 80993 and 81373. Everything points
BTC-1.12%
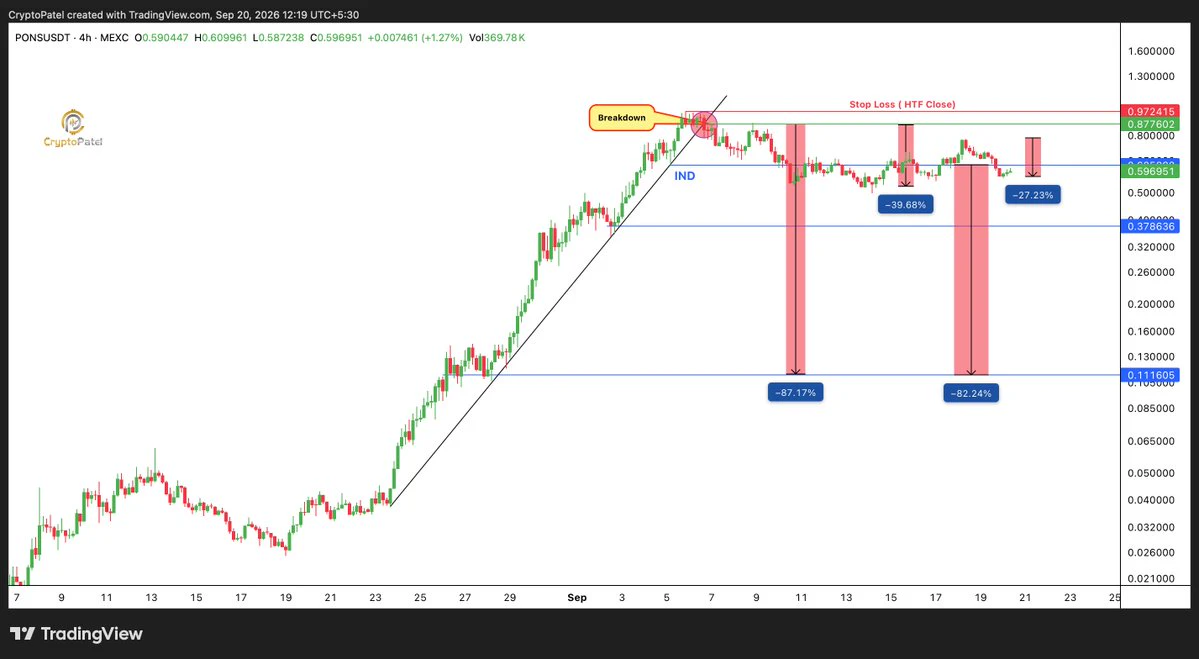
$PONS Structure Just Flipped Bearish:
The Failed Breakout + Trendline Breakdown Leaves $0.378 As The First Major Magnet, While A HTF Close Above $0.972 Invalidates The Bearish Thesis.
post-image
PONS-10.06%
Pepe has fallen onto the trampoline, and now it’s time to bounce back to the green pasture! Long position range on $1000PEP .
Entry area: 0.0039071 - 0.0039316 Target 1: 0.0041064 Target 2: 0.0042560 Stop-loss (SL): 0.003780 Note: Suppressed volume may delay momentum, causing choppy price action during range-bound trading. Never go all-in, bro. Use a position size suitable for your own account. Look for this upside push. 👇👇👇 tracks this pair: $ZE and $PTB .
PTB+17.59%
🚀 Guys, buy $ONE
now and use 15x isolated leverage in futures...Entry zone: $0.00395 – $0.00420Stop Loss (SL): $0.00300Take Profit (TP 1): $0.00450Take Profit (TP 2): $0.00480Take Profit (TP 3): $0.00520Take Profit (TP 4): $0.00580Click below to place your trade immediately ...👇Setup logic: $ONE After a strong rally from around $0.0023, it is currently consolidating sideways near $0.0040. The $0.0036–$0.0038 area is serving as an important short-term support level. If the price cleanly breaks above $0.00450, it could pave the way toward $0.00480 and $0.00520. If buyers reclaim $0.00520 with
post-image
Which kind do you prefer... If I had no position, I wouldn't get emotional over a failed trade, after all, there was no consolidation divergence in the preceding leg.
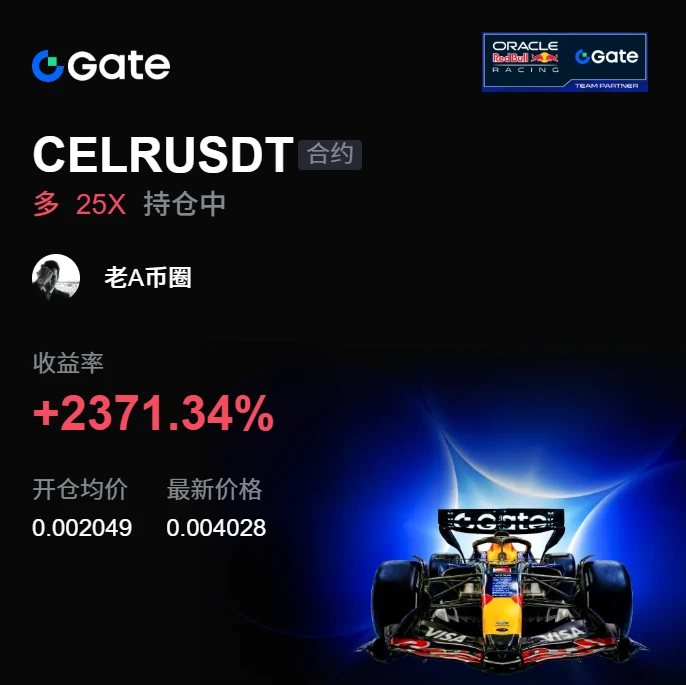
I didn’t make any particular judgment; I just held it a little longer, and didn’t expect it to actually deliver. During the intraday bottoming process, the $CELR key level held, buying strengthened, and I said at the time: go long, don’t mess with the long position.

From 0.002049 to 0.004028, +2370.15%—the wait was worth it. Bank most of the gains first: take profit on 80%, protect the remaining 20% at the entry price, and move the stop loss closer to the entry price.

Hold as long as the trend remains intact; get out if it breaks down. Don’t fall in love with a stock. The prerequisite for
post-image
CELR+71.48%
DOGE-3.56%
BTC-1.12%
If this $CAP short position reclaims the previous high, I’ll exit immediately—I won’t try to reason with it. We’re not there yet; the price is grinding below the key level, so the short position can be held.

Structurally, this round of decline began with a false breakout: a long upper wick pierced above the previous high, followed by a high-volume break below the neckline. The neckline has now turned into resistance. Rebounds from this pattern usually don’t go far.

At 0.04518, there is still some room before the upper neckline, so I’m not in a hurry to add to the short. For the downside, I
post-image
CAP-37.93%
XRP-3.56%
ETH-2.42%
$AKE I can’t make sense of it—at 0.18, I got liquidated outright, and it immediately came back down. The 0.08 short position was liquidated, directly causing a loss of 3,000u. I only put in 150u and lost this much—my itchy hands.
AKE-11.76%
JUST IN: BlackRock exec says Bitcoin ($BTC ) volatility has been cut in half.
The shift? From "get-rich-quick narrative" to "collateral narrative."
Major institutions don't use the word collateral lightly.
That's institutional positioning language.
BLK+1.45%
BTC-1.12%
TAO is range-bound, but this setup is begging for a trap.

$TAO /USDT - SHORT

Trade Plan:
Entry: 251.8 – 254.0
SL: 263.2
TP1: 245.1
TP2: 240.0
TP3: 232.2

Why this setup?
Why now? The 1d trend is range, which means TAO is coiled for a directional move, and the bias favors a short. The 1h ATR of 4.31 tells us volatility is high enough to reach targets but not so wild that a clean entry is impossible. The 15m RSI at 45.1 shows bearish momentum without being oversold, allowing a short to catch the next leg down. The entry zone sits between 251.8 and 254.0, offering a precise ref of 252.9 wher
TAO-4.98%
Mrs. Song in Dwelling Narrowness said
Men need a stepping stone when they are young (a virtuous wife to help them achieve their ambitions)
A shot in the arm in middle age (a young, beautiful female college student)
A walking stick when they are old (a nanny)
Husbands, is this really how it is?
post-image
Long $BR
is showing a strong bounce from the support zone and has just broken CHoCH. For the second round, prioritize waiting for a pullback before going LONG; do not chase the price.Entry 1: 1.205 – 1.215 USDT (retest of the breakout zone)Entry 2: 1.175 – 1.185 USDT (nearby support)Entry 3: 1.145 – 1.155 USDT (deep pullback zone)Take Profit:TP1: 1.300 USDTTP2: 1.400 USDTTP3: 1.550 USDTStop Loss: 1.000 USDTIf the 1.14–1.18 cluster holds, the bullish structure remains solid; only a decisive break above 1.40 would open up more room for the next wave. Split the volume evenly across the 3 entries
post-image
BR+13.56%
Most traders are about to get blindsided by SYMAs next move.

$ZAMA /USDT - SHORT

Trade Plan:
Entry: 0.08614 – 0.08904
SL: 0.10151
TP1: 0.07715
TP2: 0.07020
TP3: 0.05976

Why this setup?
Why now? The 1h price is sitting at 0.08759, right inside a tight entry zone between 0.08614 and 0.08904, which sets up a clean short setup. The daily trend is range-bound, meaning momentum is exhausted and a mean-reversion push lower has room to run. The 15m RSI at 59.75 shows the asset is still slightly bullish, so a reversal into the short bias would catch crowded longs off guard. The 1h ATR of 0.005798
ZAMA+17.85%
Market about BTC
live-cover
LIVE1,763
Nobody is talking about this quiet ZEC setup hiding in plain sight.

$ZEC /USDT - LONG

Trade Plan:
Entry: 1453.18 – 1464.06
SL: 1406.42
TP1: 1497.77
TP2: 1523.86
TP3: 1563.01

Why this setup?
Why now? The daily trend is bullish, and the 1h price is holding at 1458.62, which sits inside a tight entry zone between 1453.18 and 1464.06. The 15m RSI at 49.3 shows the market is neither overbought nor oversold, leaving room for a clean move up. With the 1h ATR at 21.748209, the expected volatility supports a realistic run toward TP1 at 1497.77 and a deeper extension to TP2 at 1523.86. The invalid
ZEC-5.45%
[New Streamer] Market Prediction
live-cover
LIVE1,642
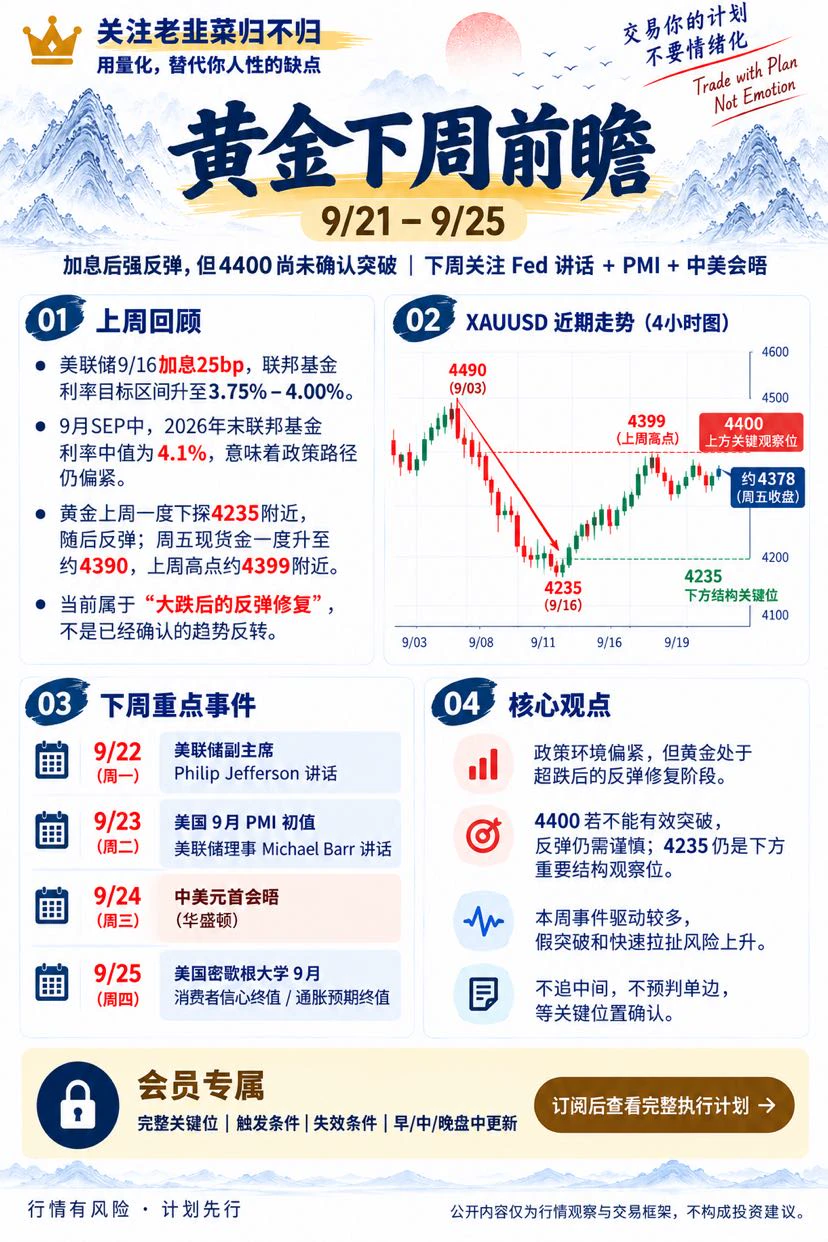
Gold Outlook for Next Week | 9/21–9/25
Gold experienced a highly volatile move last week:
After dipping to around 4235, it quickly recovered, with the high returning to around 4399.
But a rebound ≠ a reversal.
4400 remains a very important level to watch above. Next week also brings a week packed with Fed officials’ speeches and major macroeconomic events, so the risk of false breakouts and rapid back-and-forth moves will increase significantly.
My approach remains the same:
Don’t guess the one-way move, don’t chase the middle, and wait for confirmation at key levels.
📌 The public version fir
post-image
XAUUSD+0.83%
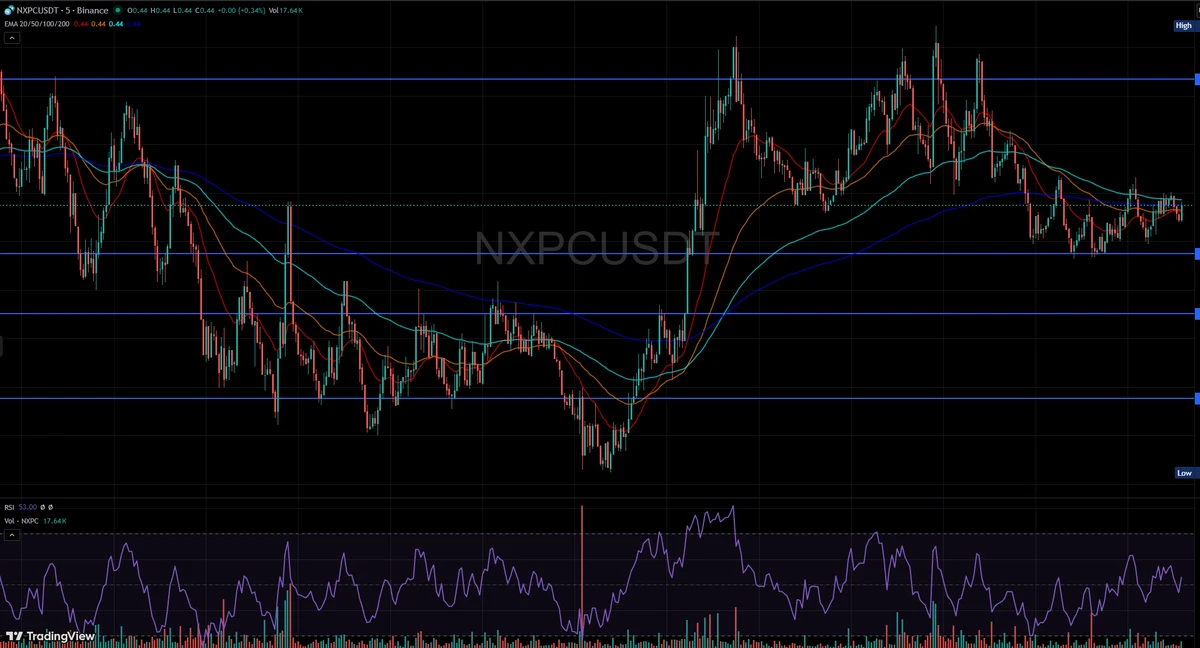
Fresh bounce energy is flowing into $NXPC after buyers defended support cleanly. The recovery is gaining traction, momentum is improving, and the structure is beginning to look significantly more attractive. Continued participation could determine whether this develops into a larger trend rather than another short-lived rebound.
Compute-focused strength around $RENDER could help set the tone and provide an additional signal for the developing move.
post-image
NXPC-2.70%
RENDER-5.51%
Load More

Join 40 M users in our growing community

⚡️ Join 40 M users in the crypto craze discussion

💬 Engage with your favorite top creators

👍 See what interests you

Trending Topics

MSTRTopsNasdaq100

73.88k Views2.87k Discussing

Strategy (MSTR) has gained about 48% over the past month, making it the best-performing stock in the Nasdaq 100, while Bitcoin rose roughly 12% over the same period. The company holds 845,050 BTC with a cumulative cost basis of about $63.73B. MSTR is not a pure Bitcoin proxy — its price swings can be more extreme. Can this rally last?

Gate Tops 24H Net Inflows Among Exchanges

26.36k Views3.67k Discussing

BTCRetakes80K

56.9k Views60.37k Discussing

View More