Square
Following
Hot
News
Profile
Share your thoughts
placeholder
Article
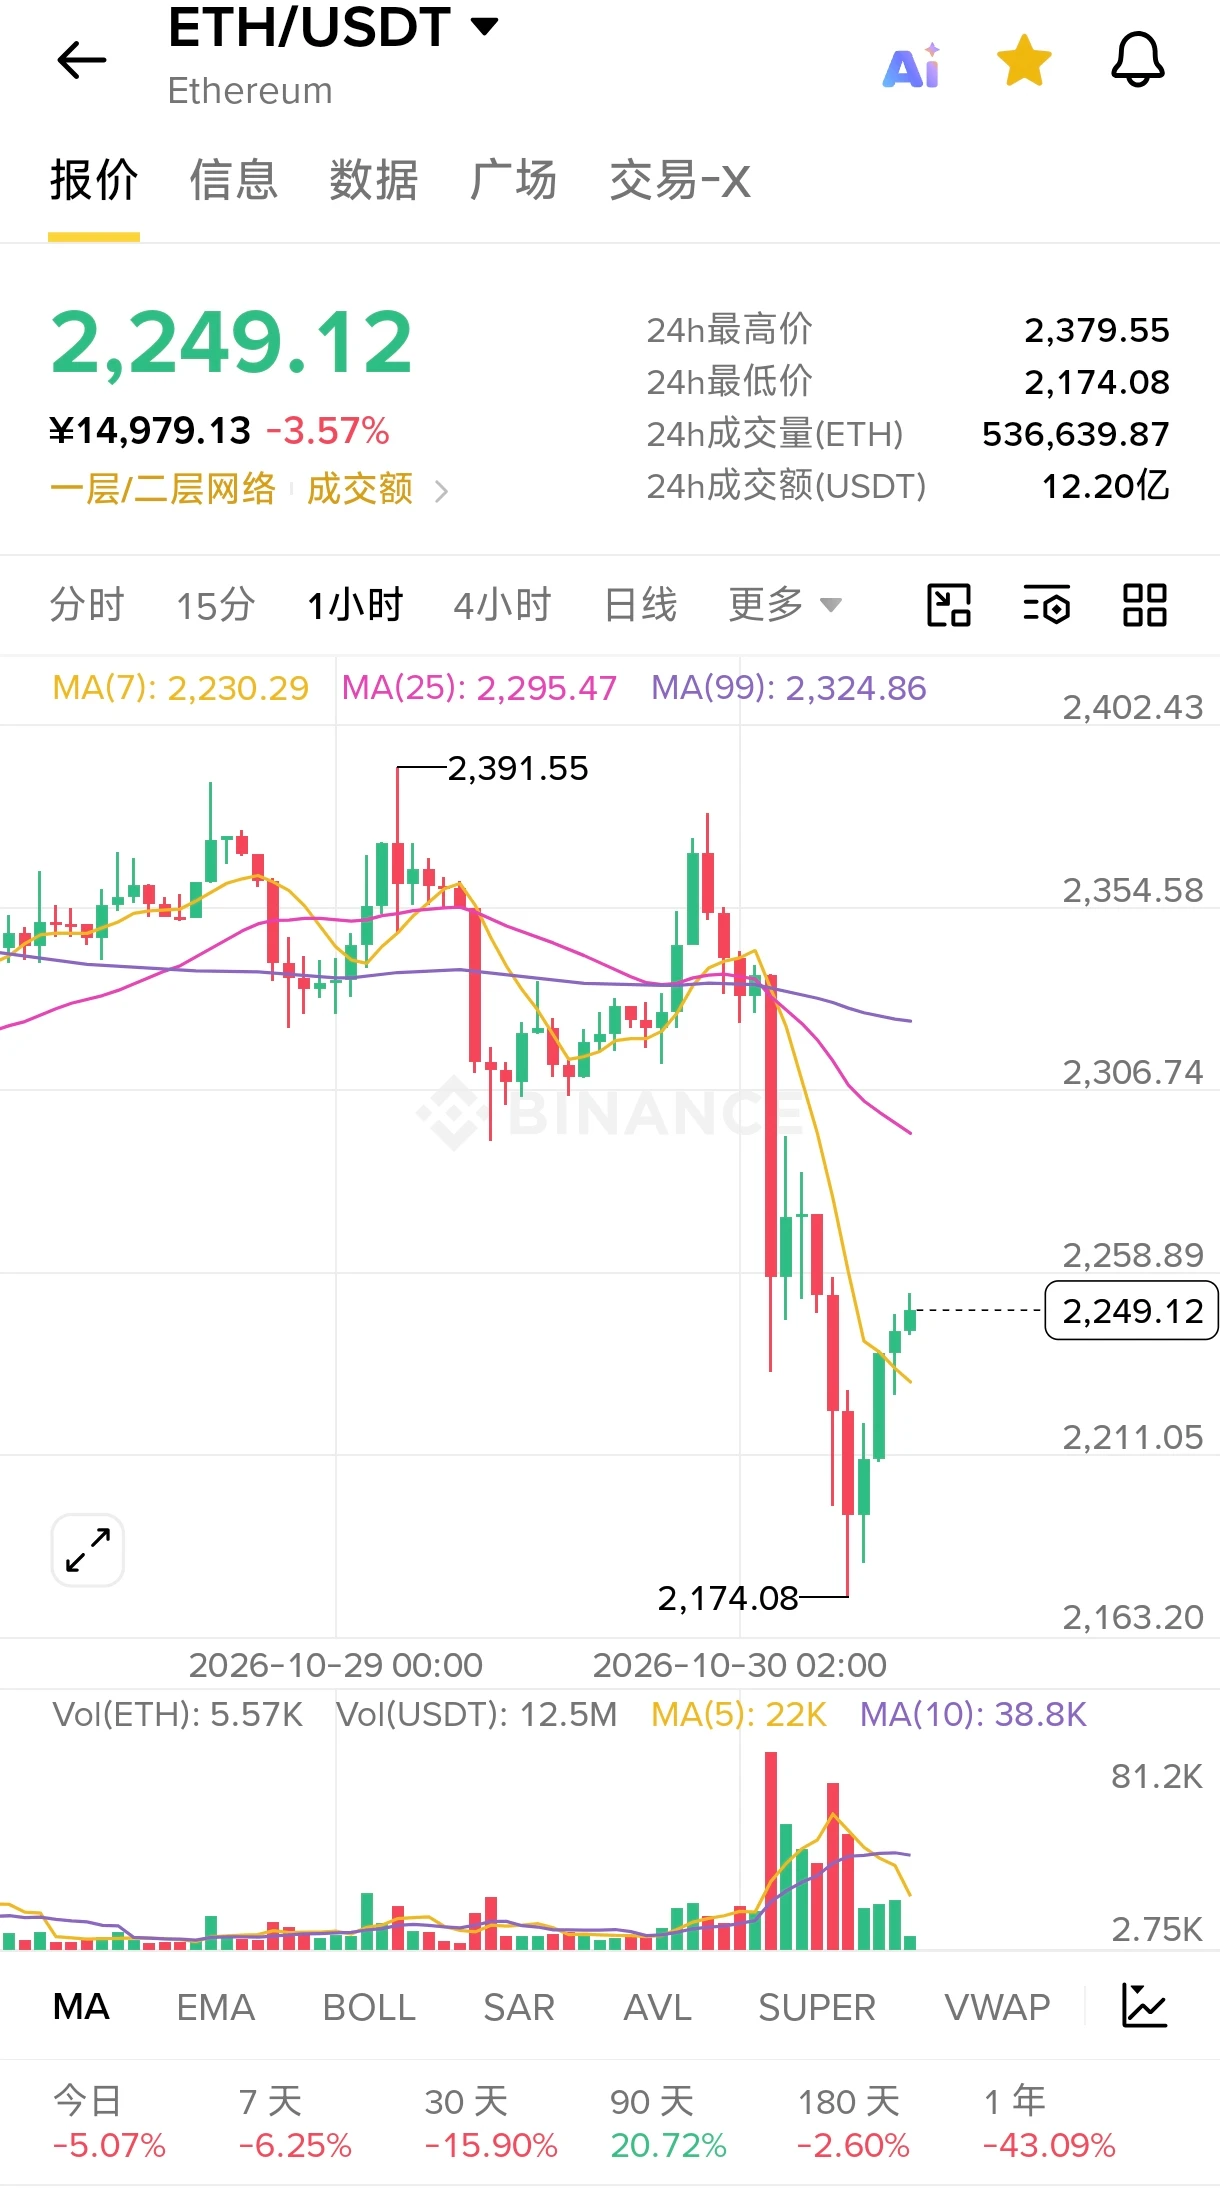
10.30 ETH Trading Setup
ETH saw a sharp drop on the hourly chart, falling continuously from above 2390 to a low of 2174. Bears concentrated their selling over a short period. The price has now rebounded to around 2249. After the sell-off, bearish momentum has temporarily faded, and short-term moving averages are turning upward as the price recovers. The market is showing signs of a technical rebound.
Entry zone: Light long on a pullback to around 2230
Stop-loss: 2188
First target: Reduce position around 2290
Second target: 2320 (strong resistance at a previous high-volume area)$ETH ‌
post-image
ETH-1.23%
  • 2
10/30 Intraday Level Update! Follow for ongoing updates to precise levels
BTC / ETH / Gold / U.S. stocks
Overall strategy: Short-term risk has eased somewhat. Favor longs at lower levels and look to short again near rebound highs.
After the consecutive corrections, the market is gradually approaching lower levels worth watching. For now, we don’t expect a sustained one-way decline in the short term; we favor a bottoming range with repeated recoveries.
The medium-term outlook still focuses on lower levels, but the short-term rhythm has shifted somewhat. Be willing to buy at lows and exit at hig
post-image
BTC-0.67%
ETH-1.26%
XAUUSD-0.98%
SNDK-5.26%
MU-4.86%
Trenches
BNCB
B
bade
b
BNCB
0x49...ec3f
Market Cap
$.
Change
.
24h Vol
$.
Holders
.
ENA
E
bade
b
ENA
0x57...6061
Market Cap
$.
Change
.
24h Vol
$.
Holders
.
PEPE
P
bade
b
PEPE
0x69...1933
Market Cap
$.
Change
.
24h Vol
$.
Holders
.
GTA6
G
bade
b
GTA6
4kjr...zDnz
Market Cap
$.
Change
.
24h Vol
$.
Holders
.
XDP
X
bade
b
XDP
0x07...91d0
Market Cap
$.
Change
.
24h Vol
$.
Holders
.
Birds of a feather flock together.
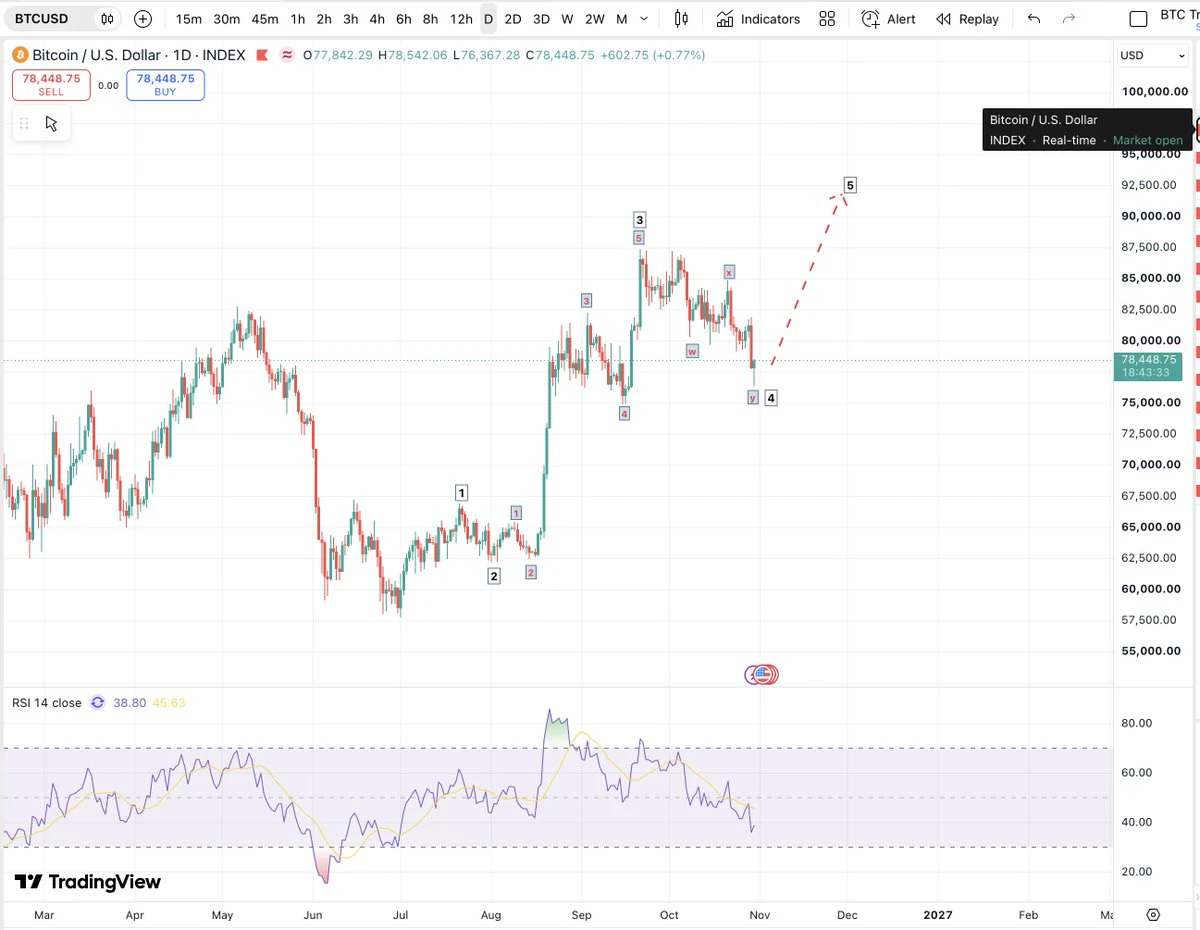
#BTC’s latest dip remains consistent with my preferred wave 4 count, potentially completing a W–X–Y correction.
Hidden bullish RSI divergence and a developing reversal candle support the possibility of wave 5 higher towards $90–92k.
A break above the recent lower highs would strengthen that case. The daily candle still needs to close.
post-image
BTC-0.67%
Bitcoin was hit by multiple extremely bearish developments today. Panic is often followed by a massive rebound, and extreme bearish news during an uptrend often signals a turning point. Today’s confluence of numerous bearish factors created an extreme bearish situation, so 76,000 is highly likely to be the bottom or a secondary low. It’s uncertain whether there will be a second test of the lows, but if there are no further negative developments, the probability of one is low. #BTC跌至7.7万美元
post-image
BTC-0.67%
#英特尔财报超预期股价却暴跌
#HYPERalliesAgainstTheMarket
Intel Q3 Earnings: Strong Beat Meets Harsh Reality Check as Stock Plunges Nearly 23%
Intel Corporation delivered third-quarter results that surpassed market expectations on key profitability metrics, yet its shares suffered one of the sharpest single-session declines in recent years. The stock dropped approximately 17% to more than 23% in after-hours trading following the release, with some reports citing a plunge near the 23% mark from the prior close around $92.07. This reaction underscores a classic Wall Street dynamic: investors look past the r
  • 6
#IntelBeatsEarningsButStockPlunges
#ShareWeekly
Intel Beats Earnings but Faces a Bigger Test: Can Its Foundry Business Deliver by 2027?
Intel delivered better-than-expected Q3 2026 earnings, yet its shares declined 3.6% to $92.07 on October 29. The reaction highlights an important market reality: investors are no longer evaluating Intel solely on quarterly earnings. They want evidence that its massive AI and semiconductor investments can translate into sustainable growth and profitability.
1. Strong Earnings, But Investors Wanted More
Intel's Q3 results showed improvement across several finan
INTC-3.60%
NVDA-0.77%
AMD-2.09%
TSM-1.79%
  • 5
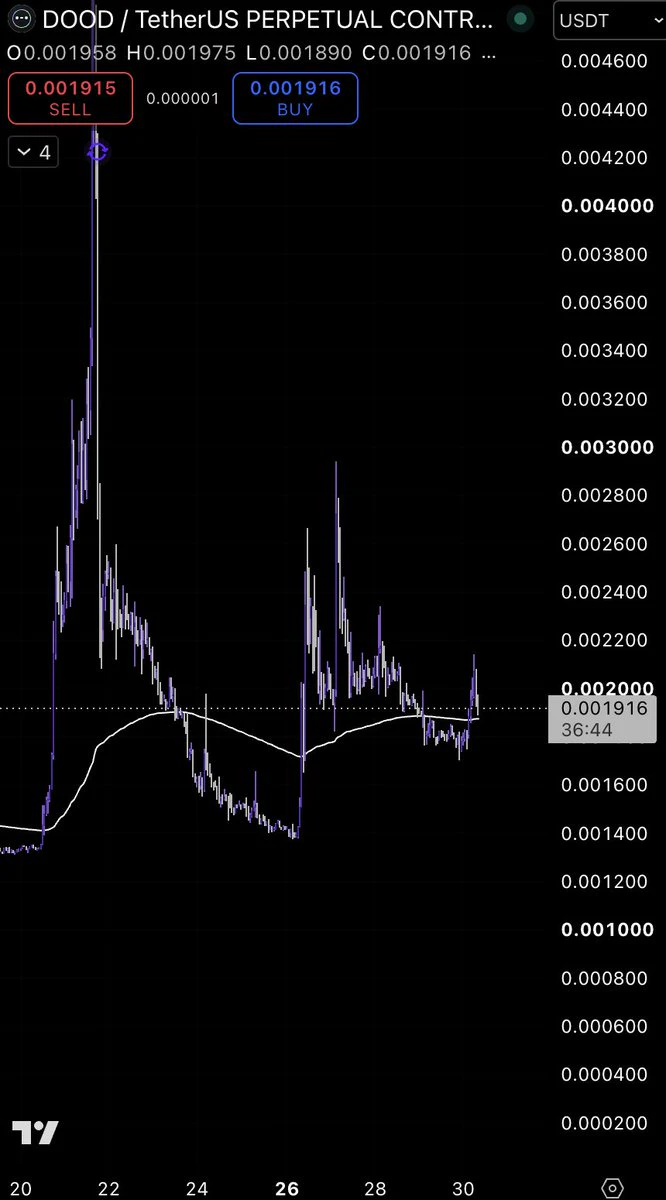
solana:DvjbEsdca43oQcw2h3HW1CT7N3x5vRcr3QrvTUHnXvgV — the most bullish chart on my watchlist right now 👀🔥
After the massive initial spike and deep correction, price has built a new base and is holding above the key moving average.
The recent liquidity sweep and sharp bounce show buyers are stepping in again.
Watching for a clean reclaim of 0.0020–0.0021. If confirmed, the next levels are 0.0023 → 0.0026 → 0.0029.
Still early, but this structure looks very promising. 🚀
post-image
SOL-0.77%
In hindsight, it’s always easy to buy at the right time. Why is live trading different?
When you look at a chart after the price action has played out, the lows and highs are clear. It’s easy to think: why not buy here and sell there?
But when I review a chart, I first cover up the part on the right that hasn’t happened yet, then ask myself: if I could only see up to this point, would I really make the same decision?
For example, if the rules require waiting for a candle to close before confirming a signal, I can’t use its final closing information in hindsight and also assume I would have fil
post-image
Why are the billboards at the airport in Thailand only in Chinese? 🫣
post-image
#HYPERalliesAgainstTheMarket

Hyperliquid Defies the Market: Why HYPE Is Rising While Bitcoin and Ethereum Fall
1. A Different Picture From the Rest of the Market
Yesterday, most crypto traders were watching prices fall, worrying about weakening market confidence and rising uncertainty. But Hyperliquid's native token, HYPE, moved in the opposite direction.
On October 29, HYPE climbed more than 18% during the day, while Bitcoin struggled to maintain its strength. By October 30, the difference had become even more noticeable. HYPE was showing a gain of approximately 16% over 24 hours in one ma
post-image
HYPE+0.24%
$MAGMA In this market, if that shady market maker dares to pump, isn’t that just giving money to the shorts? Probably another one-and-done pump
post-image
MAGMA-0.57%
crypto market update
live-cover
LIVE1,909
“and you believed your coins were safu at the largest cex in the entire world?”
post-image
#美股财报周
📊 **US Earnings Week: Wall Street Faces a Crucial Test as Big Tech Results, AI Investments, and Corporate Profits Shape Market Direction!**
The US stock market is entering one of the most important reporting periods of the third-quarter earnings season. Major companies across technology, artificial intelligence, semiconductors, healthcare, energy, and financial services are presenting their latest financial results.
This earnings week is particularly important because investors are trying to determine whether strong corporate valuations are supported by sustainable business growth. Whi
MSFT-0.39%
AMZN-4.09%
NDAQ+0.00%
INTC-3.60%
XOM+0.60%
$BTC will dump below 70K to wipe out leverage gamblers.
post-image
BTC-0.65%
btc breaks below $75k btc hits a six weeek low as etf falls to a two month low how much longer will
live-cover
LIVE2,154
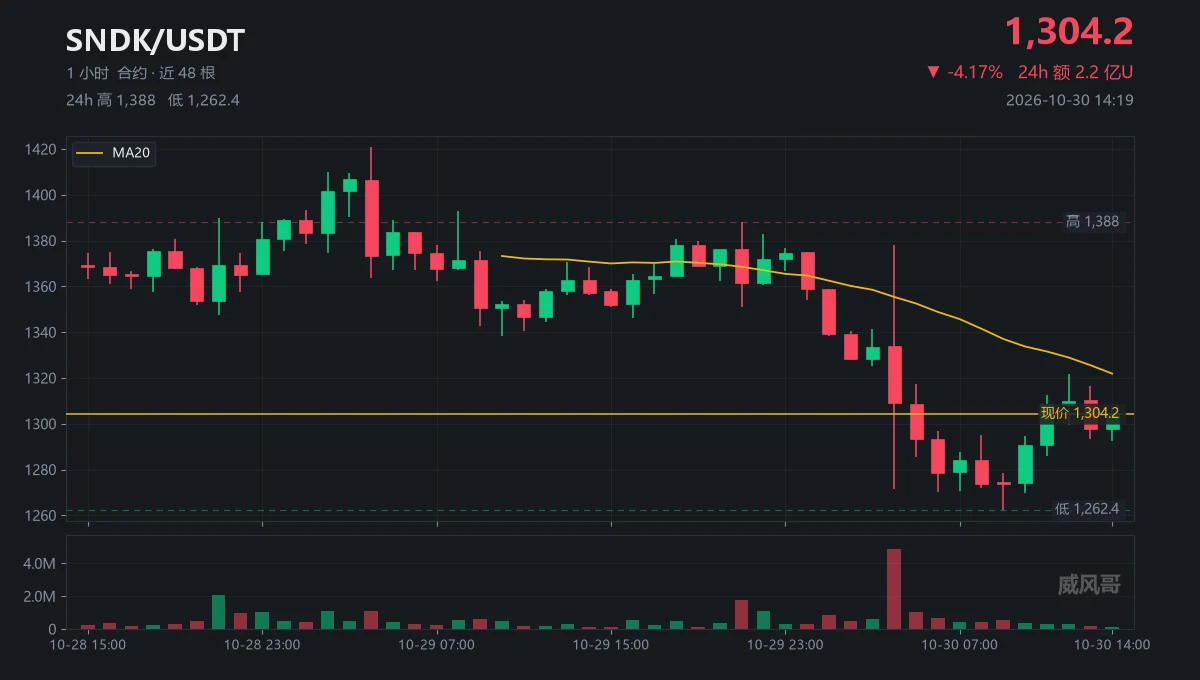
Quick question: If a candle plunges and then recovers, does that count as down or up?
Down.
That $SNDK candle opened at 1334.07 at 04:00 and plunged to 1271.67.
It closed at 1309.16, down less than 2%.
Looks pretty resilient, right?
Wrong. That candle had 4.84 million contracts in volume, versus 590,000 in the previous one.
A low printed on eight times the volume isn't a fat-finger.
The real problem came at 09:00.
1262.36. Nine bucks below the low of the 04:00 candle.
That means everyone who bought the rebound at 1271 was trapped five hours later.
It's now at 1308.23, with the chart closing at
post-image
SNDK-0.18%
#Gate24HNetInflowsRankTop2

Gate Ranks Among the Top Two Exchanges for 24-Hour Net Inflows: What Does This Signal About Market Confidence?
Imagine Where Traders Are Moving Their Money
Imagine checking the crypto market after a busy trading day. Bitcoin and Ethereum are moving, thousands of traders are placing orders, and money is constantly entering and leaving different exchanges. Suddenly, one exchange appears near the top of the global net inflow rankings.
That is the story behind Gate's latest attention for its 24-hour net inflow performance. Ranking among the top two centralized exchang
post-image
GT-2.41%
  • 1
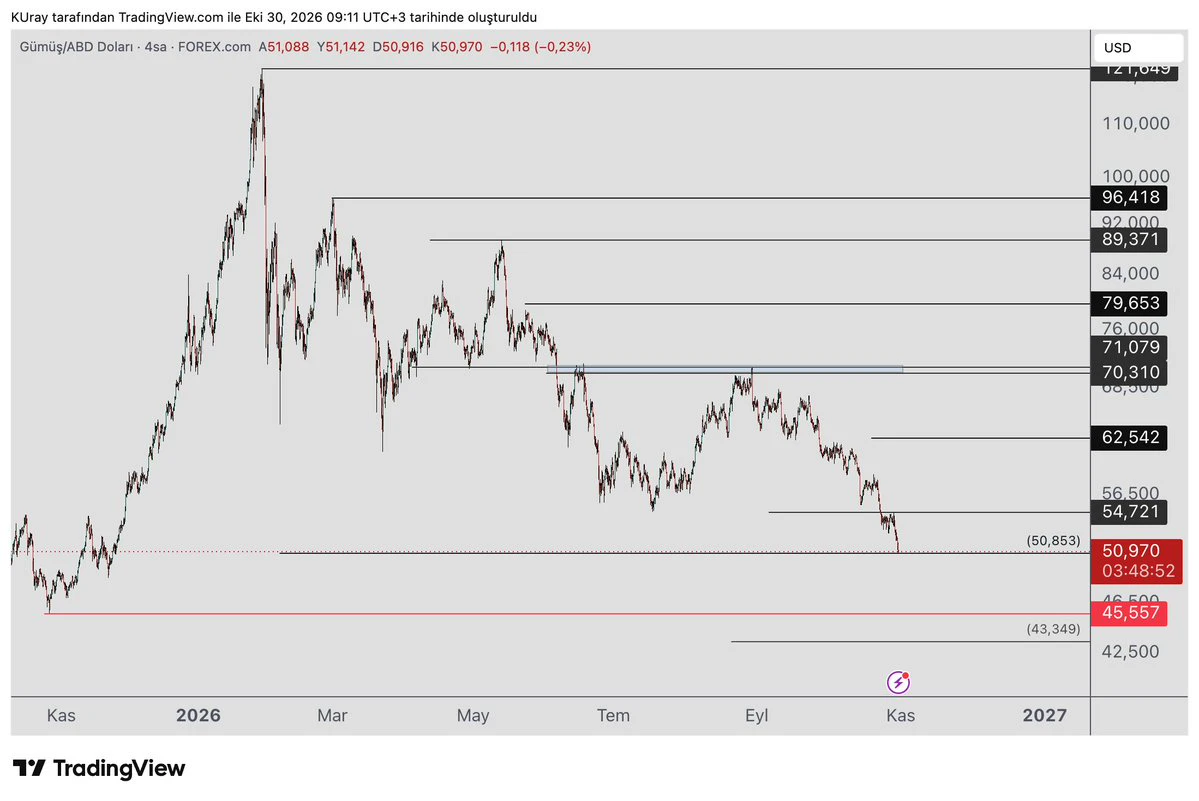
#xag #Gümüş continued to decline and has now reached the support at 50.8. As it fell to this area, it showed RSI divergence on the 4-hour chart and also entered oversold territory on the daily chart. Being at support and showing RSI divergences are signs that we may be in an area where buyers could step in.
Buyers are not strong right now, but if candles with long lower wicks start appearing during the day, a rally could follow.
If the price closes above 54.7 during the rally, further upside is expected. It could test 62 and the 70-71 area. A daily and weekly close above this area would provi
post-image
XAG+0.47%
Load More

Join 40 M users in our growing community

⚡️ Join 40 M users in the crypto craze discussion

💬 Engage with your favorite top creators

👍 See what interests you

Trending Topics

BTCDropsToward77000

52.14k Views39.17k Discussing

$BTC briefly fell below $77,000 and remains under pressure around the $77K zone, with its 24-hour decline still above 4%. With risk appetite weakening and Fed uncertainty rising, where is the next key support after losing $80K?

IntelBeatsEarningsButStockPlunges

2.83k Views579 Discussing

StrategySTRCNears100ParValue

3.56k Views3.97k Discussing

View More