Square
Following
Hot
News
Notifications
Profile
Share your thoughts
placeholder
Article
Oh my, a blockchain scam—the darkest hour, isn't it?$BTC ‌
post-image
BTC-0.65%
  • 1
BTC MARKET UPDATES
live-cover
LIVE1,302
BTC-0.67%
Trenches
FIONA
F
bade
b
FIONA
B34n...pump
Market Cap
$.
Change
.
24h Vol
$.
Holders
.
PIEVERSE
P
bade
b
PIEVERSE
0x0e...25a9
Market Cap
$.
Change
.
24h Vol
$.
Holders
.
mihao
m
bade
b
mihao
4Cxj...pump
Market Cap
$.
Change
.
24h Vol
$.
Holders
.
PROS
P
bade
b
PROS
0x8b...9832
Market Cap
$.
Change
.
24h Vol
$.
Holders
.
CLAUDIA
C
bade
b
CLAUDIA
2j5S...W2ZM
Market Cap
$.
Change
.
24h Vol
$.
Holders
.
The easy thing to do is to give up and walk away from $ICP or your other investments.
But…… Normal doesn’t separate you from the regular normie, i am choosing the hard way!!!!
Holding my $ICP and adding more on every possible opportunity
post-image
ICP-1.14%
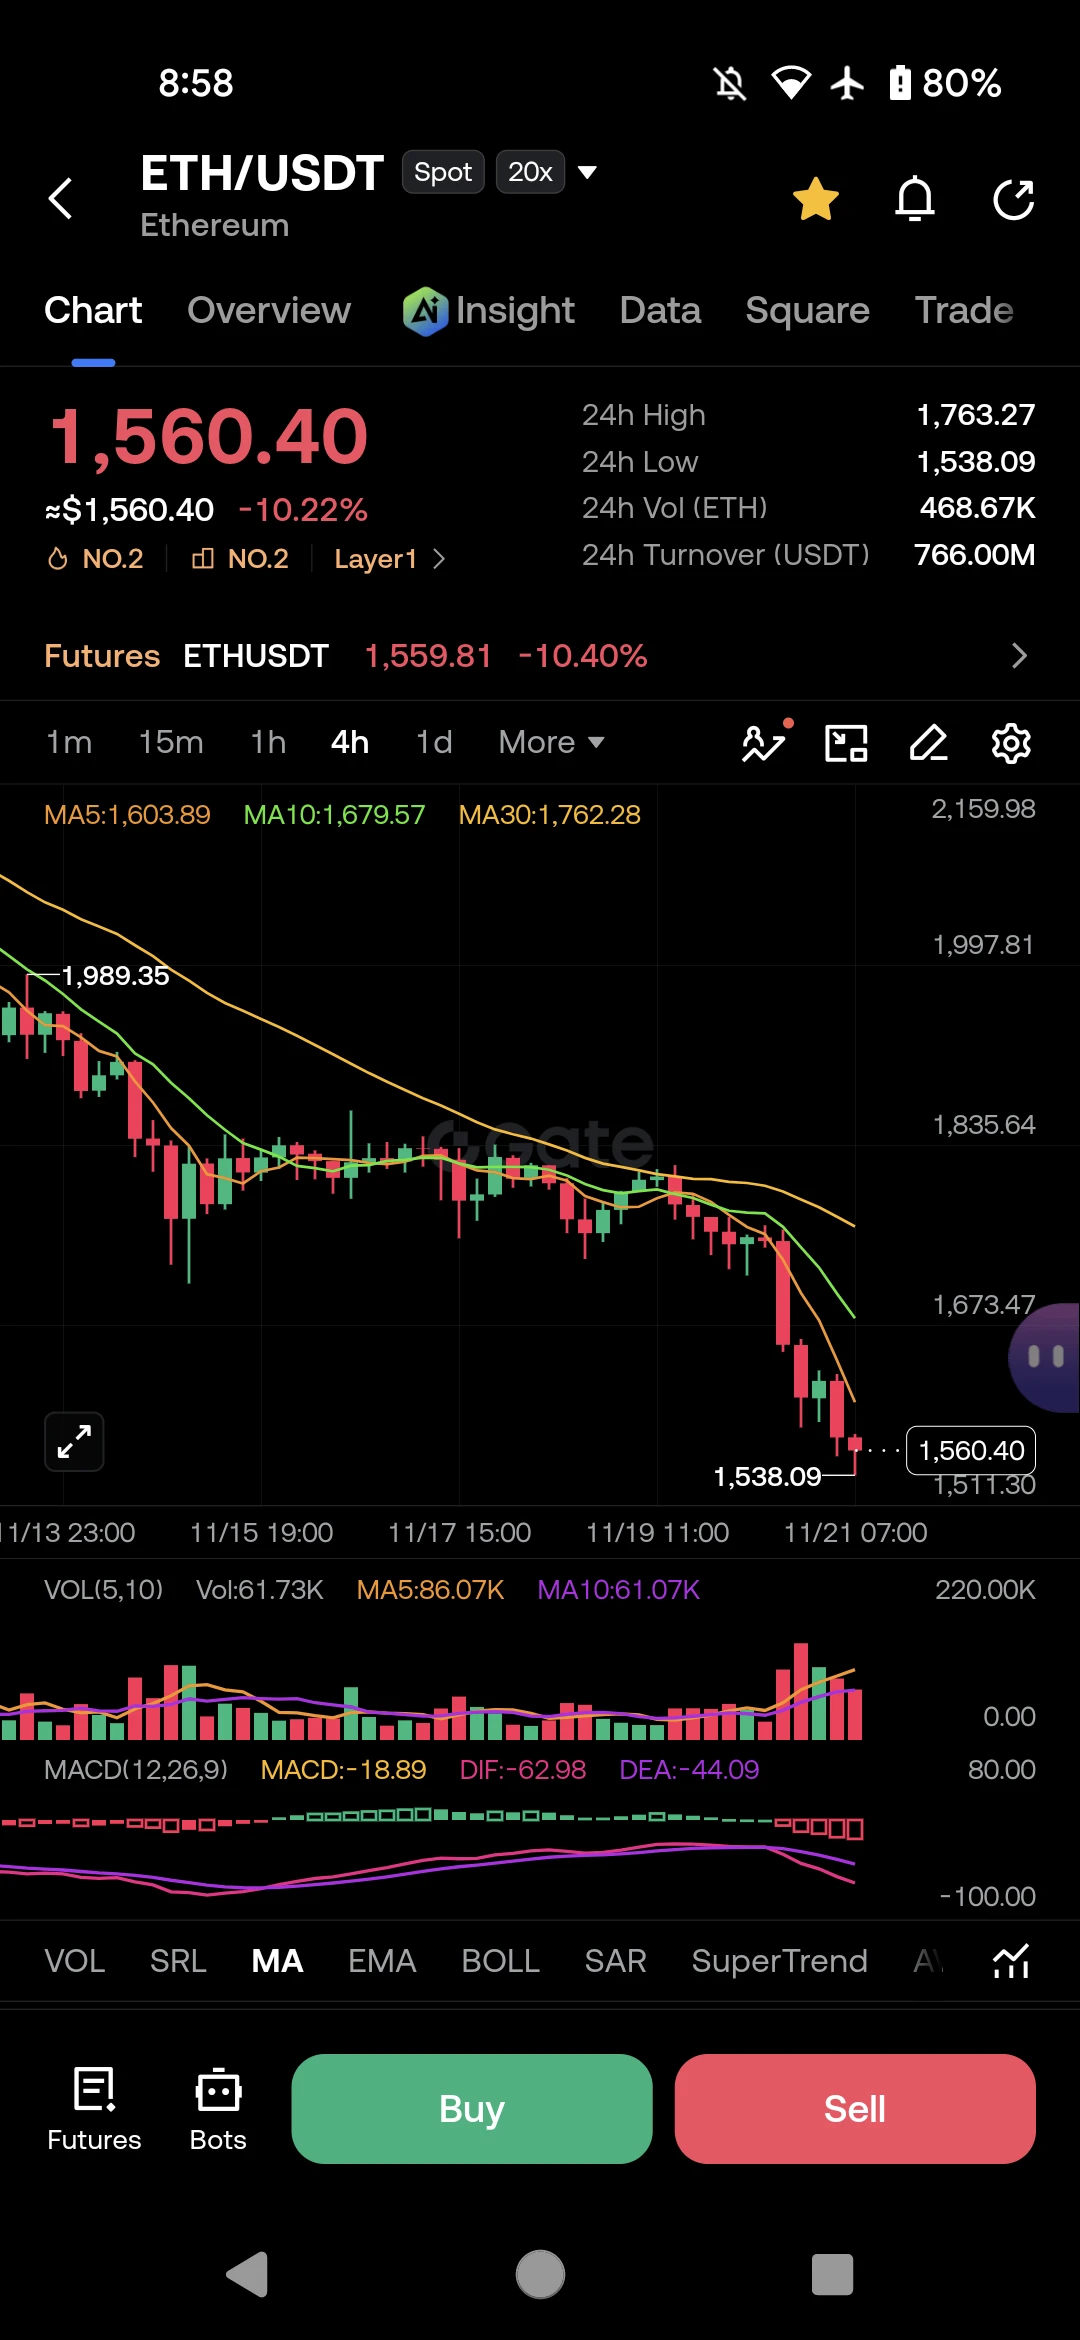
$ETH LIQUIDATION CASCADE: NO BOTTOM IN SIGHT 🩸

Price is in a complete freefall, trapped far below all major moving averages. Sellers are relentlessly dominating the chart with zero signs of a bounce. Fade the weakness!

Trading Ideas Short $ETH
Entry: 1,560 - 1,580
SL: 1,620
TP1: 1,538
TP2: 1,500
TP3: 1,450

trade $ETH here :👇
post-image
ETH-1.23%
  • 3
  • 1
11.21 Market Analysis
Bitcoin strategy reference setup
Short around 57700
Stop-loss: 58500
First target: 56300, second target: 55000
Many people think that once the price falls to the bottom, they can enter and buy the dip, unaware that there is still more room to fall. Bitcoin bears are currently strong, and after the sharp drop, the bulls have been unable to fight back. Overnight, the price tested the previous daily low of 57700 but failed to see a strong rebound. Buying support was weak, and after a slight rebound to 59300, the price came under pressure and fell again.

Keep a close eye on
post-image
BTC-0.65%
ETH-1.23%
$ETH $BTC $SOL
I’m watching the trend over the next 12 years. This price has already reached a support level. The major buy-the-dip opportunity that comes once every four years—miss it, and wait another four years!!
post-image
ETH-1.26%
SOL-0.77%
XRP slipped below $1 for the first time since August, down about 9% in a day to $0.88. Bitcoin fell with it, near $56,000. The whole market keeps sliding together.
post-image
XRP-1.15%
BTC-0.67%
  • 2
  • 1
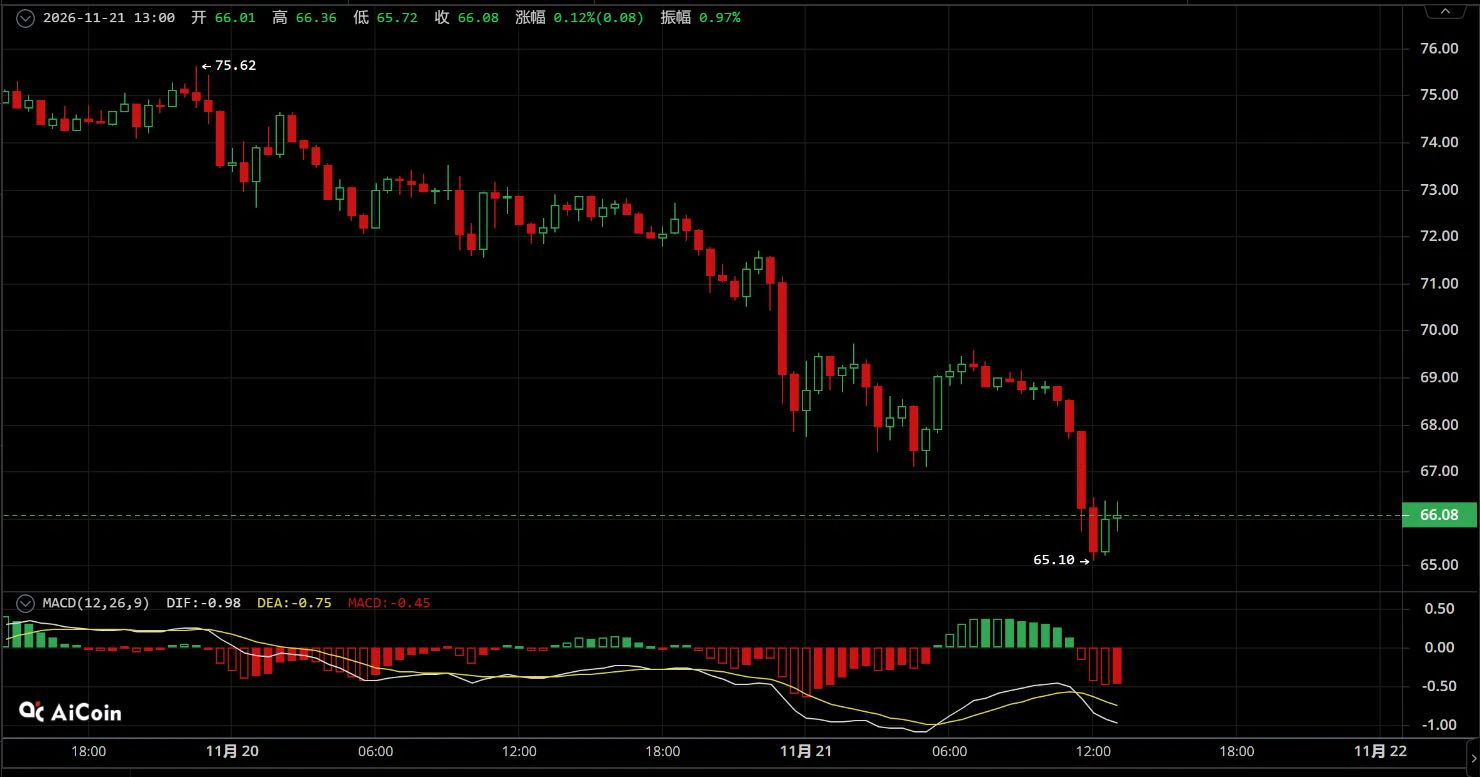
Alongbit | November 21 $SOL One-way plunge with successive breakdowns; go short with the trend amid high volatility

【Trading Plan】
Short entry zone: Set up on a rebound to 66.8-67.6
Stop-loss: Above 68.5
Take-profit targets: First target 65.2-64.8, second target 64.0-63.2

【Core Rationale】
The 30-minute chart shows a one-way downtrend, retreating from a high of 75.62 and breaking through support levels one after another. As a highly volatile altcoin, it has a steeper downward slope and more rapid bearish momentum, making the downtrend very clear.
The rebound after being deeply oversold is ver
post-image
SOL-0.77%
BTC-0.67%
The key thing to watch in this gold move isn’t the price—it’s where institutions are placing their orders. Everyone on Twitter has been talking about key levels lately. Here’s my advice: first ask whether the people drawing those lines have a position. The answer is hidden in the details. What about you?
post-image
GLDX-0.40%
PAXG+0.37%
XAU+0.38%
  • 2
  • 2
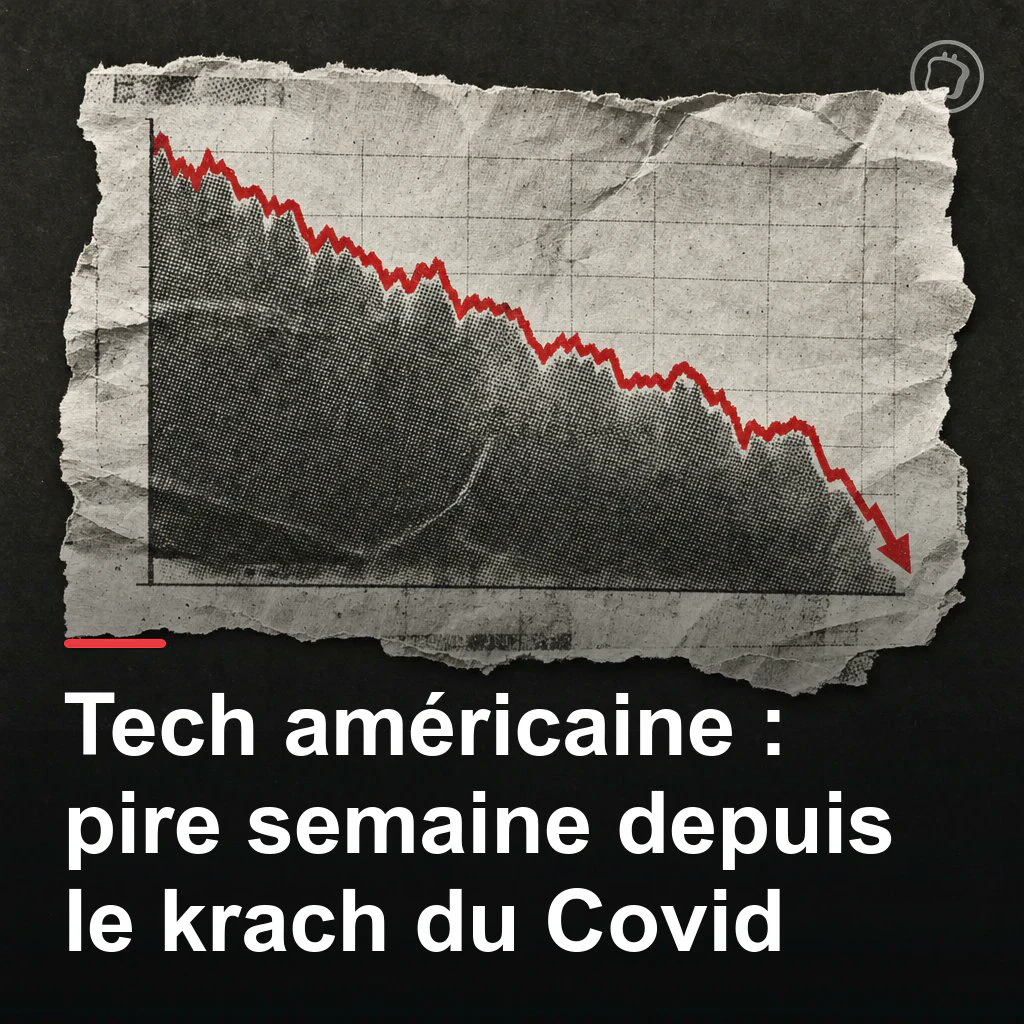
🇺🇸 Worst week since Covid for US tech 📉 The Nasdaq 100 lost 10.4% in 5 sessions, including 5.6% on Friday alone, and the S&P 500 is now in correction territory.
Nvidia is at the heart of the storm. Its stock plunged 14% on Friday, following Reuters reports that US regulators are investigating its accounting practices. The weekly drop reached 23%, the biggest since October 2008.
Since its record high on October 6, the chip giant has lost nearly half its value, with more than $2.5 trillion in market capitalization wiped out in 45 days, amid Jensen Huang's resignation and growing doubts about
post-image
NAS100-4.60%
US500-3.01%
NVDA-13.84%
BTC-0.67%
🚨 Bitcoin ($BTC ) Multi-Timeframe Technical Breakdown: Capitulation Wick or Deeper Correction?

Bitcoin ($BTC) is experiencing intense volatility, trading around the $57,725 – $57,752 zone after a sharp -6.8% daily sell-off. With 24-hour trading volume surging past 172.5K BTC (nearly $10B in USDT turnover), the market has just swept liquidity down to a critical intraday low of $55,105.3.

A multi-timeframe technical breakdown outlines the current market structure, key indicators, and actionable trading zones.

📊 Multi-Timeframe Chart Analysis
1. Macro & Higher Timeframes (1M & 1D)

Monthly
BTC-0.65%
[ NEW STREAMER ] MARKET UPDATE
live-cover
LIVE2,002
BTC-0.67%
Good thing I was quick and managed to get a screenshot this time. 35888,
This is a lucky number. Good luck to everyone who sees it—let's all get rich!
😆
post-image
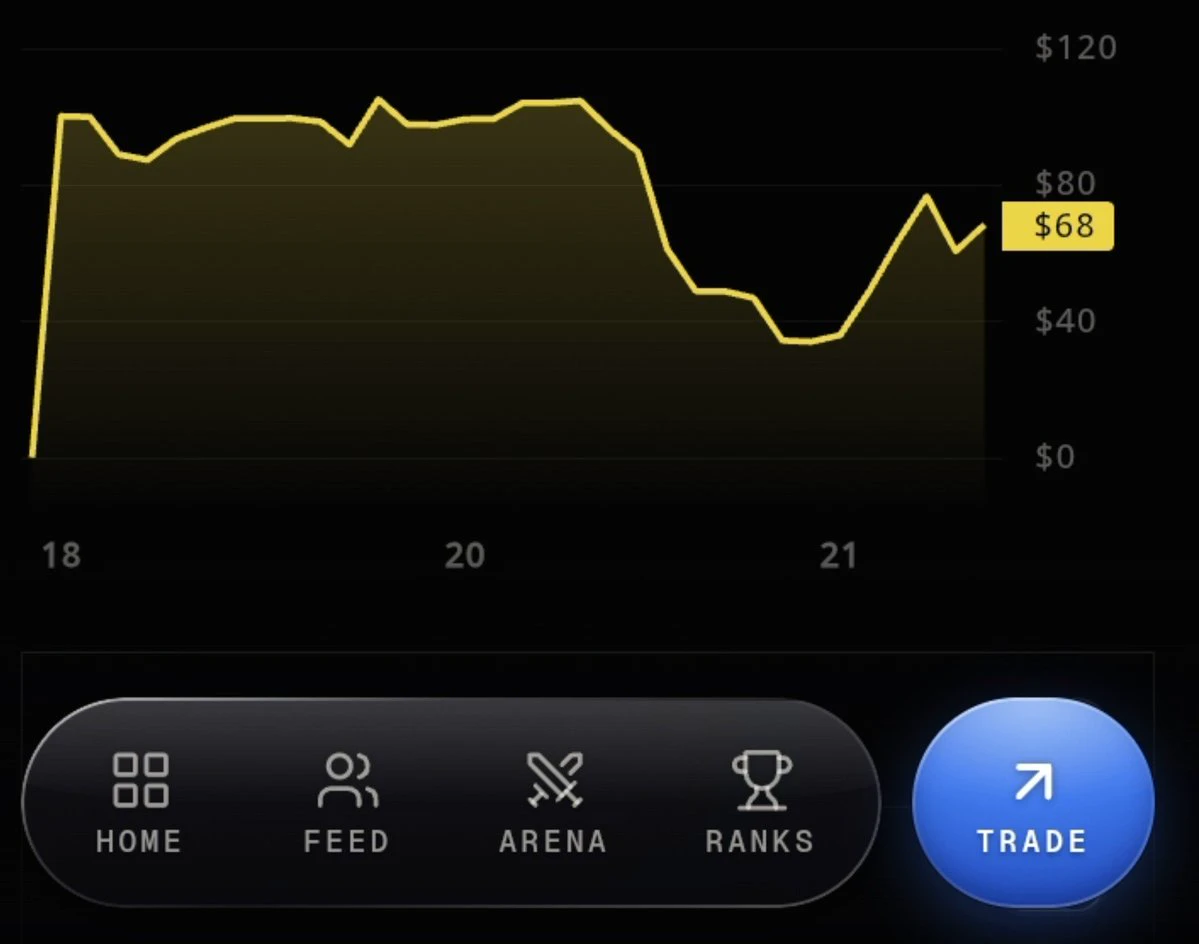
$ETH Now heavily long, then bought at $2,112.55; entry price: $1,639.77 long $ETH 👇
post-image
ETH-1.26%
Came for quick pizza money
post-image
Day 60 of my software engineering journey. 🚀
Today, I stepped into Streamlit and started turning Python code into interactive web applications.
I successfully:
• Set up my environment.
• Launched my first Streamlit app.
• Created and tested my first interactive button.
The goal isn't to rush. It's to understand what I build, one step at a time.
I'm learning to turn ideas into real solutions.
Still learning. Still building. 💻
#Python #Streamlit #SoftwareEngineering #100DaysOfCode
$BCH It repeatedly faced resistance below the moving averages, with selling pressure continuing to weigh on it. The rebound could never hold above key moving averages, so I entered a short in line with the trend. I captured a 341% gain during this leg down, banking $253
.
Today, I'm also keeping a close eye on and ZEC.
$BCH It rallied to the resistance zone but couldn't push higher, so I opened a short. Entry range: 190.55 - 193.68 First target: 183.80 Second target: 177.1 Stop-loss: 199.49
$BCH This sell-off is moving faster than everyone's enthusiasm for going to work on Monday. The trend
post-image
DODOX
DODOXDODOX
Pump.Fun
MC:$2.22KHolders:87
32.76%
BCH+1.05%
$EVAA A spike to 6.57! Whales rake in 31 million—are the big players about to “lock the doors and slaughter the pigs”?

Guys, markets always top out amid euphoria!

On the one-hour chart, EVAA is struggling to rise further at these highs, and the MACD red bars are shrinking.

Whale longs are sitting on over 31 million in unrealized profits, but the liquidation map shows the short-side fuel above is nearly exhausted, while huge long positions are stacked around 3.1 below, waiting to get liquidated. The big players’ intent is obvious: first fake a breakout above 6.45 to lure in buyers, then reve
EVAA-0.42%
  • 2
Load More

Join 40 M users in our growing community

⚡️ Join 40 M users in the crypto craze discussion

💬 Engage with your favorite top creators

👍 See what interests you

Trending Topics

BTCBreaksBelow60K

2.1M Views29.1K Discussing

BTC fell below $60,000 on November 20 for the first time since July, alongside a tech stock selloff and broader pressure on risk assets. Will $60K become resistance, or can BTC quickly reclaim it? What price or volume signals would convince you that selling pressure is easing?

GateDirectIPOPhase3ANTAllocates92100Shares

739.5K Views4.8K Discussing

NvidiaDropsNearly14Percent

310.5K Views7.5K Discussing

View More