Square
Following
Hot
News
Notifications
Profile
Share your thoughts
placeholder
Article
Why do some trading strategies make money in backtests but fail to cover trading costs in live trading?

A trading strategy shows profits every month in backtests.

But once you start trading for real, you find that your account returns are far below expectations. You may even predict the market direction correctly, yet your balance keeps falling.

The problem may not be that you misread the market, but that you underestimated trading costs.

Profits in a backtest are only theoretical results. Returns after deducting real trading costs are closer to the money you actually get to keep.

I. Trad
post-image
Checking in for week 77. Lost 10,000 this week; toward the 1.5 million target (50+100 plan): -287,000 in market value -200,000 withdrawn +200,000 deposited = 1.213 million.
Trenches
ZIG
Z
bade
b
ZIG
0x8c...1145
Market Cap
$.
Change
.
24h Vol
$.
Holders
.
BTC
B
bade
b
BTC
C5xp...pump
Market Cap
$.
Change
.
24h Vol
$.
Holders
.
STONK
S
bade
b
STONK
6GmA...UNgx
Market Cap
$.
Change
.
24h Vol
$.
Holders
.
ANSEM
A
bade
b
ANSEM
9cRC...pump
Market Cap
$.
Change
.
24h Vol
$.
Holders
.
CLAUDIA
C
bade
b
CLAUDIA
2j5S...W2ZM
Market Cap
$.
Change
.
24h Vol
$.
Holders
.
#美国10月CPI即将公布 Is U.S. CPI set to stir things up again tomorrow night?

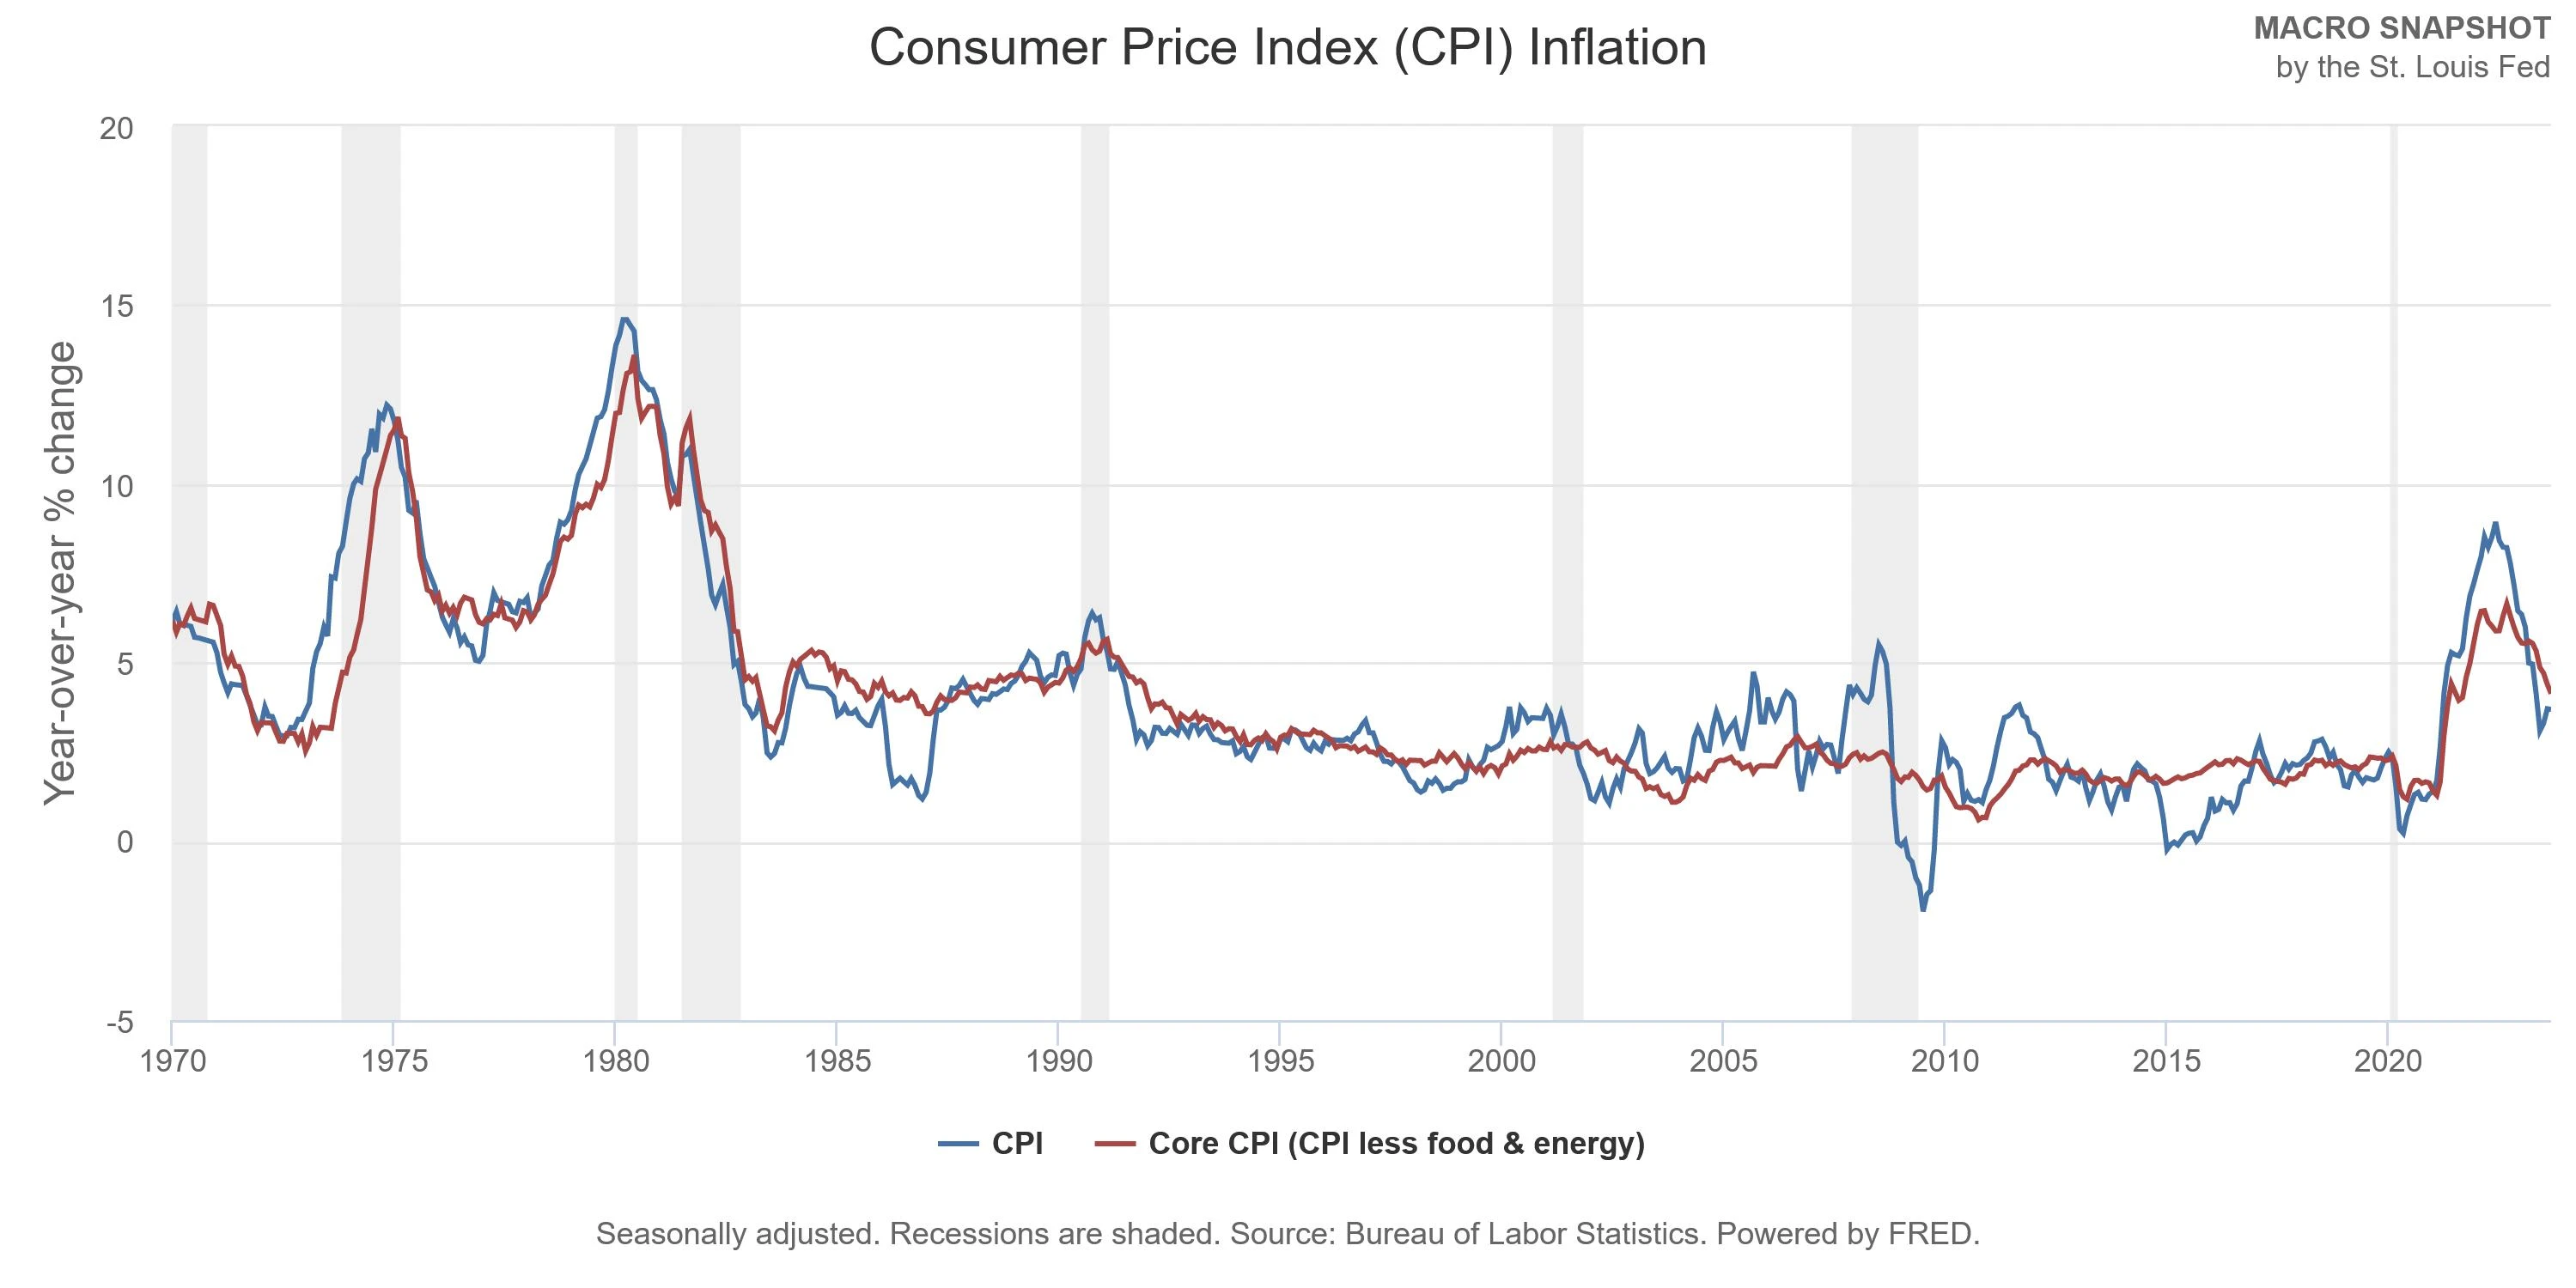
This isn't just an ordinary data release. On November 6, U.S. nonfarm payrolls increased by 165k, far exceeding expectations, and bets on a December rate hike briefly surged to around 80%.

Even more troubling is oil. Middle East tensions keep flaring up, and energy costs remain high. U.S. CPI rose to 3.7% year over year in September, and the market expects it to climb further to 3.9% in October.

Put simply, people aren't worried that inflation hasn't fallen—they're worried the Fed will keep tightening.

This kind of situa
post-image
CPI tomorrow night—how will BTC move?
BTC will mount a comeback on CPI
Retesting the bottom?
1 Participants
Ends In 23 Hour
BTC-0.65%
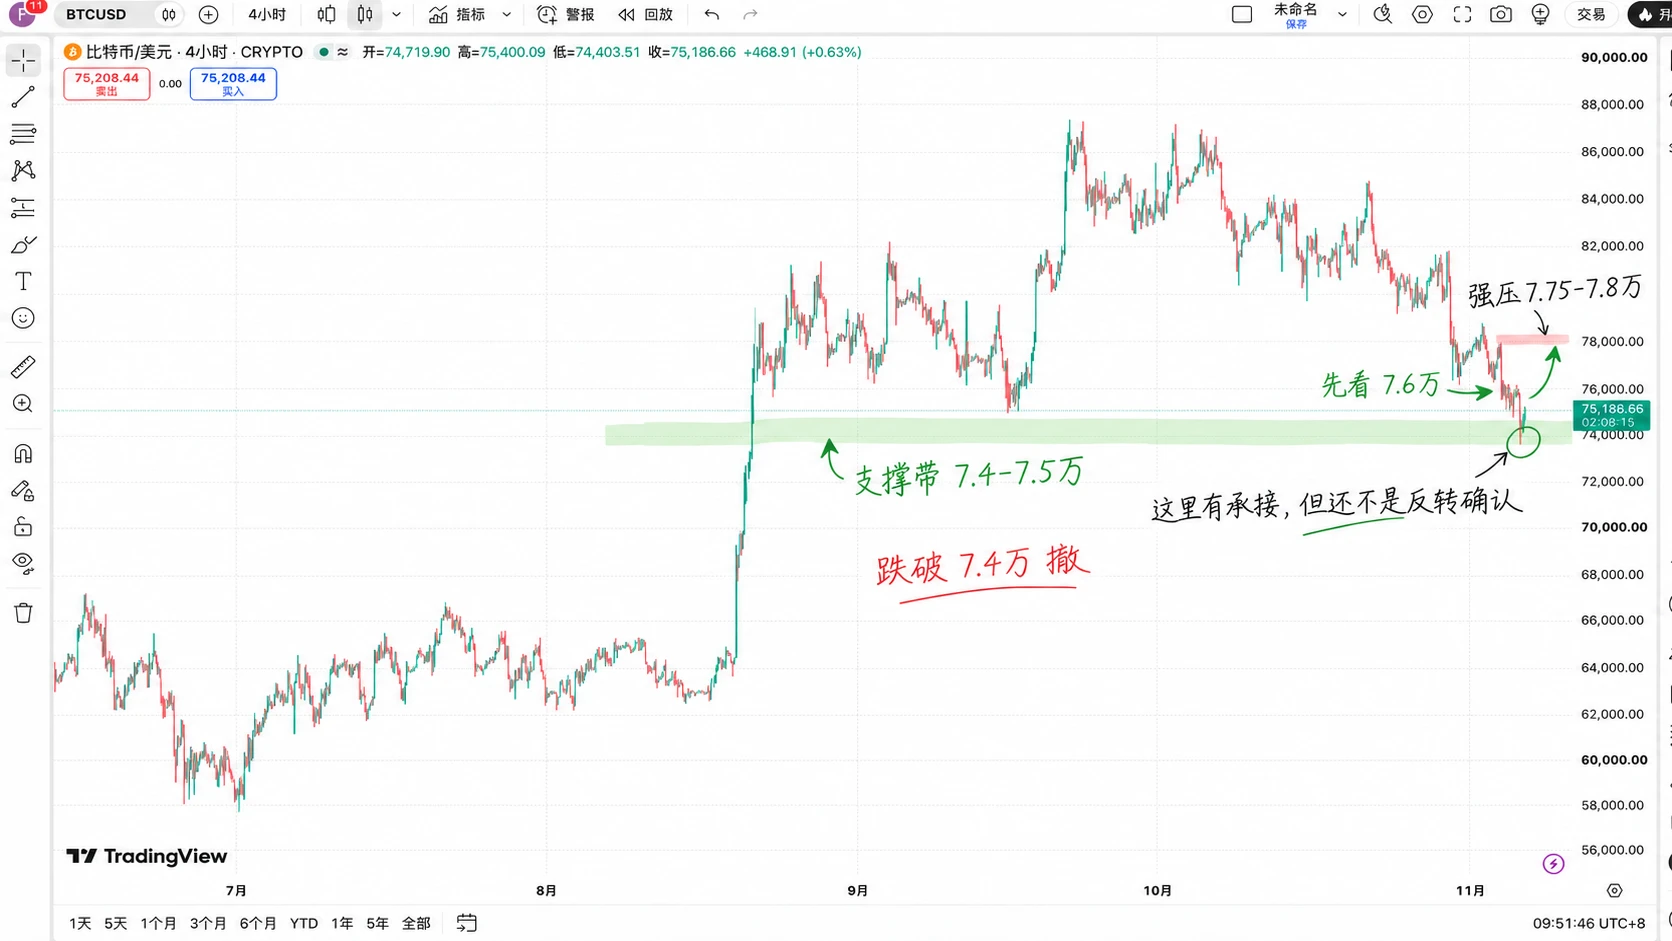
#BTCETF资金持续流出 Wow, BTC has fallen this far. Is 75k still a good level to buy the dip?

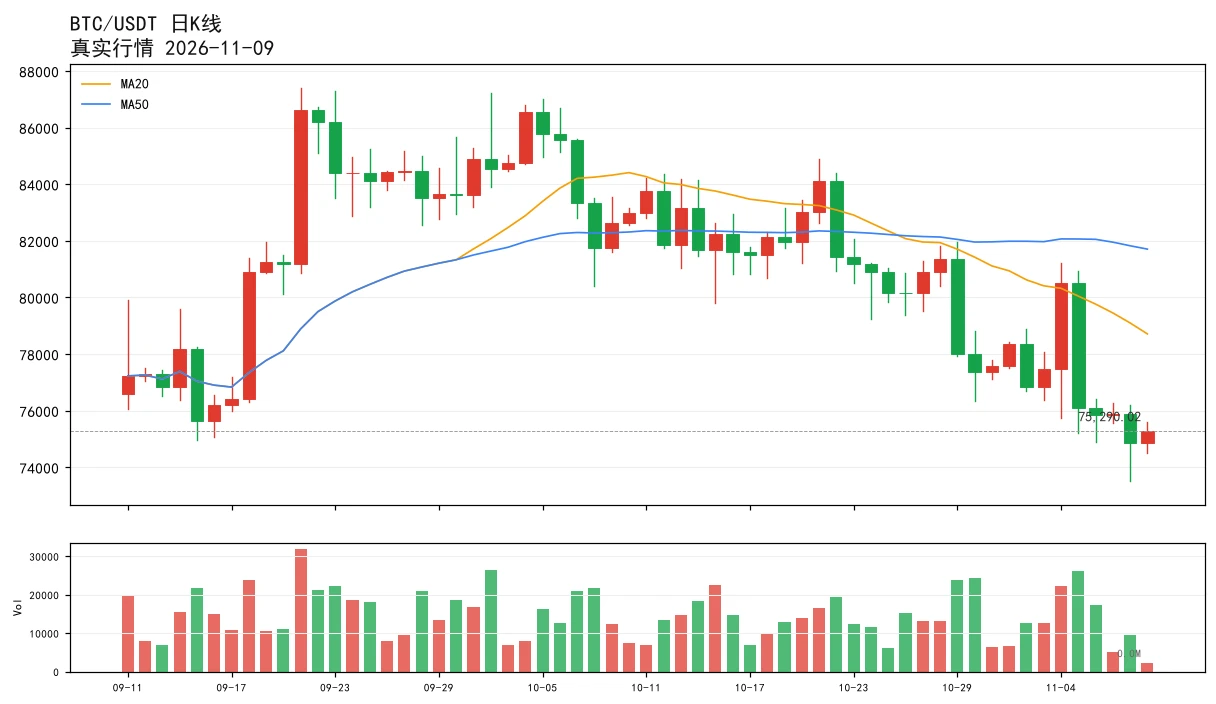
First, look at the chart. $BTC It plunged from around 87k all the way to 74k, breaking through support at 80k and 78k one after another. Now it’s finally bounced back to 75k, and people are already calling for the bull market to return.

So, has it really bottomed this time?

Honestly, I’m not that optimistic, but there’s no need to be overly pessimistic either.

There’s a detail on the 4-hour chart: BTC just broke below 74k, then bounced back above it, which shows there are still buyers below. But there’s s
post-image
At the 75k level
Golden buying opportunity
The starting point of the next downturn
1 Participants
Ends In 22 Hour
BTC-0.65%
  • 2
How can you tell whether a trading strategy has a genuine statistical edge rather than making money through luck?

In trading markets, one of the easiest mistakes to make is treating profits as evidence that a strategy works.

A string of profitable trades could mean the strategy has an edge, or it could simply mean the market happened to be favorable to it.

So how can you tell the difference?

The key is not to look at how much a few trades made, but to determine whether the strategy has a repeatable positive expected return after costs under sufficiently reasonable testing conditions.

I. F
post-image
How can you tell whether a trading strategy truly has a statistical edge rather than making money by chance?

In trading, one of the easiest mistakes to make is treating profits as evidence that a strategy works.

A run of profitable trades could mean the strategy has an edge, or it could simply mean it happened to encounter favorable market conditions.

So how can you tell the difference?

The key is not how much a few trades made, but whether the strategy has a repeatable positive expected return after costs under sufficiently reasonable testing conditions.

1. First, understand what a real
post-image
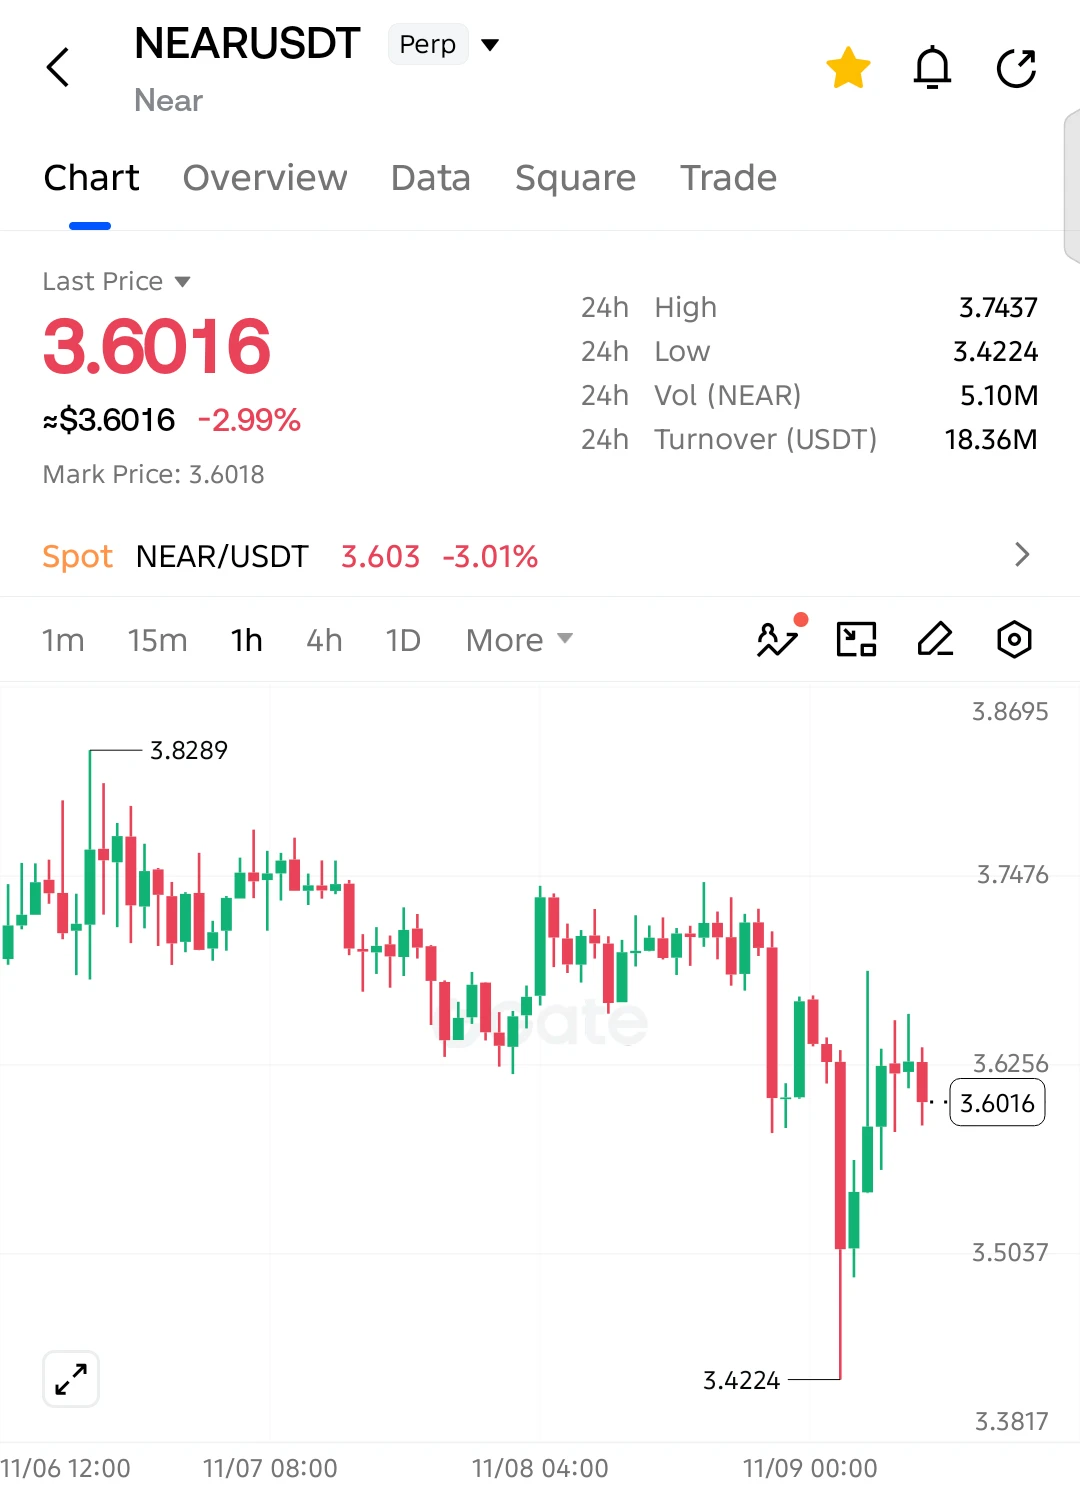
$NEAR SHORT SETUP — SELLERS TAKING CONTROL AGAIN!

$NEAR is down 2.99%, and the recent recovery is facing rejection near resistance. Bears are defending higher levels, putting another downside move in focus!

Entry: 3.6016
SL: 3.6750

TP1: 3.5037
TP2: 3.4600
TP3: 3.4224
Final Target: 3.3800

$NEAR continues forming lower highs as sellers maintain pressure. The bounce from 3.4224 has struggled to break above resistance near 3.6256. If buyers fail to reclaim that level, selling pressure could push price back toward 3.5037 and potentially 3.4224.

Invalidation: A sustained recovery above 3.6750 w
post-image
NEAR+1.17%
Apple is also stepping up its AI arms race! The CEO is personally urging the software team, and Siri
live-cover
LIVE1,768
On September 24, I started viewing NBIS (Nebius) as showing “wealth growth”; it was then at 243. By today, October 9, “wealth growth” had reached a low of 113.3. It reached the target of 115.9. The “wealth growth” was 53%. Not bad. Will there be more “wealth growth”? I share my thoughts in image 2. [NBIS is an AI computing center; I haven’t been optimistic about it since September 24.] ​​​$NBIS ‌
NBIS-3.14%
🔹Democrats Sweep Congress: Is a Major Shift Coming for Crypto? Tighter SEC Oversight and Prediction
live-cover
LIVE1,730
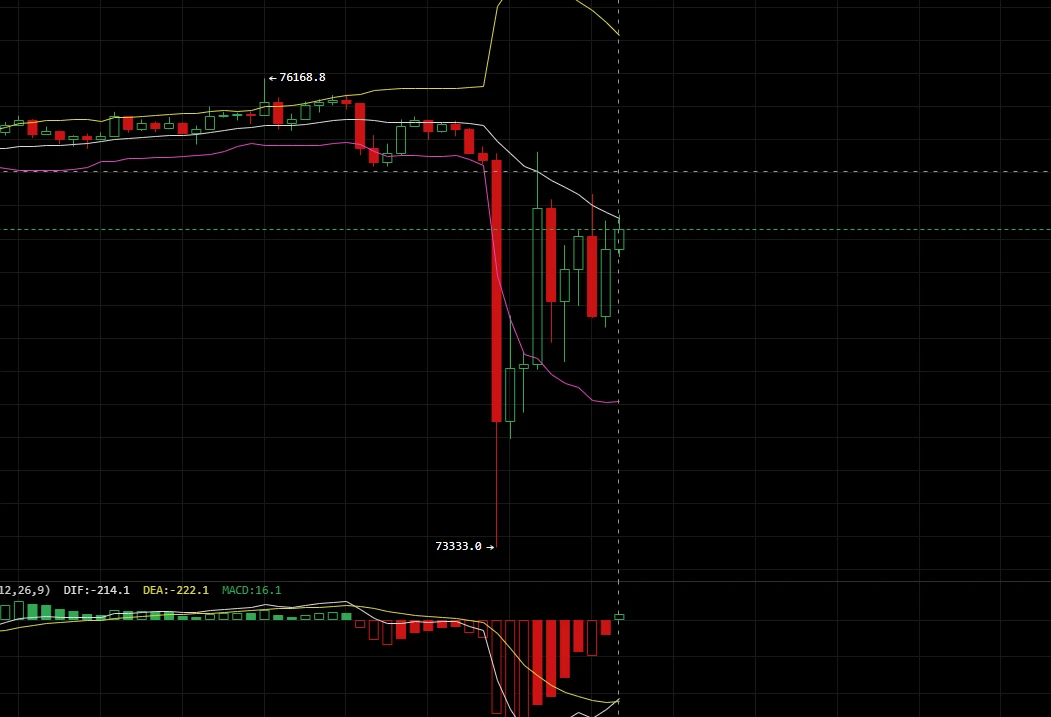
11.9 BTC Trading Strategy

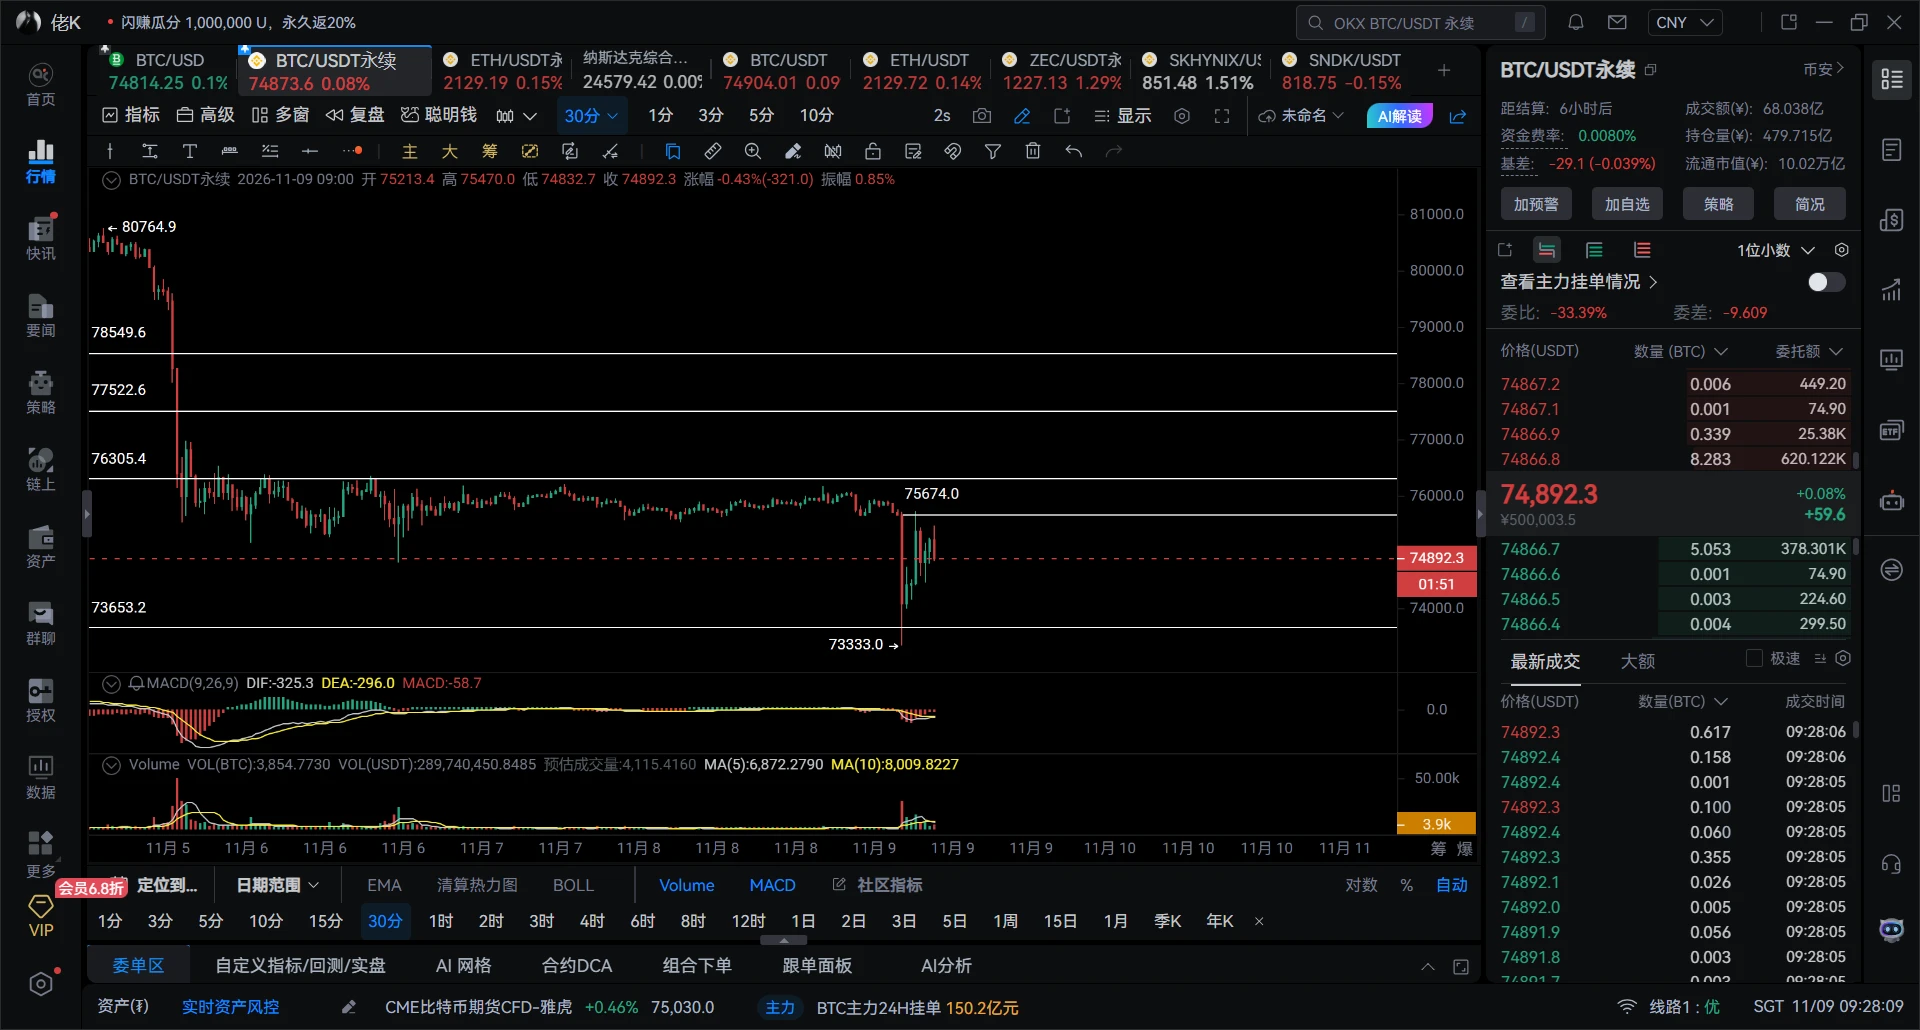
  BTC is showing an oversold recovery after a sharp drop. It briefly broke below the lower Bollinger Band, but the price has now rebounded to around 75000 and moved back above it. The MACD bearish histogram is beginning to narrow, indicating near-term technical rebound potential. However, selling pressure remains around the middle Bollinger Band and the previous consolidation range, leaving BTC in a low-level consolidation and recovery phase after the sharp drop.

  Entry range: Go long near 75000 (a retest confirmation level after the rebound from the sharp drop)

 
post-image
BTC-0.65%
11.9 $ETH Today's Outlook
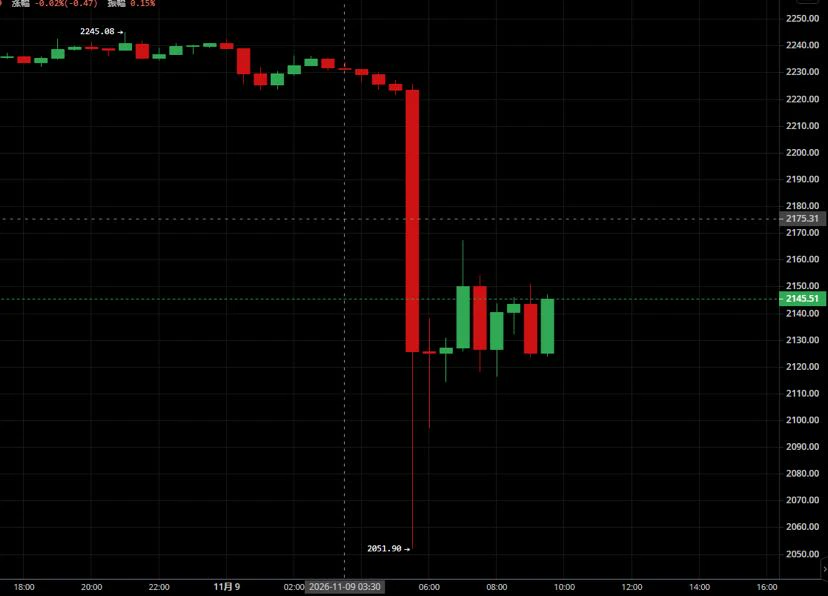
After an overnight wick down to 2051.9, an oversold recovery rally began. The broader bearish trend remains intact, and the rebound is only a short-term correction; downside momentum remains once resistance is encountered. The main approach is to sell rallies, while support levels may offer opportunities to take small short-term long positions.
#70%山寨币跌破200日均线
Support: 2100-2110, 2050-2060
Resistance: 2170-2180, 2220-2230
Short strategy: Scale into short positions if the price rebounds to the 2170-2180 range, with a stop-loss at 2230. The first target is around 2110;
post-image
ETH-1.26%
11.9 BTC Market Analysis
Bitcoin monthly hidden divergence; the weekly chart shows a MACD death cross (watch for inversion risk)
5-day/3-day charts: short at highs 2-day chart has fallen below zero This move is mainly a door-shaped selloff driven by the 6/8-hour below-zero rebound 1-hour hidden divergence; intraday, wait for a 15/30-minute setup to form before trading
Intraday resistance: 75674 76300 76800
Intraday support: 74476 73653 72778
‍$BTC
post-image
BTC-0.65%
What exactly is the difference between isolated and cross margin? Why can the same loss have a completely different impact on your entire account?

In crypto futures trading, many people focus on leverage, entry prices, and stop-loss levels, but overlook an equally important question:

Are you using isolated margin or cross margin?

These two margin modes affect how margin is allocated, how account funds are used to bear risk, and how widely losses from a position may affect your account.

The core difference between isolated and cross margin is not that one is necessarily safer than the other
post-image
Last night’s nonfarm payrolls pushed crypto and the Nasdaq down together. The US added 165k jobs in October, far above market expectations of 65k, the unemployment rate rose back to 4.1%, and the probability of a Fed rate hike in December was pushed to around 77%.

The same macro factors hit both markets. BTC fell from above $80k back to $75k, touching a 60-day low; the Nasdaq dropped 5.5% in a day, Nvidia tumbled 9%, and the Philadelphia Semiconductor Index fell 12% in a single day.

Crypto has been priced on a dual narrative of AI and liquidity this cycle. But AI capex expectations were firs
post-image
NAS100-0.07%
BTC-0.67%
NVDA+2.80%
SPY+0.06%
$JCT $JCT is seeing strong selling pressure 📉Open a short (sell) position. Target: 0.0070
post-image
JCT-3.26%
The result made getting up early to watch BLG face legendary T1 in this BO5 worth it—and I even got to catch some tea about Dahuang along the way.

First of all, congrats to BLG for finally conquering this mountain! Looking forward to their showdown with GEN for the Bauhinia crown next week. They’re on a legendary run, taking the championship after going through four teams.

So, Jensen Huang has an affair and crypto takes a hit? Is the crypto market made of glass or what? So fragile?
Why Is the Liquidation Price Different from the Market Price You See?

You open your trading app and see that BTC’s latest traded price has not yet fallen to your liquidation price.

But your account’s risk warning has already changed, or your position has even been forcibly liquidated.

Why does this happen?

One important reason is that in contract trading, the market price you see, the price the platform uses to assess liquidation risk, and the price used as a reference for the broader market may not be the same.

Understanding the differences between the latest traded price, mark price, an
post-image
BTC-0.65%
Why can some people follow the same trading signals consistently over the long term, while others keep changing their plans at critical moments?

Many traders lack neither indicators nor trading strategies.

They know where to enter, where to set a stop-loss, and how to manage their position size.

But once they actually enter the market, everything changes.

When they're in profit, they worry about giving it back and close their positions early.

When they're losing, they refuse to admit they were wrong and widen their stop-loss without authorization.

When the market is rising, they fear mis
post-image
Load More

Join 40 M users in our growing community

⚡️ Join 40 M users in the crypto craze discussion

💬 Engage with your favorite top creators

👍 See what interests you

Trending Topics

USCPIDataIncoming

22.8k Views1.72k Discussing

The U.S. October CPI report will be released on November 10 at 8:30 a.m. ET. September CPI came in at 3.7% year over year, and markets will be watching closely for signs that inflation is cooling, especially in core CPI. A softer-than-expected reading could strengthen rate-cut expectations, while hotter inflation may pressure risk assets through higher Treasury yields and a stronger dollar. How do you think this CPI print will move $BTC, U.S. stocks and gold?

BTCFlashCrash

22.73k Views66.04k Discussing

USAIStocksHitHard

31.41k Views3.75k Discussing

View More