Square
Following
Hot
News
Profile
Share your thoughts
placeholder
Article
U.S. equities fell sharply on Thursday, with technology and semiconductor shares leading the decline after a Financial Times report indicated that OpenAI's annualized revenue was approximately $20 billion lower than previously signaled. The ChatGPT developer told investors its annualized revenue was nearing $50 billion at the end of September, below the $70 billion figure that had circulated in media reports the prior month. The discrepancy was attributed to differences in how sales to cloud partners were calculated.
The report intensified concerns that the massive spending on artificial intel
post-image
US30+0.02%
NAS100+0.05%
SNDK-4.91%
NVDA-2.86%
MU-4.83%
  • 11
  • 3
Even Ultraman gets tired, and Sun Wukong also has to make a living.
Many people chase after seeing a large bullish candle, and assume there is still room to rise when RSI has not crossed 70—this is a typical misreading of “strength” as “safety.” $RLC is in exactly this situation now.
Technically, $RLC is currently priced at 0.8609. MA5=0.90236 has crossed above MA20=0.778535, confirming a bullish moving-average alignment and a moderately bullish medium-term structure. However, the price has fallen back below MA5, and short-term momentum has weakened somewhat. The MACD histogram remains at +0.01407, with bullish momentum not yet reversed, but caution is warra
post-image
RLC+27.88%
SOL-4.49%
MINA-17.02%
Many people see the 16% drop in 24 hours and rush to buy the dip, thinking “after falling this much, it should rebound”—but this treats the decline as a margin of safety. The real risk is that a negative funding rate during a downtrend does not necessarily mean shorts are overcrowded; it could also indicate a cascading liquidation of longs.
$ORC Current price 2.321, MA5=2.3046 is clearly below MA20=2.5814, forming a bearish moving-average alignment; although RSI=32.1 is close to oversold, the MACD histogram at -0.0335 remains in bearish expansion, while the lower Bollinger Band at 2.1994 is th
post-image
SKL+16.68%
crypto market update sol
live-cover
LIVE54
Took a small loss in the choppy market, but this one-way move brought us all the way back. Caught the rebound too. Take it slow and keep it up.
post-image
I was just about to go to the forum and rant, but then I saw my balance. Never mind—the market is always right.

A few days ago, when it repeatedly pushed higher in the afternoon, the overhead resistance above $CAP was right there. Every push upward fell just short, volume failed to follow, and there was no one to take the offer even when it moved up—the bull trap smell was too strong. I warned at the time that it was facing resistance at the highs, so don’t rush to enter.

Shorting all the way from 0.08720 to 0.0733, with floating profit at +313.18%, this short trade delivered the answer.
post-image
CAP+1.56%
XRP-2.47%
ETH-3.31%
🏦 The Fed's Masterplan: How Policy Expectations Are Reshaping Crypto & U.S. Stocks 🚀
The financial world is laser-focused on the Federal Reserve. As macroeconomic data shifts, expectations around interest rate policies are dictating the flow of trillions of dollars. Whether you are trading Bitcoin, altcoins, or the S&P 500, understanding the Fed’s playbook is the ultimate cheat code for navigating the market.
Here is exactly how Federal Reserve policy expectations drive both Crypto and U.S. Equities—and what it means for your portfolio. 👇
1️⃣ The Macro Engine: Liquidity is King 💧
At its co
post-image
BTC-1.74%
ETH-3.34%
XAU+0.56%
NAS100+0.05%
  • 4
Would you still dare to go all-in on an asset with 52.7% volatility?
$MET The current 30-candle range is as high as 52.7%; this is not an opportunity but a meat grinder. The current price is 0.444, with MA5=0.4381 still below MA20=0.46552, the MACD histogram at -0.009498 maintaining a bearish bias, and RSI=51.8 in the neutral-to-weak zone. The Bollinger lower band at 0.407268 is the only meaningful support reference. But note one key divergence: the funding rate is -0.0324%, meaning shorts are paying, which indicates that short positioning is not light and provides fuel for a short-squeeze re
post-image
MET-3.96%
CTSI+12.09%
TIA+13.98%
I originally just wanted to mooch a free breakfast, but the market handed me a short that paid for six months of dumplings. A few days ago, while the market was moving sideways at the highs in the afternoon, $ETH ’s upward pushes were getting weaker each time, and the volume failed to follow. So I flagged the short setup around 2735.31. The pressure at the highs was simply too obvious—there were no buyers on the way up. If you don’t short at a level like this, are you really going to wait until it falls to chase it?

The market gave us the answer afterward, with the price sliding all the way
post-image
ETH-3.31%
SNDK-4.90%
ADA-7.69%
This isn’t a rebound—it’s CPR for my empty account, right? No, a long-position account; either way, I woke up to see the account dancing.
When I checked the chart right after lunch, $ZZZ pulled back to 0.00751 and held, buying pressure strengthened, and funds quietly entered. I didn’t wait for a big bullish candle and signaled Open Long. The view was that it was bottoming out without breaking down, so it was worth taking. Stay bullish and hold if it doesn’t break; exit if it does.
The afternoon gave us the answer directly: the price reached 0.0103, with a return of +370.06%. Feels good, broth
post-image
ZZZ+25.15%
BTC-1.70%
SNDK-4.90%
crypto market update
live-cover
LIVE14
If you need 8K+ followers
Say YEs 🛎
I will boost your page. 🌸🌏
post-image
PUMP hit by reverse-engineering access revocation -7.9%, rebounds +2.41%; I’m bullish
$PUMP Access was revoked through reverse engineering last night; current price 0.00568, 24h -7.9%, yet the chart didn’t collapse: after the incident, it moved from 0.005557 to 0.005691, rebounding +2.41%. I’m directly bullish at this level.

The daily structure remains intact—RSI 65.2 is strong, MACD has remained above the zero line for 11 days since the bullish crossover, MA7 has stayed above MA30 for 14 days, and the short-term moving averages remain in a bullish alignment.

Funds haven’t fled either—OI v
post-image
PUMP-6.98%
$PUMP is trending — but the real test is positioning.
A large trader reportedly closed a 1B $PUMP long at a ~$265K loss, then opened a 1.5B PUMP short with 5x leverage.
Volume remains elevated, so I’m watching whether this is a leverage flush or deeper distribution.
$0.0052 → key support
$0.0058 → reclaim zone
Above $0.0058 = recovery gains credibility.
Below $0.0052 = structure weakens.
Shakeout or breakdown?
#PUMP #PumpFun #Solana
post-image
PUMP-6.98%
  • 1
The entry position was not good; only 6 of the 10 $ETH were bought. Readjust and place a long order at 2426. If given the opportunity, get in; if not, let it go. Expect a short-term rise. After all, Bitcoin has not broken below $80k, and it will most likely test $78k once; in an extreme case, it could also test $74k, and only then will the bull market turn upward. It just fell today, so various indicators need some short-term recovery. In the short term, we can consider a small long position, initially targeting 2550-2560, which is relatively steady and conservative. ‌
ETH-3.31%
$MSTR ‌
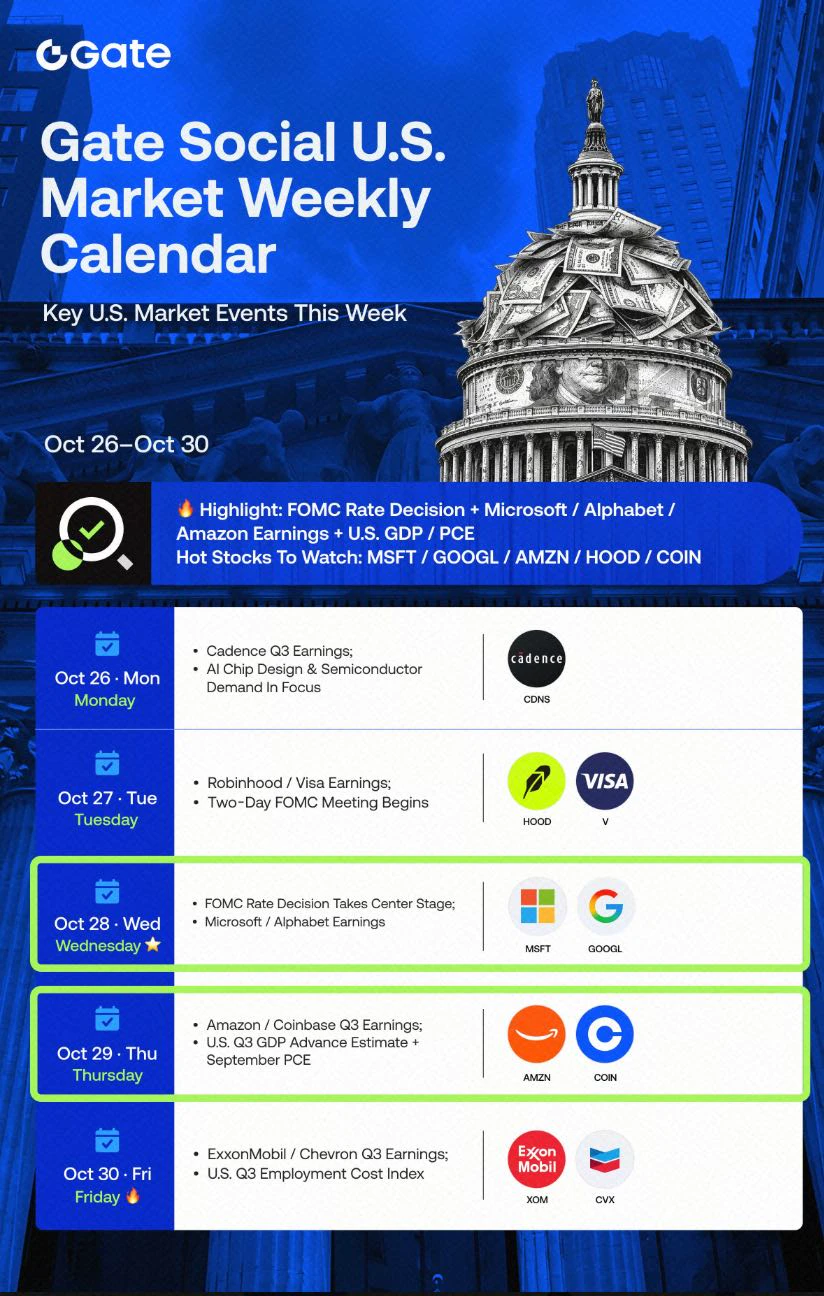
Strategy Inc is scheduled to release its third-quarter financial results after U.S. markets close on October 29, 2026, followed by a live video webcast. The company is the largest corporate holder of Bitcoin, and the upcoming report will provide the most detailed look yet at how its treasury strategy performed during a quarter when the asset's price recovered from its mid-year lows.
The preliminary figures disclosed by the company give a sense of the scale involved. Strategy estimated a $20.91 billion gain on its digital assets for the quarter ending September 30, a reversal from the
MSTR-1.29%
  • 11
  • 3
Bitwise pours cold water on RWA, $ONDO 24h bucks the trend at +4.1%
Bitwise pours cold water on RWA tokenization: after the $ONDO event, it moved from 0.497 to 0.491, yet held steady at +4.1% over 24h. The direction is clear: bullish.

Volume speaks first—24h trading volume was 45760706 USDT, with a volume ratio of 1.553, indicating increased-volume entry rather than a low-volume decline.

Daily RSI is neutral at 51.8, while MACD formed a death cross above the zero line (formed 4 days ago) and the green bars are expanding; the funding rate of 5e-05 is near the zero line, OI versus the arch
ONDO+3.75%
I didn’t do anything—just went to make a cup of tea, and when I came back, the candlestick chart had already done the work for me. The last thing I saw before bed was $MET , with the price still hovering around 0.4289 and moving sideways at the bottom. I saw buying pressure strengthening and funds quietly entering, so I placed a long order in advance. I didn’t make a huge fuss, just added one line: bullish—any pullback is an opportunity.

When I opened the market this morning, it had already touched 0.439, with +25.68% quietly sitting there. It was truly sluggish before, but the breakout feels
post-image
MET-3.87%
SOL-4.52%
XRP-2.47%
Load More

Join 40 M users in our growing community

⚡️ Join 40 M users in the crypto craze discussion

💬 Engage with your favorite top creators

👍 See what interests you

Trending Topics

Gate Money Officially Launches

3.44k Views12.86k Discussing

Gate officially launches Gate Money, a global integrated financial services app that brings digital assets, fiat, stocks, ETFs, gold, bank accounts, and payments into one Gate App. Users can manage assets, invest, send and receive funds, convert currencies, and make payments — all from a single account. Which use case are you most excited about? [👉 Learn more](https://www.gate.com/announcements/article/102094)

Fed September Minutes Lean Hawkish

64.13k Views2.72k Discussing

Samsung Q3 Operating Profit Surges 782.5%

36.83k Views1.93k Discussing

View More