






Share crypto content and earn up to 60% commissions through content mining.
placeholder
gatefun
BTC Reclaims $78k! The Market Has Stopped Falling and Rebounded—Is It Time to Buy the Dip or Wait f
gate liveLIVE
3,442
  • Reward
  • 3
  • Repost
  • Share
CryptoMishu:
2026 GOGOGO 👊
View More
This was purely the market being in a good mood and casually tossing out some gold coins—one just happened to hit me on the head.
Right after finishing lunch, while checking the charts, $ETH held on the retest, buying suddenly strengthened, and the volume-price action looked interesting. I went long at 2111.16 without overthinking it—I just felt this rebound had potential. Many people were still waiting on the sidelines, but I figured even if I was wrong, it would only cost a few points, so it was worth trying. When the entry feels comfortable, you have the confidence to act.
By the afternoon
ETH-0.71%
BTC-0.83%
LAB-17.31%
View Original
post-image
  • Reward
  • Comment
  • Repost
  • Share
JUST IN: India's economy expanded 7.8% in Q1 FY2027, beating consensus estimates.
post-image
  • Reward
  • Comment
  • Repost
  • Share
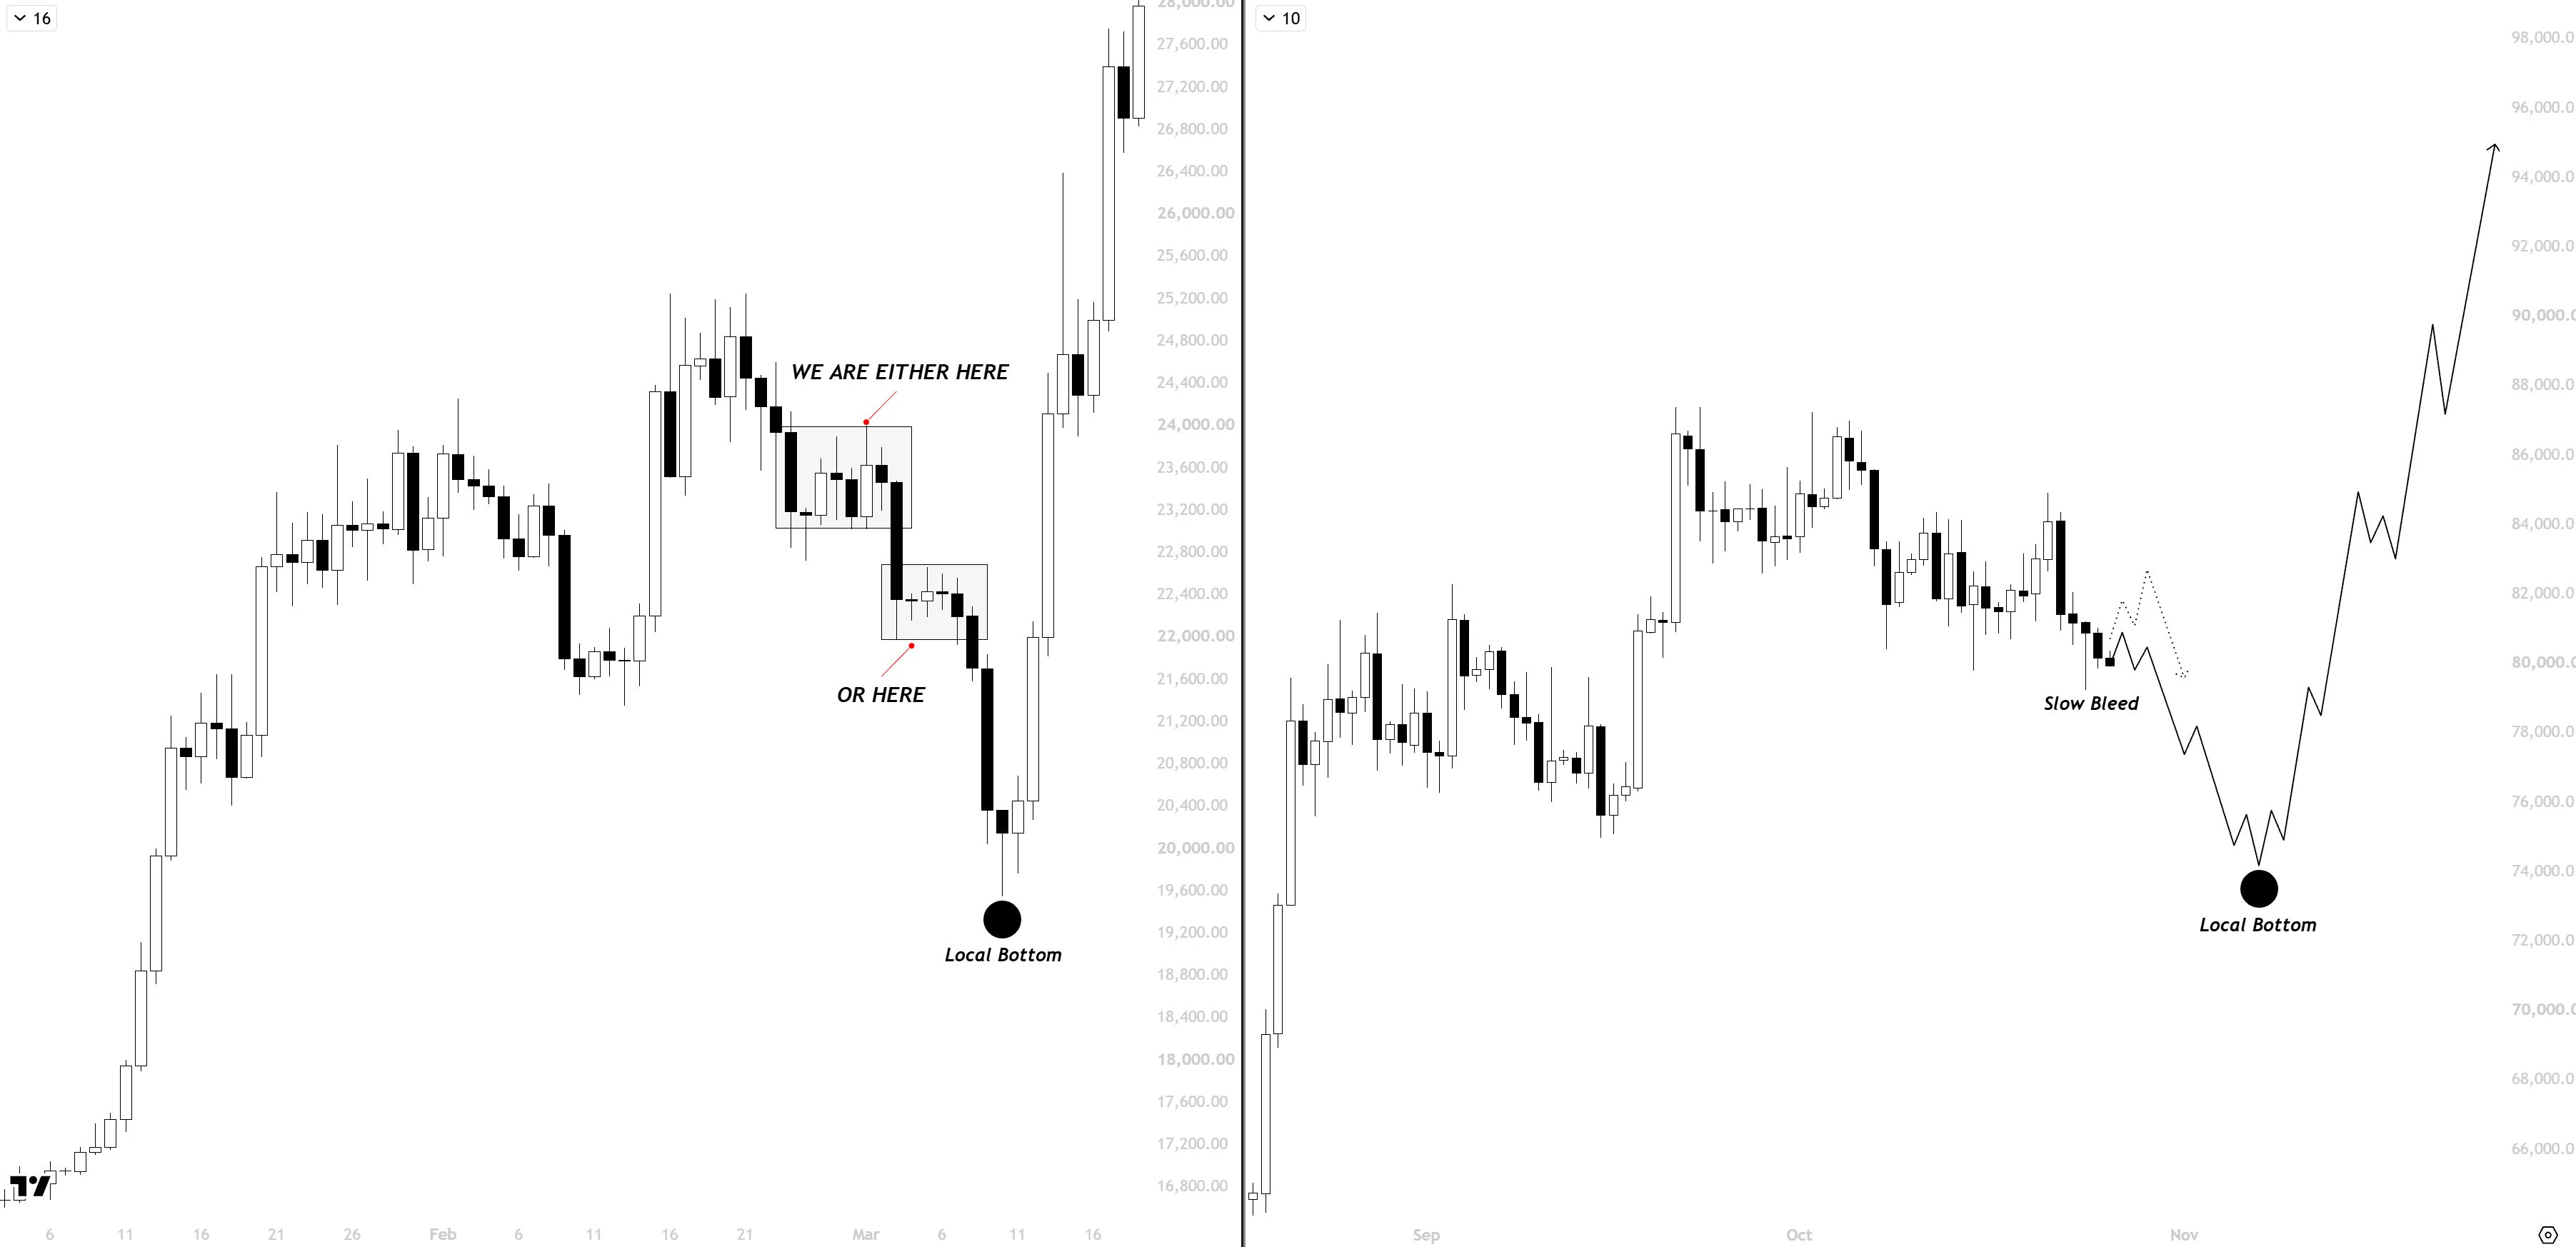
The bottom at 58K will be so obvious in hindsight
Bitcoin made a double bottom pattern with a weekly bullish divergence
You need to clean up your following if you missed the 58K bottom?
post-image
  • Reward
  • Comment
  • Repost
  • Share
$OPEN 24-hour drop of 13%, with trading volume at only 5.7 million; this coin is already dead, but I advise you to buy the dip immediately, because only the dead can rise again.
Let’s start with the data: from a high of 0.1508 to a low of 0.1289, the price swing was nearly 15%, but trading volume was only 5.7M. What does this show? It shows that the people dumping cannot exit their positions at all. When liquidity dries up, market makers are more anxious than you are. At 0.1310 now, the price is right at the lower edge of the previous concentrated trading zone. Once it breaks below 0.1289, a w
ETH-0.78%
SOL-3.92%
View Original
post-image
post-image
post-image
  • Reward
  • Comment
  • Repost
  • Share
#RobinhoodChainDailyRevenueSurpassesEthereum
Robinhood Chain just posted a daily application revenue number that turned heads. In the last 24 hours the chain generated 1.84 million dollars, ahead of Ethereum’s 1.14 million and second across all networks tracked. The fact that an RWA-focused chain is out-earning the largest general-purpose settlement layer on a single-day basis is the part worth examining.
Revenue concentration of this kind usually reflects one of two things: either a temporary spike from a small number of high-volume applications, or the early stages of a more durable fee cap
ETH-0.78%
RWA4.88%
post-image
post-image
  • Reward
  • 4
  • Repost
  • Share
Venüs_:
To The Moon 🌕
View More
contributing around 1-2% of entire Arcus OI on an average day
OI held will be much more important than volume, given all the wash trading thats happening due to 0% maker fees
sign up:
post-image
post-image
  • Reward
  • Comment
  • Repost
  • Share
🚨 $3.2B FLOWED INTO CRYPTO FUNDS LAST WEEK
That’s the biggest weekly inflow since October 2025.
Institutional money is coming back into crypto.
#USVenezuelaOilDeal
#U.S.StrikesIranBTCDips
post-image
  • Reward
  • 7
  • 1
  • Share
BitcoinWanderer:
Geopolitical and macro drivers combine to push volatility to the limit in the second half of the year.
View More
#AIStartupsRaise400BInSixMonths
#英伟达财报周 Nvidia Price Trend Analysis
As of August 29, 2026, Nvidia (NVDA) shares have experienced a dramatic roller-coaster ride. On August 24, the stock fell for a seventh consecutive trading day, closing at $208.48 and marking its longest losing streak since September 2022. It had fallen more than 10% from its May all-time high of $235.74, wiping out approximately $151 billion in market value in a single day. On August 25, the stock rebounded, gaining more than 2%; on August 26, it closed at $209.66. The market is holding its breath for the release of Nvidia’
post-image
  • Reward
  • 4
  • Repost
  • Share
ThisIsTranslateContent::
Get on board now! 🚗
View More
JUST IN: Canadian trader reveals a brutal week—over C$350k losses after a SpaceX betting spree on options and shares, following earlier gains from AMD/NVIDIA; says he’s seeking treatment for gambling addiction. $SPX? (No - SpaceX ticker not publicly traded; skip ticker)
AMD0.32%
NVDA-0.27%
post-image
  • Reward
  • Comment
  • Repost
  • Share
I've seen this kind of chart action many times. The first reaction isn't to chase a long, but to see whether there is actually support after the rebound. The key levels have continued to decline, and each rebound has been weaker than the last, so the direction naturally leans bullish; it's just a matter of waiting for the right position to act.
When the price rebounded to around 0.055108, it happened to be where the descending trendline overlapped with the key previous-high level, and consecutive upper wicks formed on the 15-minute timeframe. I didn't rush into the trade, waiting until the pri
LAB-17.31%
DOGE-3.30%
View Original
post-image
  • Reward
  • Comment
  • Repost
  • Share
#U.S.StrikesIranBTCDips #U.S.StrikesIranBTCDips
Markets are reacting quickly as fresh geopolitical tensions between the U.S. and Iran create a wave of uncertainty. Bitcoin has dipped alongside broader risk assets, showing once again how fast sentiment can change when major global events hit the headlines.
For traders, the move is a reminder that crypto does not trade in isolation. During periods of uncertainty, investors may reduce exposure to higher-risk assets and wait for clearer signals before making new decisions.
The key now is to watch price action, trading volume, liquidity, and the wi
post-image
post-image
  • Reward
  • Comment
  • Repost
  • Share
After $CASHCAT consolidated sideways for long enough, it chose to break below the lower edge of the range. There is no value in chasing the short here. The real opportunity is the retracement after the breakdown—wait for the price to return near the lower edge of the range before entering a short position.

The retracement reached around 0.24716, and the original key level became the key level. The price failed to reclaim it twice consecutively. Entering a short position here offered a clear stop-loss structure, and the price subsequently fell as expected, with the breakdown-retest logic begi
CASHCAT-7.05%
BNB-1.54%
LAB-17.31%
View Original
post-image
  • Reward
  • Comment
  • Repost
  • Share
$BTC closed the week in a neutral zone, but the momentum indicators are starting to lean bullish.
🔹 MACD is turning bullish
🔹 RSI has reclaimed 50
🔹 Stoch RSI is showing strong upside momentum
🔹 A bullish RSI divergence is also visible on the chart
The key battle is now around the Weekly MA 50 near $81K.
If Bitcoin can break and hold above $81K, the next targets could be $90K → $100K.
But another rejection could send BTC back toward $75K, with $69K as the major support below.
This week could be important with US ISM data on Tuesday and US jobs data on Friday.
$81K is the level to watch.
post-image
  • Reward
  • Comment
  • Repost
  • Share
【$BTC Signal】Bearish momentum spreading; 1H rebound lacks strength
$BTC 4H MACD histogram has extended to -74.33, while 1H RSI is at 39.3, with rebound strength fading. The price is trading below the 4H Bollinger middle band and has repeatedly tested the 77533-77711 range, without mounting an effective counterattack. Buy-side depth is dominant, but the price continues to decline, casting doubt on the efficiency of buy orders.
🎯 Direction: short
⚡ Entry/limit order: 77533.839-77711.700
🛑 Stop-loss: 78488.817
🚀 Target 1: 76546.024
🚀 Target 2: 75963.187
🛡️ Trade management:
- Execution str
View Original
post-image
  • Reward
  • Comment
  • Repost
  • Share
Fourth setup for the day
$OG
OG-3.06%
  • Reward
  • Comment
  • Repost
  • Share
injective-protocol:native
Fake out of the top of the range. Not a great look now and just speaks to the market conditions in Crypto.
Volume and buyer interest unable to sustain for consistent periods right now.
post-image
  • Reward
  • Comment
  • Repost
  • Share
Japan: The largest-ever foreign exchange market intervention.
Result: The yen returned to its pre-intervention level.
Conclusion: The market is the real boss.
View Original
post-image
  • Reward
  • Comment
  • Repost
  • Share
ngl fomo is pretty pretty pretty smooth...
post-image
  • Reward
  • Comment
  • Repost
  • Share
Load More

Join 40 M users in our growing community

⚡️ Join 40 M users in the crypto craze discussion
💬 Engage with your favorite top creators
👍 See what interests you
  • Pinned