Square
Following
Hot
News
Profile
Share your thoughts
placeholder
Article
Everyone is sleeping on SYMBOL while the 1h RSI whispers something dangerous.

$SOL /USDT - LONG

Trade Plan:
Entry: 110.32 – 110.66
SL: 108.85
TP1: 111.72
TP2: 112.54
TP3: 113.77

Why this setup?
Why now? The daily trend is bullish and the 1h ATR of 0.684327 shows the volatility is just starting to expand. The 15m RSI sitting at 34.25 proves the short term is oversold enough to catch a rebound. Entry is locked between 110.32 and 110.66 with the reference price at 110.49, giving a precise risk controlled spot. The first target sits at 111.72 and the second target is 112.54, but the trade di
SOL+0.81%
Last night, BTC rose first and then fell, stopping after climbing to around 84,200 at its peak before beginning another downward move. It fell to around 83,200 this morning at its lowest, marking nearly 1,000 points of one-way decline. It has now recovered to around 83,600 and is fluctuating.
From the market structure, the 83,000 level has been tested several times and quickly reclaimed, indicating buying support below this level and initial signs of a short-term bottom. The 84,000–85,000 area above is currently the zone with the densest concentration of recent positions, forming a core resist
post-image
BTC+0.77%
$LUMIA : Two timeframes are in conflict; the key is not guessing the direction
$LUMIA 24 hours +20.74%, current price 0.1246. On the surface, this is merely a rise or fall, but the real conflict is hidden in the timeframes: the 1-hour chart is weak, while the 4-hour chart is strong. When the two charts give opposite answers, the least useful thing to do is pick the chart you prefer and believe it completely.
The opposing view also has clear invalidation levels. A break below the 1-hour support at 0.1015 would show that short-term buying support has failed its test; if the 4-hour support at 0.07
post-image
LUMIA+19.99%
$APT The most important thing to watch is not whether the price rises or falls, but whether participation has kept up after the price moved.
This time, I’m not looking at the gainers and losers ranking—only the key levels. The current price is 0.9009, approximately 7.05% above the 1-hour support at 0.8374 and approximately 7.17% below the resistance at 0.9655.
My criteria are simple: only a breakout above 0.9655 followed by continued strength would count as an upside continuation; a break below 0.8374 invalidates the previous view. The 1-hour and 4-hour trends are both strong, with RSI at 70 a
post-image
APT+4.31%
#Bitcoin just reclaimed $84,000! 🚀
Do we trust this small weekend pump?
post-image
BTC+0.75%
Ledger confirms: one affected device contained an unauthorized hardware implant.
→ Estimated losses: $72M to $93.4M, not verified by Ledger
→ Reseller involved: CryptoBilis, sales suspended
→ Ledger: no indication that its systems were compromised
#HeadToPeshawar
The old grain is nearly gone, and the good seedlings have yet to promise a harvest. In my old age I have come to love gruel, yet by year’s end I still lack clothes. Sparrows feed their young beside the mossy well, and roosters crow at the white-plank door. A firewood cart is drawn by a weak horse; in straw sandals I herd great boars. Evening rain splits the red pomegranates, and in early autumn the green taro grows plump. After bringing food to the fields, I rest beneath the mulberry trees, then return through the grass beside the neighboring house. My dwelling is called Fool’s Valley—why both
Despite the bearish sentiment, this 2-week Crypto Total Market Cap chart is bullish!
- Bullish breakout and retest ✅
- The trend ribbon is about to turn bullish ⌛️
TOTAL 2W
post-image
$ZEUS has already bought the dip and is just waiting for it to double before selling everything
ZEUS+51.67%
$TRX TRX | Wave C Points At The Flip Zone Below
By analyzing the TRX (TRON) chart on the Daily timeframe, we can see a market that broke its bullish structure in June and has spent four months building a corrective pattern that is now close to its final leg.
━━━━━━━━━━━━━━━━━━━━
DAILY TIMEFRAME
━━━━━━━━━━━━━━━━━━━━
The uptrend. The move began with the MSS in February and was confirmed by two BOS events through March and April, carrying price from $0.2700 to the May high at $0.3760.
The break. That ended in June. The CHoCH near $0.3200 took out the structure that had held the entire advance — t
post-image
TRX-0.21%
What is your top #Altcoin pick right now ⁉️
And which #Memecoin are you betting on next 🚀
👇👇👇
post-image
MEME+0.62%
Layout: Bitcoin, Ethereum, Dogecoin
live-cover
LIVE880
  • 3
📊 In 2 years, about 700,000 people were withdrawn from crypto exchanges. BTC — the balance of sites decreased from about 3.15 million to 2.45 million coins, Coin Glass data show.
#LedgerLossesNear90Million $BTC ‌
post-image
BTC+0.75%
$NEAR ‌NEAR USDT - Technical Outlook | Oct 10
NEAR is trading at $5.014with over 5% gain in the last 24 hours.
Highlights on the Chart (4H):
After a sharp pullback to the $4.30level in recent days, a strong recovery has taken place. The price managed to bounce approximately 16% from the bottom.
We are at a technically important level:
Price has moved above MA5 ($4.852)and MA10 ($4.783).Now the MA30 resistance at $5.024is being tested. 4-hour closes above this level could strengthen the momentum.
Levels to Watch:
Resistance: $5.056(24h high) / $5.34/ $5.60Support: $4.85/ $4.63/ $4.30
The Order
post-image
NEAR+9.61%
#BTC回调触及81000美元
BITCOIN AT $83,625: BUYERS ARE FIGHTING BACK, BUT THE $84,200 BREAKOUT IS THE REAL TEST
Bitcoin is currently trading at $83,625.30, with a 24-hour low of $82,800 and a high of $84,192.20. After recovering from recent lows near $81,000, BTC is showing signs of short-term strength. However, the market is now approaching an important resistance zone where the next major decision could take shape.
My view is cautiously optimistic, but I am not ready to declare a confirmed bullish reversal. Bitcoin needs to break resistance, attract stronger buying volume, and hold its gains before
BTC+0.75%
$SPY $Q
🦇 Market Maestro | The AI Bull Market Is Entering Its Fifth Year
The S&P 500’s current bull market began on October 12, 2022, based on its closing low. I entered in November 2022. We made the real money through 2025 amid all the shouting about recession and crisis. So tomorrow, we enter its fifth year. The index’s approximately 118.4% price gain through the October 9 close is a strong performance, but it does not by itself indicate that the cycle is nearing its end.
History tells us longer cycles are possible. The 1987-2000 bull market, which included the dot com boom, lasted approxi
post-image
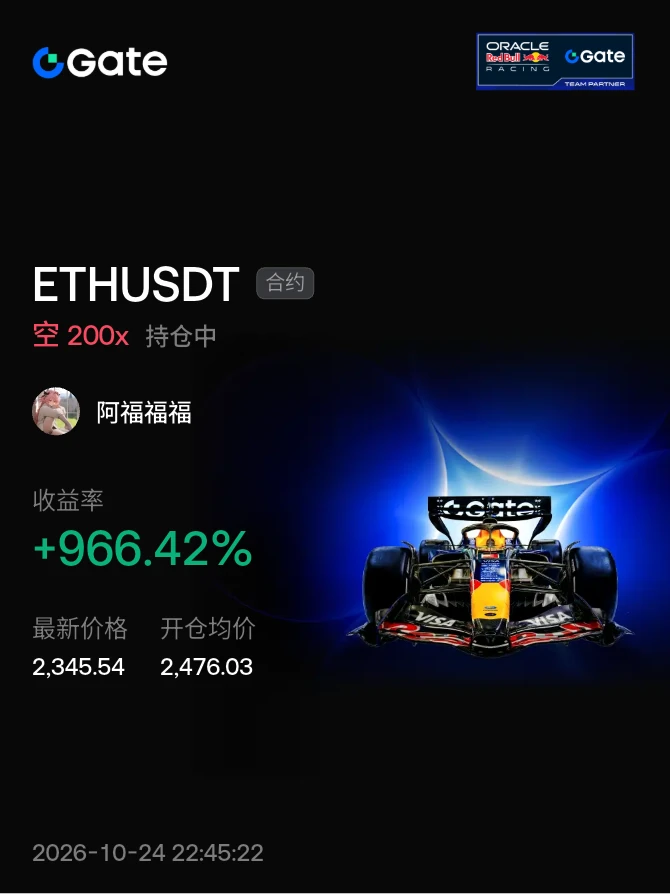
When using very high leverage like I do you must be tuned into the chart!
Patience and discipline is a absolute MUST! 💯
post-image
BTC & GT Price Prediction - Will GT Hit $30?
live-cover
LIVE80
$STRK PUMPED 456%
THE TEAM WANTS TO MAKE IT A L1 AND THE FIRST QUANTUM PROOF L1.
This is still a proposal under consideration, not a finalized decision or governance-approved plan
Interesting times already. Bears still think we are in a bear market...
post-image
STRK+12.70%
Load More

Join 40 M users in our growing community

⚡️ Join 40 M users in the crypto craze discussion

💬 Engage with your favorite top creators

👍 See what interests you

Trending Topics

GateAtTOKEN2049

41.5k Views21.87k Discussing

Gate brought a series of major events to TOKEN2049 Singapore! From the official launch of Gate Money to the F1 Red Bull driver meet-and-greet and the Gate Gala, we witnessed a new chapter of "One Gate, Borderless Finance." Which moment from TOKEN2049 stood out most to you?

LedgerLossesNear90Million

39.56k Views303 Discussing

GateWCTCS9GlobalTradingCompetition

34.67k Views5.17k Discussing

View More