Square
Following
Hot
News
Notifications
Profile
Share your thoughts
placeholder
Article
$XRP uses timeframe confluence to find opportunities, with levels and exit lines here
$XRP There’s a classic debate right now: one side points to the 24-hour gain of +1.44% as proof of direction, while the other counters with key levels. I’m not taking sides based on the percentage move for now, because $XRP has already moved on the 1-hour chart, while the 4-hour chart hasn’t confirmed it or given a complete answer. I’ll treat the shorter timeframe as a signal to pay attention, not as a conclusion. Without confirmation from the larger timeframe, direction can still swing either way.
My view is
post-image
XRP-1.15%
Let me show you the Las Vegas storm, and you'll see. At the bottom of the previous cycle, the Las Vegas channel, plus this cycle's Las Las Vegas channel #BTC跌破6万美元关口 Bitcoin near 44000 $BTC
BTC-0.65%
  • 1
Trenches
PIEVERSE
P
bade
b
PIEVERSE
0x0e...25a9
Market Cap
$.
Change
.
24h Vol
$.
Holders
.
FIONA
F
bade
b
FIONA
B34n...pump
Market Cap
$.
Change
.
24h Vol
$.
Holders
.
IDOL
I
bade
b
IDOL
0x3b...ab07
Market Cap
$.
Change
.
24h Vol
$.
Holders
.
CLAUDIA
C
bade
b
CLAUDIA
2j5S...W2ZM
Market Cap
$.
Change
.
24h Vol
$.
Holders
.
Singularity
S
bade
b
Singularity
7R4M...pump
Market Cap
$.
Change
.
24h Vol
$.
Holders
.
[New Streamer] Market Prediction
live-cover
LIVE2,762
BTC-0.67%
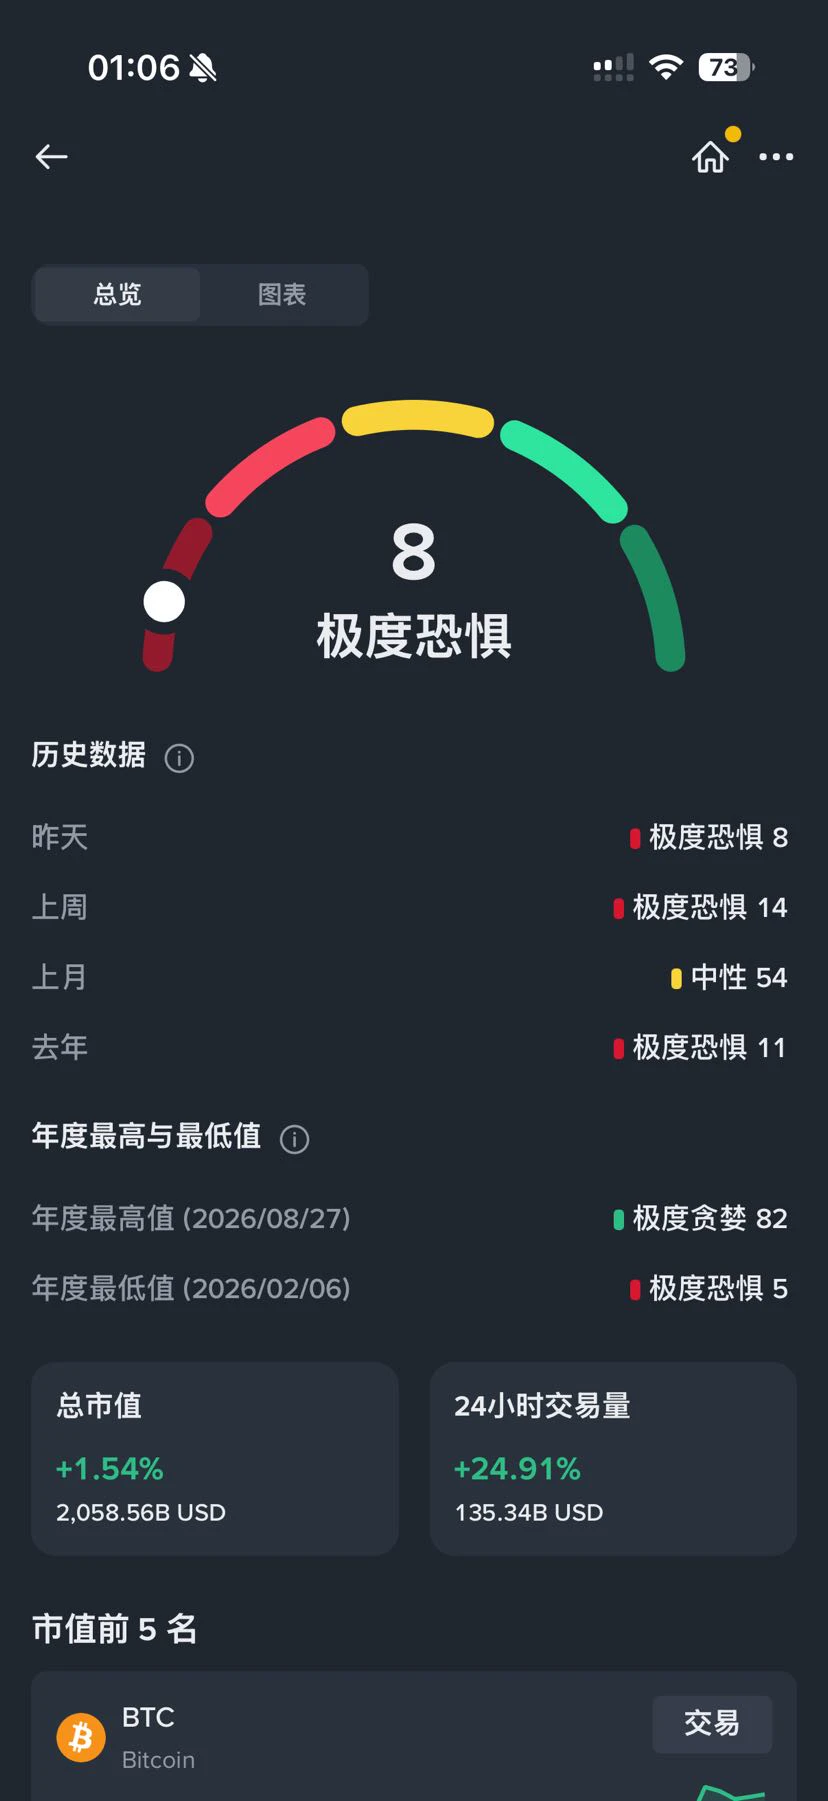
Guys, are you afraid?$BTC $ETH ‌$BTC ‌
post-image
BTC-0.65%
ETH-1.23%
  • 1
  • 1
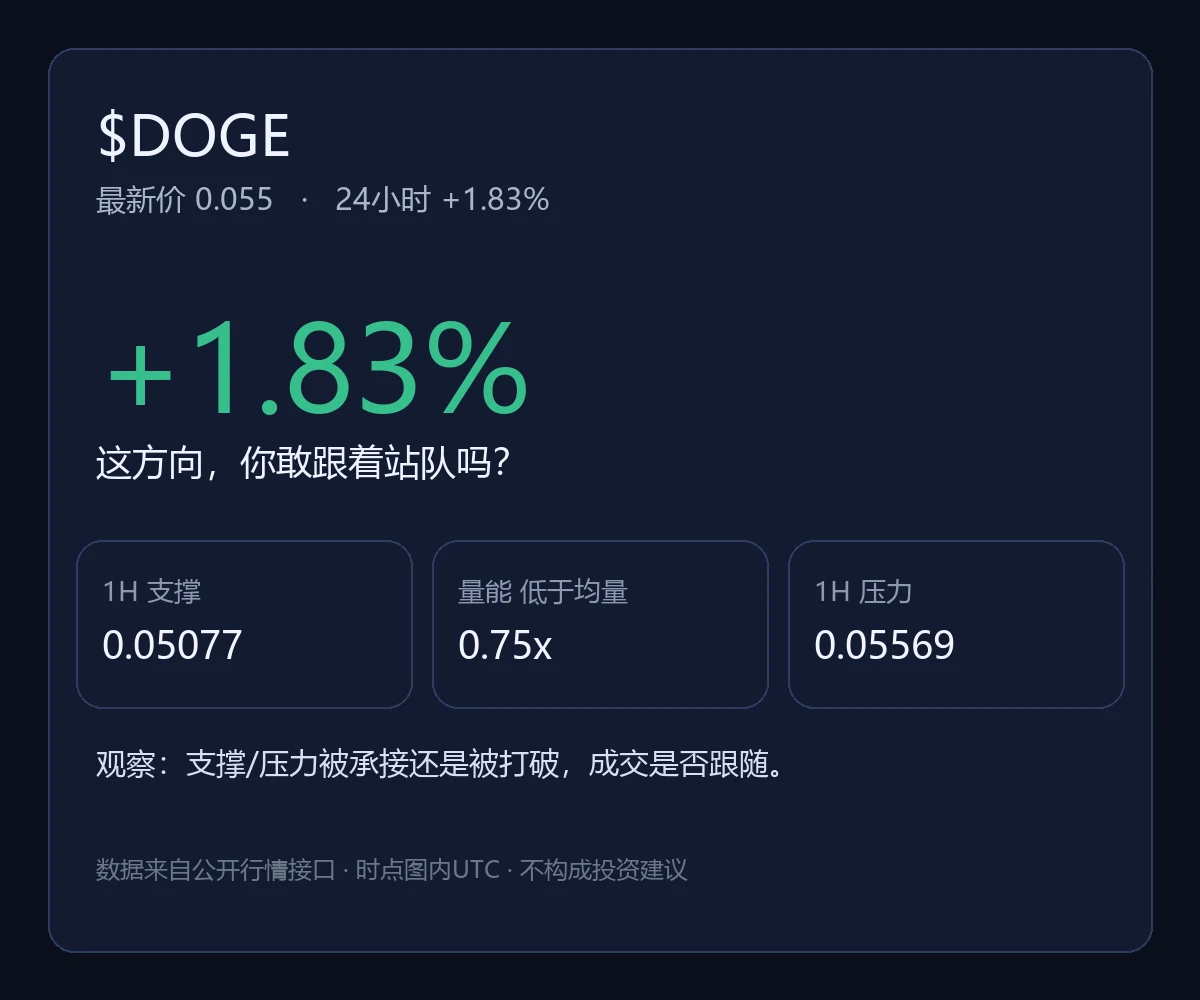
$DOGE Up 1.83%, back to 0.055. The hourly chart looks moderately strong, but the four-hour chart remains weak. RSI is simultaneously overbought and oversold, while a volume ratio of 0.75 further confirms that nobody is willing to take over. This kind of conflicting timeframes can easily trip up anyone betting in one direction, so I’ll wait for confirmation. Current price: 0.055. A break above 0.05569 counts; below 0.05077, I’ll stop out and admit defeat. Don’t expect a trend reversal until resistance is broken. If support doesn’t hold, look lower. Not investment advice.
#DOGE #狗狗币 #Cryptocurre
post-image
DOGE-0.22%
#GateDirectIPOPhase3ANTAllocates92100Shares
Gate Direct IPO Phase 3: Anthropic (ANT) Allocates 92,100 Shares — Strong Demand Highlights Growing Interest in AI Investments

Gate.io has officially confirmed the allocation results for Phase 3 of its Direct IPO Access program featuring Anthropic (ANT), marking another important milestone in connecting cryptocurrency investors with opportunities in the traditional stock market.

A total of 92,100 ANT shares have been allocated, with overall subscription demand reaching approximately 152 million USDT. The final allocation represents a total value o
post-image
ANT-8.68%
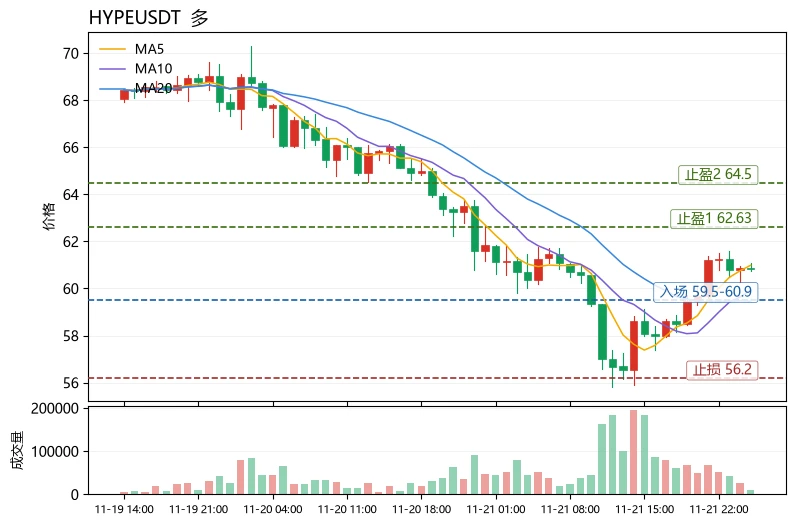
$HYPE Current price: 60.84. The first resistance overhead is the upper Bollinger Band at 62.63, while the first support below is MA20 at 59.46. The dividing line between bulls and bears lies between these two levels. I’m laying out the price levels first because this coin’s current structure is well suited to illustrating a reusable way to read charts: use moving average alignment to judge whether a trend is healthy.
First, the trend structure. MA5=60.98 remains above MA20=59.46, with the short-term moving average above the medium-term one—a nascent healthy bullish alignment. But the gap betw
post-image
HYPE+0.24%
DODO+11.43%
RENDER+0.47%
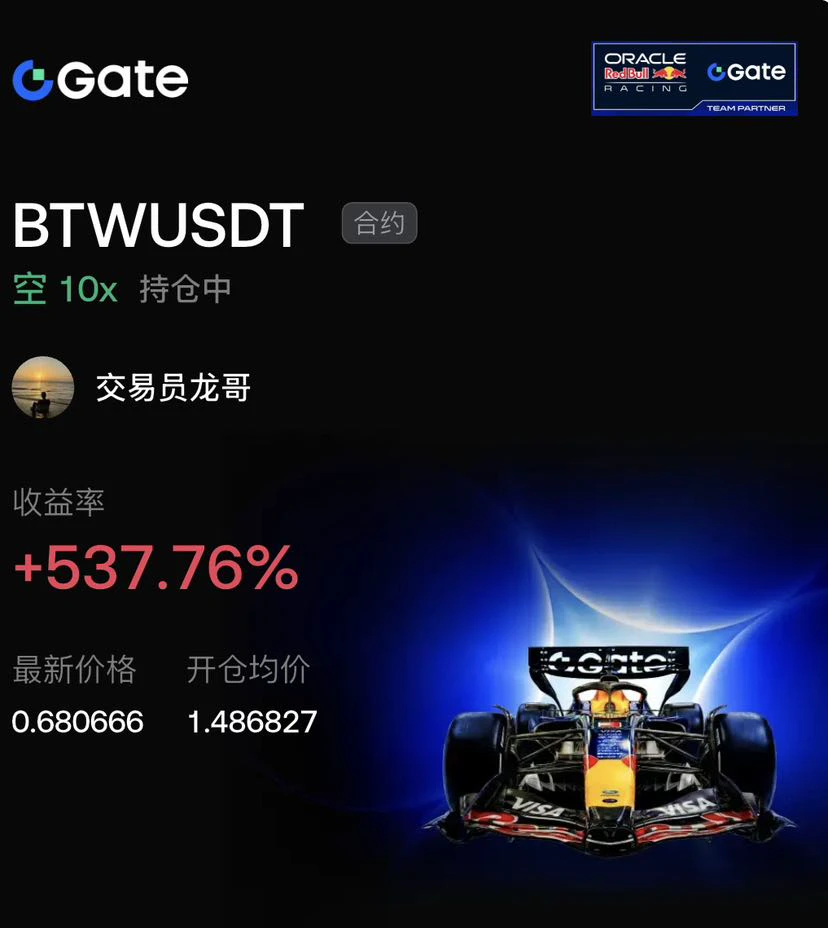
$BTW +537.76% in unrealized profit, thanks to precisely positioning for the rejection at the top. The asset was strongly rejected at 1.486827 and turned sharply downward, with a bearish moving average crossover and rising volume. I entered a 10x short, then bears drove the price down to 0.680666 in one uninterrupted major down wave. Bears are completely in control of the market.

The current profit cushion is substantial, but prices near the lows are prone to a technical recovery. Bearish sentiment is highly unanimous. At 10x leverage, a sudden wick could happen at any time, leaving no safety
post-image
BTW-7.75%
BTC-0.65%
GT-2.24%
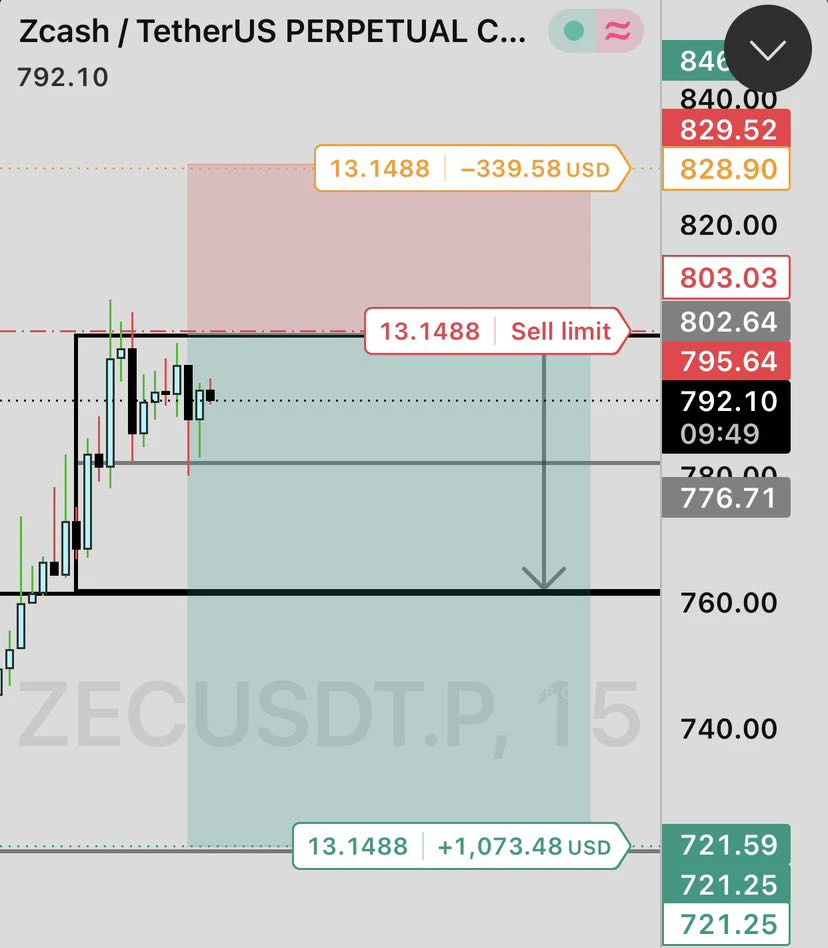
$ZEC Short idea. 15m chart. 📉

Price is approaching a heavy resistance block around 802. If the sellers defend this area, we could see a sharp drop toward the lower targets.

Entry: 802.64
SL: 828.90
TP: 721.59

Keeping this setup on the radar. Are you planning to short this? #Zec #$ZEC #ZEC: #ZEC,
post-image
ZEC+1.16%
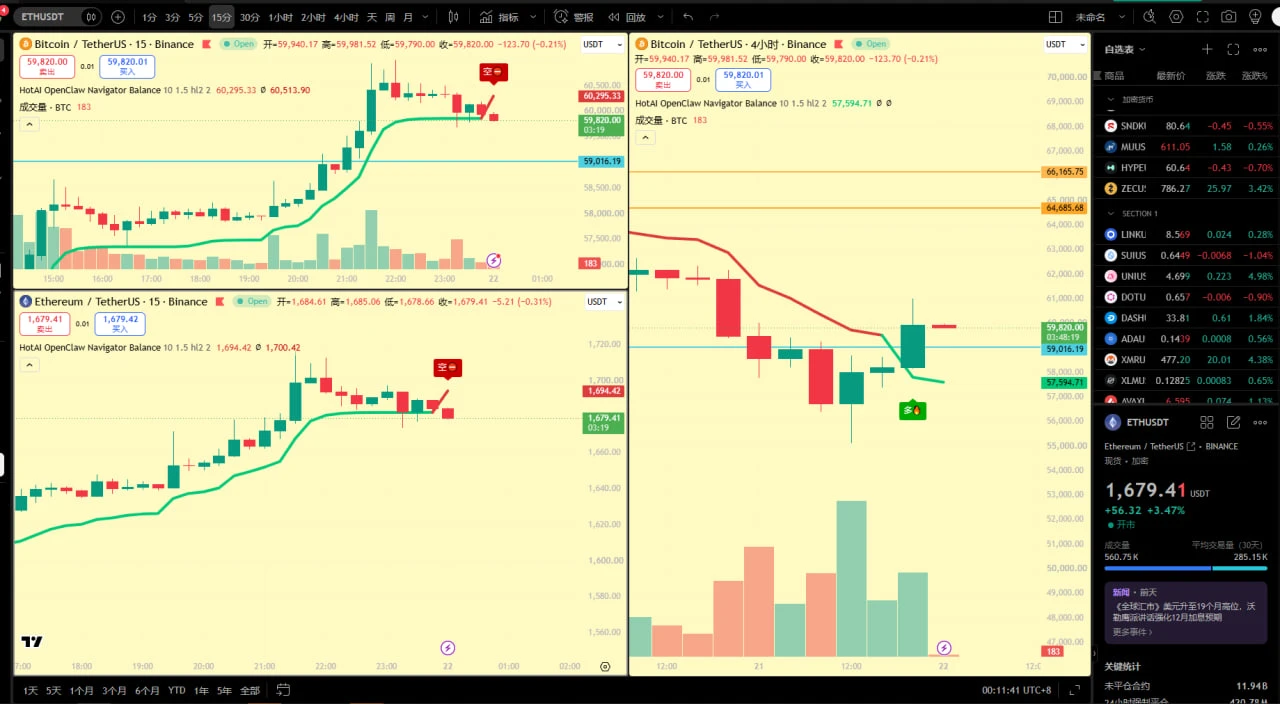
After an evening surge and pullback, the market is correcting after its rebound. There are few trading opportunities tonight, so it’s a good time to rest. We’ll trade again tomorrow. $ETH ‌#BTCETF连续三日净流出
post-image
ETH-1.23%
2026.11.22
Daily chart entry point: 1683
Resistance levels: 1701-1710-1716-1726-1736
Support levels: 1680-1671-1656-1647-1636
1626-1616-1600-1580-1550-1543-1536
At the first break of any support or resistance level, stop out; if it holds, look for a rebound. Once price stabilizes, follow the trend. This is personal advice for reference only. Pay attention to 1716-1626-1543-1536.#BTC跌破6万美元关口 $ETH
post-image
ETH-1.23%
On the evening of November 20, BTC and ETH plunged.
I took profits on my short position early. I’d said I wouldn’t open any more trades.
But when I saw ETH fall below 1,700, I opened my first position at 1,680.
I added some at 1,650, then added heavily around 1,630.
I was still being overly optimistic. It had already fallen 60 points, from 1,760 to 1,700,
so I figured it couldn’t possibly drop below 1,600. A small pullback would be enough to double my position. But then it bounced to around 1,645, and my account was up 100%. I didn’t close the trade, thinking I’d keep holding.
Then it suddenl
BTC-0.65%
ETH-1.23%
  • 3
$MMT Wait for a rebound before shorting, guys. The uptrend has broken, and the price is falling sharply after rising. Don’t try to catch the bottom and go long now, guys—the price could keep falling. Wait for a rebound before shorting; that’s safer, guys
post-image
MMT-2.35%
  • 1
Your Pi is not your Pi until it's migrated. Check migration status now. Comment MIGRATED or NOT YET.
#PiNetwork
#ShareWeekly
#GateSquare
#WCTCS9
post-image
PI-0.60%
[New Streamer] Market Prediction
live-cover
LIVE1,601
BTC-0.67%
Every sharp dip that gets bought with conviction is the market reminding you who’s still in control.

$BTC

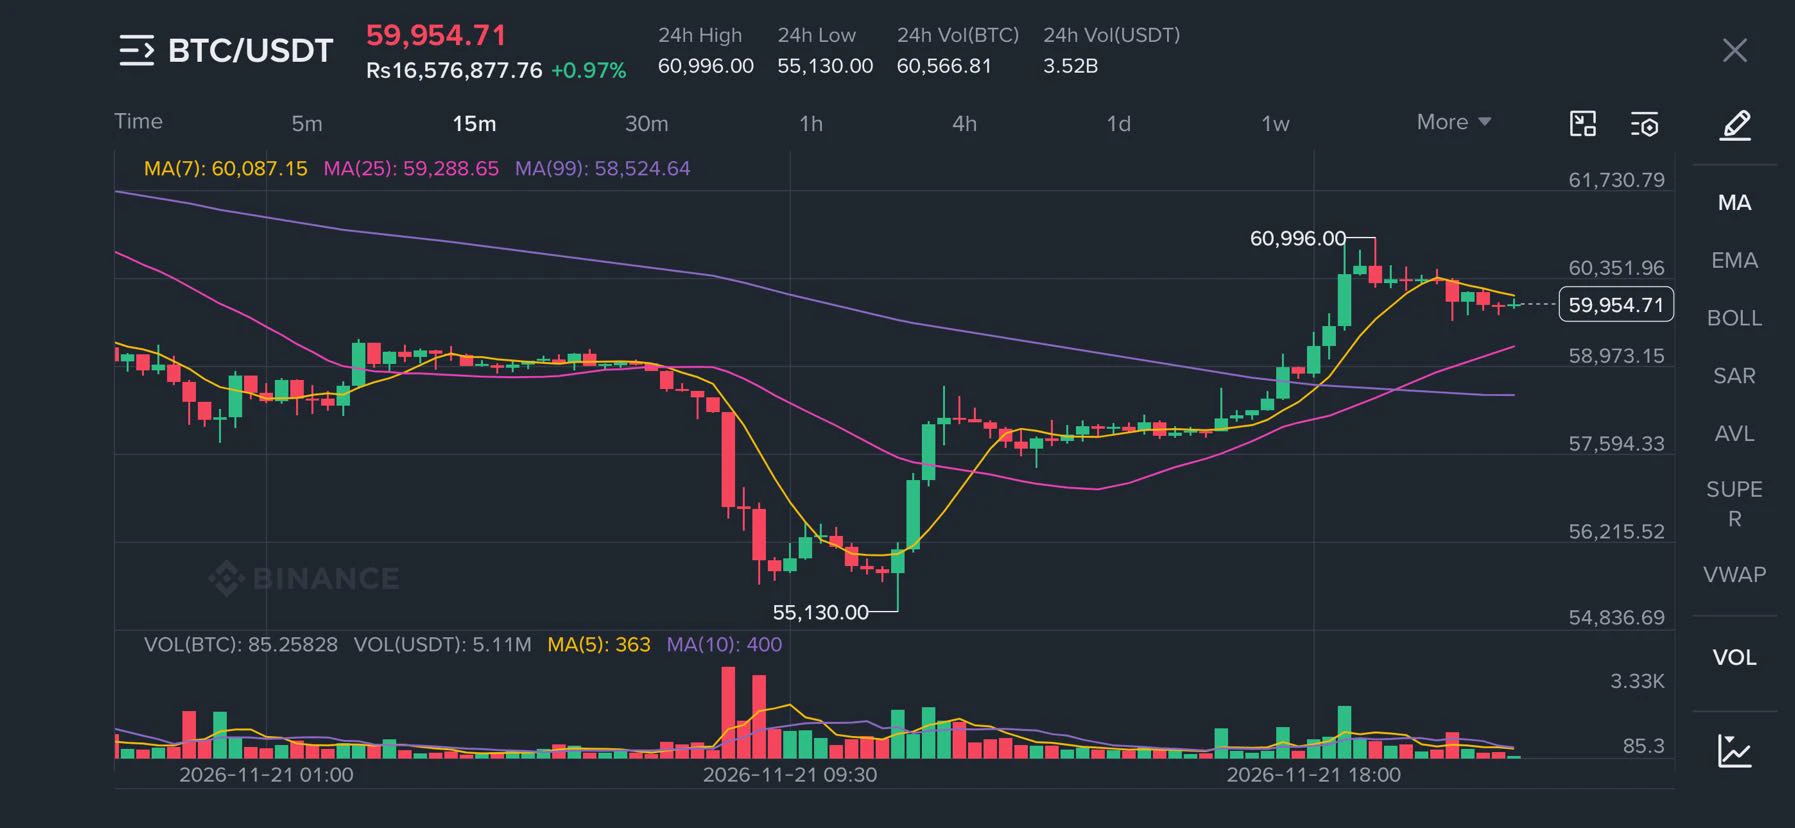
After the flush to 55,130, price reclaimed and tagged 60,996. Currently hovering near 59,950.

Key levels I’m watching:

• Immediate resistance: 60,000 – 60,996

• Support zone: 59,280 (MA25) then 58,520 (MA99)

• Invalidation on the bounce: sustained break below 58,500

Structure is recovering, not broken.

Waiting for either a clean hold above 60k or a retest of the higher timeframe MAs for the next leg.

What are you seeing on your chart?

#BTCBreaksBelow60K #GateDirectIPOPhase3A
post-image
BTC-0.67%
  • 2
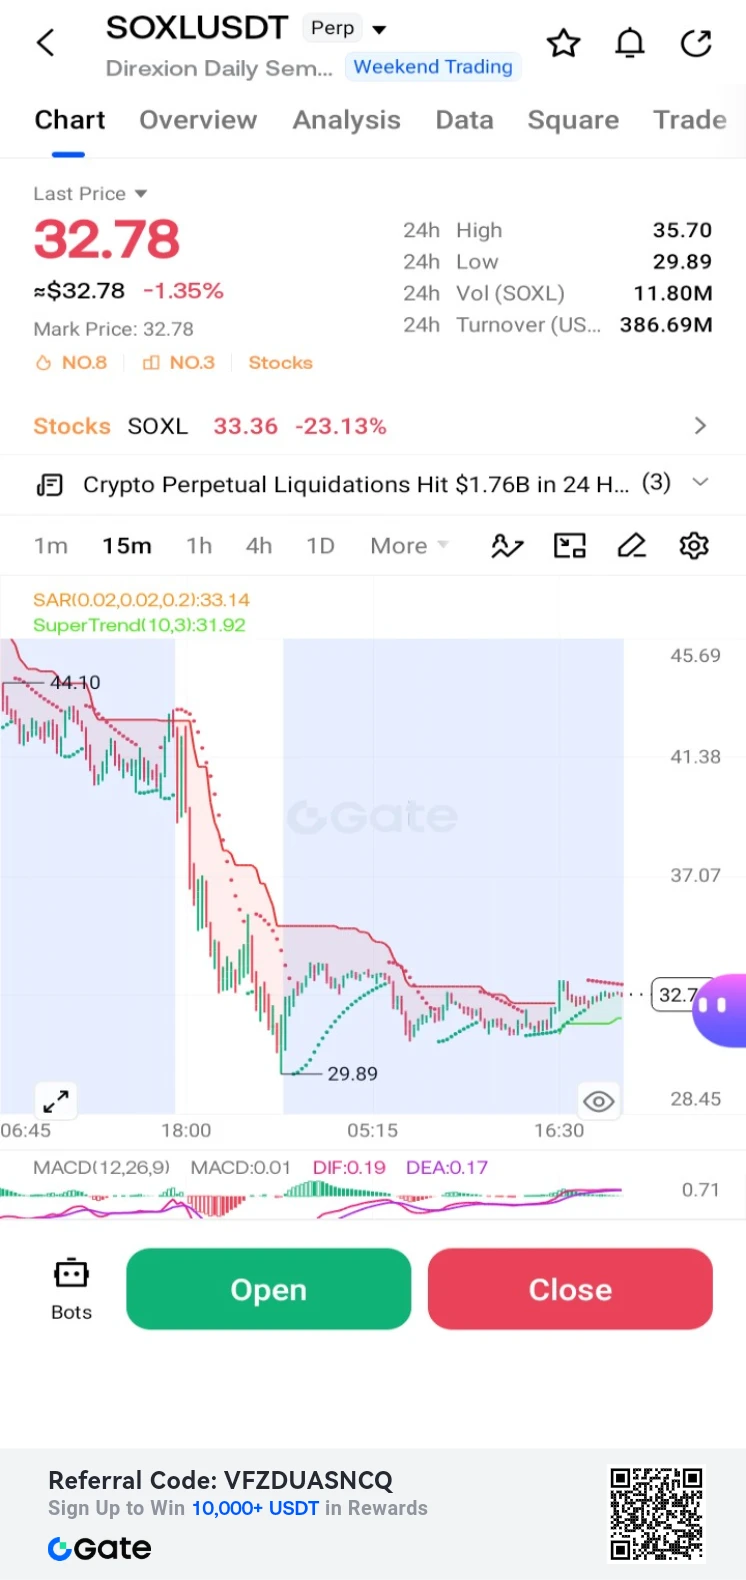
$SOXL /USDT Perp – "Oversold Bounce – Long"**
Trading Plan Long $SOXL
Entry: 32.78
SL: 29.89
TP1: 35.70
TP2: 37.07
SOXL is down -1.35% but showing a slight bounce from the 29.89 low. MACD histogram is stabilizing; targeting the 35.70 resistance.
post-image
SOXL-1.16%
gate expands its partnership with openpayd, adding gbp account and eur sepa capabilities to more of its operations. the integration strengthens fiat payments and fund management across gate money’s digital asset, equities, and payment services.
$GATE $OPENPAYD #FINTECH
post-image
GM Mfers
New day new opportunities
post-image
I’d like to ask how you’d rate my luck
Load More

Join 40 M users in our growing community

⚡️ Join 40 M users in the crypto craze discussion

💬 Engage with your favorite top creators

👍 See what interests you

Trending Topics

BTCBreaksBelow60K

2.1M Views29.9K Discussing

BTC fell below $60,000 on November 20 for the first time since July, alongside a tech stock selloff and broader pressure on risk assets. Will $60K become resistance, or can BTC quickly reclaim it? What price or volume signals would convince you that selling pressure is easing?

GateDirectIPOPhase3ANTAllocates92100Shares

779.2K Views4.9K Discussing

NvidiaDropsNearly14Percent

326.7K Views7.6K Discussing

View More