Square
Following
Hot
News
Profile
Share your thoughts
placeholder
Article
Trader Gu Jingci: Bitcoin/Ethereum Strategy Scores a Big Win This Week
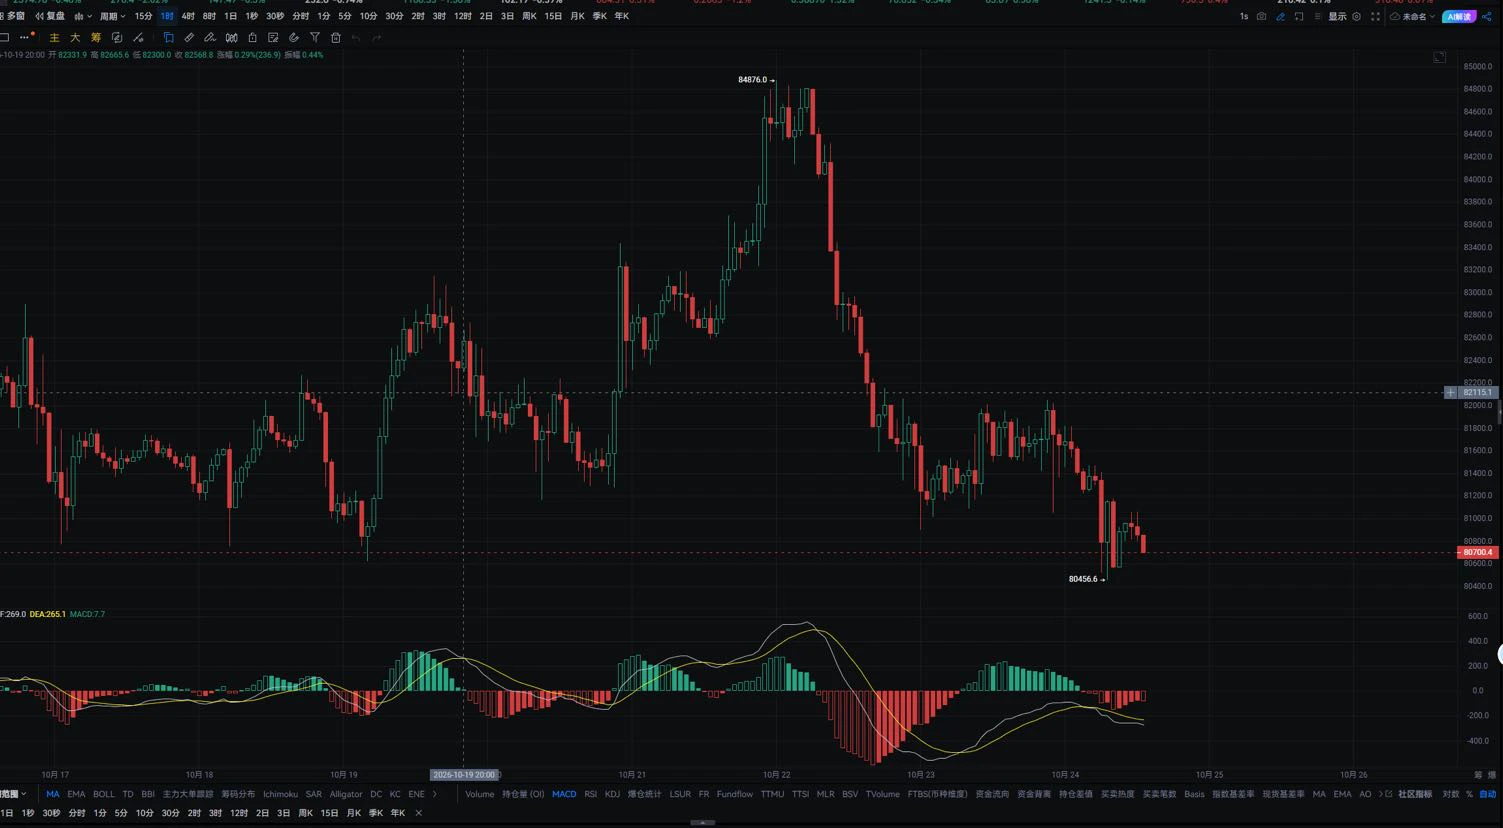
Since Bitcoin/Ethereum surged to 84300 and 2878 at the start of the week, I repeatedly advised taking short positions in the first half of the week around highs of 2550, 2520, 2480 and 84000, 83600, 83300. The market then fell all the way to around 79700 and 2313, fully maximizing the short-side gains.
Then, starting Thursday, I advised entering long positions during the pullback around 2350 and 80500, followed by short positions at 2480 and 82800. Over the past two days, the strategy was also to sell high and buy low, with
BTC-0.09%
ETH-1.41%
  • 6
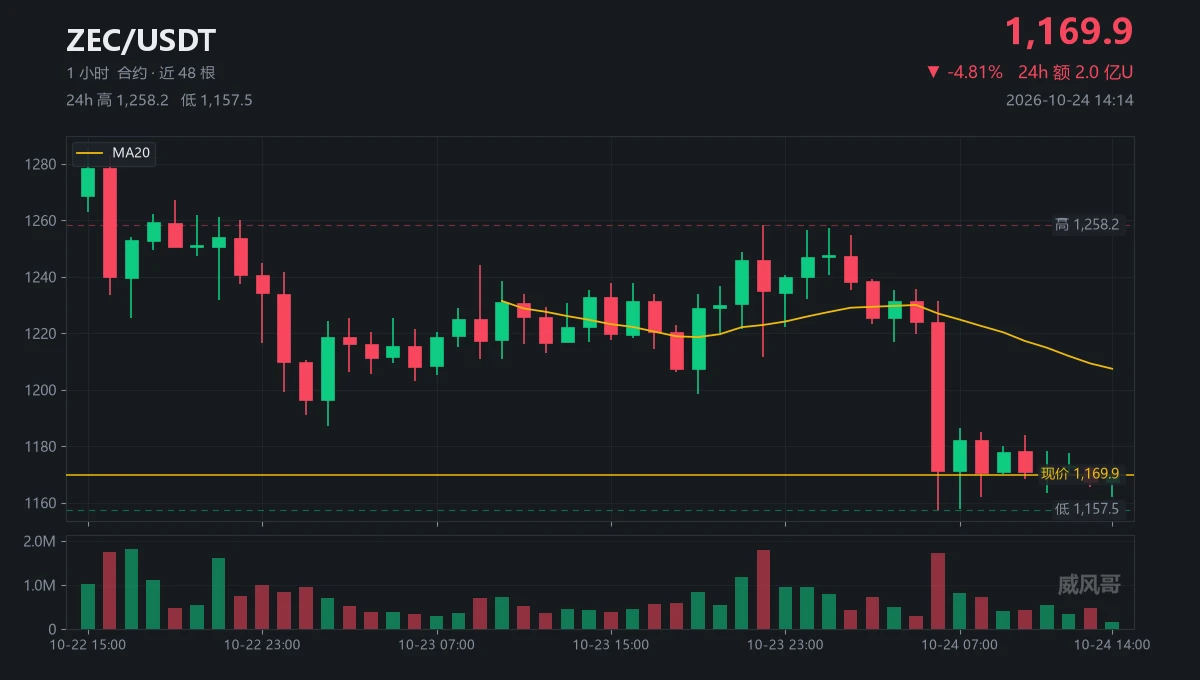
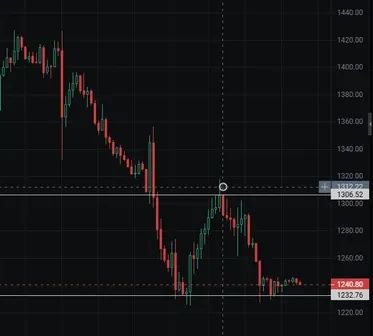
My trading system and indicators tell me to hold the short position and continue waiting$ZEC ‌
post-image
ZEC-4.49%
Trenches
金钱自由
金
bade
b
金钱自由
0x9b...0b07
Market Cap
$.
Change
.
24h Vol
$.
Holders
.
AGT
A
bade
b
AGT
0x5d...e274
Market Cap
$.
Change
.
24h Vol
$.
Holders
.
CNPY
C
bade
b
CNPY
0xc6...ddd2
Market Cap
$.
Change
.
24h Vol
$.
Holders
.
TSI
T
bade
b
TSI
0xa8...1c1e
Market Cap
$.
Change
.
24h Vol
$.
Holders
.
Gato
G
bade
b
Gato
55A3...pump
Market Cap
$.
Change
.
24h Vol
$.
Holders
.
#美国9月PPI大超预期
DOGE my 0.08913 short position, current price 0.07964, large unrealized profit; 0.08074 sets the direction
Market: On the 4H chart, price pulled back from 0.08913, bounced weakly after bottoming at 0.07696, and is now at 0.07964 (down 0.41% over 24h). MA5 (0.07972) and MA10 (0.08002) are overhead resistance, while MA30 (0.08074) is trending down; bearish momentum continues, and the rebound is weak.
P&L calculation: 0.08913 - 0.07964 = 0.00949 price difference; the large unrealized profit continues to grow.
Key levels: Support 0.07697/0.07696, resistance 0.08074/0.08388
Outlook: R
DOGE-1.68%
The S&P 500 closed at 7,659.44 points last Friday, down 1.9% for the week—giving back about 148 points based on the closing level. The Nasdaq fell 2.1% over the same period. This pullback isn’t noise; it at least shows that the market is starting to reprice risk. More importantly, a signal has emerged, but one confirmation is still missing: with a packed earnings calendar this week, the AI trade is about to face a real test.
I’m watching the volatility compression in the run-up to the open. Typically, volatility gets compressed for a while before the U.S. market opens: futures trade in a narro
post-image
SPYX-0.23%
NAS100-0.26%
BTC-0.08%
If this isn’t a malicious liquidation, I don’t know what is...
Just look at the “ungodly hour” they picked.
$I'm fucking here—down 12% in a day. At 0.0108, the bulls can barely keep their underwear on.
First, the bullish case: 1. A trading volume of 2.2M isn't especially low during a downtrend, which suggests buyers are absorbing the selling pressure rather than a one-sided panic sell-off; 2. The 24h low is the current price of 0.0108, and it didn't make a new low late in the session, showing signs of a short-term halt in the decline; 3. Meme tokens like this can be prone to a bounce after falling too fast, as sentiment can recover faster than fundamentals.
Now, the bearish case: 1. It slid steadily
$OGN #OGN
Breaking Bullish Pennant on 4H chart.
Positive breakout could lead 50-55% rise✍️
OGN+8.19%
Long FOMO $OGN
This trade carries short-term risk. Entry 1: 0.0315 – 0.0318 Entry 2: 0.0308 – 0.0312 Entry 3: 0.0293 – 0.0298 Take profit 1: 0.0375 Take profit 2: 0.0435 Take profit 3: 0.0535 Stop loss: 0.0268 Note: If the price falls below the 0.0293 support zone, the long trade will be at risk.
post-image
OGN+8.19%
$BTC has large liquidity to the upside
One at $84.5K and the other above $87K
IMO, MMs will hunt these shorts in the coming weeks
post-image
BTC-0.09%
Atomic paths settled 89% of the $1.63B liquidated on Ethereum lending venues over the past year.
Atomic liquidations depend on DEX liquidity. RWA collateral with thin pools and allowlisted transfers will push liquidations toward offchain market makers, RFQ and solvers.
post-image
ETH-1.35%
RWA+0.00%
Elon Musk: The only way to solve the U.S debt is for AI and robots
live-cover
LIVE1,888
📉 CoreWeave bonds plunged, and the market is recalculating the cost of financing AI growth.
💹 A CoreWeave dollar bond maturing in 2032 with a 9.625% coupon fell from its issue price of 100 to 79.50 on 2026/10/14, a pure price decline of 20.5%. Merely falling from 85 at the beginning of October to 79.50 represents another decline of approximately 6.47%. Over the same period, the market yield rose from 13.42% to 15.06%.
Creditors are beginning to ask: Can massive AI orders be converted into debt-service cash in time?
🧠 First, to clarify: 15.06% is the market yield; the fixed coupon remains 9.
post-image
CRWV-11.90%
NVDA-1.42%
MSFT-1.94%
The best degen crew... Agree?
post-image
I was wrong last round; today, I’ll make it right.
Last night at 20:22, I wrote that $SOL had no one taking the other side, so I wouldn’t chase it—the 1.36 odds weren’t worth it.
Twenty-four hours later, it has barely moved, up 0.3%.
At 5 a.m., it plunged to 101.17, then climbed back on its own.
Where was I wrong?
I only looked at the long/short ratio, not the volume.
That plunge involved 270,000 contracts; the previous candle had only 30,000.
It was stop-loss orders resting below that got hit, not longs giving up.
Now it’s back at 104.18, just 0.54% below 104.74 overhead.
Upside 0.54%, downs
post-image
SOL-1.39%
ARIAUSDT refusing to dump after the breakout. Price sitting right on the short-term MA while volume stays elevated. This looks like accumulation, not distribution.$ARIA ‌
post-image
ARIA+16.54%
  • 2
$GTC This 13% run-up was a bit too sharp. I’m still holding the unrealized profit on my long from 0.24, but my hand is hovering over the add button. Let’s be clear: the current price is 0.2591, the 24h high is 0.2832 and the low is 0.2187, with $110 million in trading volume—volume is there, but an upper wick has already formed. Chasing the price is just serving yourself up to the market manipulators.
My full plan has two parts. First, scale into longs on a pullback to the 0.248-0.252 range. This area lines up with the 0.382 retracement of the rally and a retest of the breakout above the previ
$SOL This price action looks a lot like last year’s rally at $ETH : whale wallets have been steadily selling, while retail traders keep piling in. Economic worries, rising oil prices, and weakness in tech and AI stocks are sending money to safe havens. Pick the wrong sector, and no matter how long you hold, you’re just waiting in vain. If you see it differently, share your reasoning.
#SOL
post-image
SOL-1.34%
ETH-1.35%
People have stopped laughing at Poland now…
Now ranking 3rd in GDP growth per Capita (3.9%) in Europe and among safest countries.
post-image
Load More

Join 40 M users in our growing community

⚡️ Join 40 M users in the crypto craze discussion

💬 Engage with your favorite top creators

👍 See what interests you

Trending Topics

USSeptemberPPIBeatsExpectations

91.35k Views1.93k Discussing

US September PPI came in at 6.3% YoY, well above the 5.3% market expectation, pointing to renewed producer-side inflation pressure. Weekly jobless claims were 199K, broadly in line with forecasts. Could hotter inflation further reduce room for rate cuts, and what does it mean for $BTC, US stocks, and gold?

GateWCTCS9GlobalTradingCompetition

37.87k Views6.77k Discussing

GateBTCAndETHFuturesVolumeRanksTop3

53.8k Views1.89k Discussing

View More