Square
Following
Hot
News
Notifications
Profile
Share your thoughts
placeholder
Article
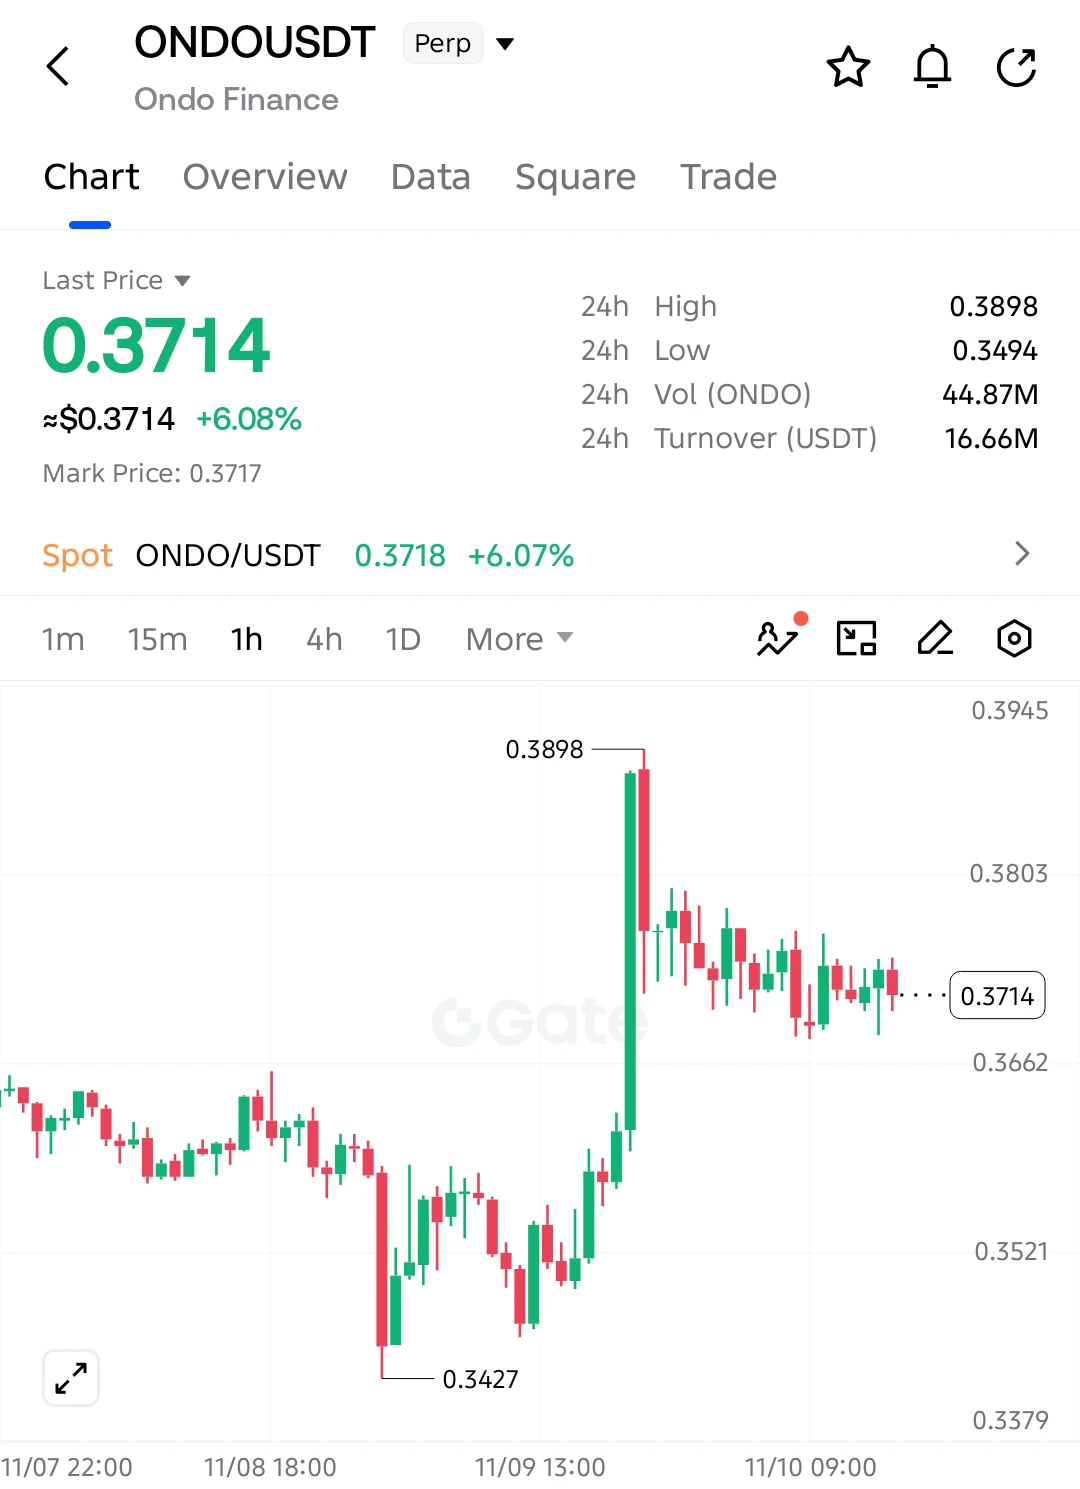
$ONDO LONG SETUP — BULLS READY FOR ANOTHER BREAKOUT!

$ONDO is holding strong after a sharp bullish move. Buyers are defending the breakout zone, and another rally could be building!

Entry: 0.3714
SL: 0.3650

TP1: 0.3760
TP2: 0.3803
TP3: 0.3898
Final Target: 0.4000

$ONDO surged over 6% and is now consolidating above key support. Holding 0.3662 keeps the bullish structure intact, while a breakout above 0.3803 could trigger another strong move toward 0.3898.

Invalidation: Sustained breakdown below 0.3650.

Bulls still have a chance to push higher!
post-image
ONDO-0.29%
India’s Ministry of External Affairs said that lobbying firms contacting Congress is standard practice in the United States. That’s true—whoever takes office has to play the K Street game in Washington. What’s really worth watching is which way the lobbying agenda tilts: trade or defense. That’s what could set the stage for the market’s next move. Maybe I’m wrong; I’ll wait to be proven wrong.
post-image
Trenches
PIEVERSE
P
bade
b
PIEVERSE
0x0e...25a9
Market Cap
$.
Change
.
24h Vol
$.
Holders
.
牛逼
牛
bade
b
牛逼
0x96...7777
Market Cap
$.
Change
.
24h Vol
$.
Holders
.
ON
O
bade
b
ON
0x0e...1d48
Market Cap
$.
Change
.
24h Vol
$.
Holders
.
STONK
S
bade
b
STONK
6GmA...UNgx
Market Cap
$.
Change
.
24h Vol
$.
Holders
.
FLOAT
F
bade
b
FLOAT
Bv1a...BMmr
Market Cap
$.
Change
.
24h Vol
$.
Holders
.
Kinetiq started with kHYPE, and its Elysium, positioned as Hyperliquid’s first L2, launched on mainnet on November 9, settling to HyperEVM and co-located with HyperCore. Within 15 hours of launch, onchain trading volume topped $100 million and addresses exceeded 474k, with activity initially flowing into token launches and Memes: Montra had issued about 58k tokens, and Boxa about 26k. Tokens associated with launch platforms made up three of the top five by market cap, with the highest, e/acc, at just $6.74 million, as asset supply outpaced accumulation.
MONTRA recorded about $7.63 million
post-image
HYPE+0.24%
MEME-0.94%
Jensen Huang makes his first airport appearance after being exposed for an affair: looking spirited in a Saint Laurent studded leather jacket.
Seems to be entering his rebellious phase—no matter what, my look has to be on point!🤟
is the BTC market can rebound illusion..
live-cover
LIVE1,917
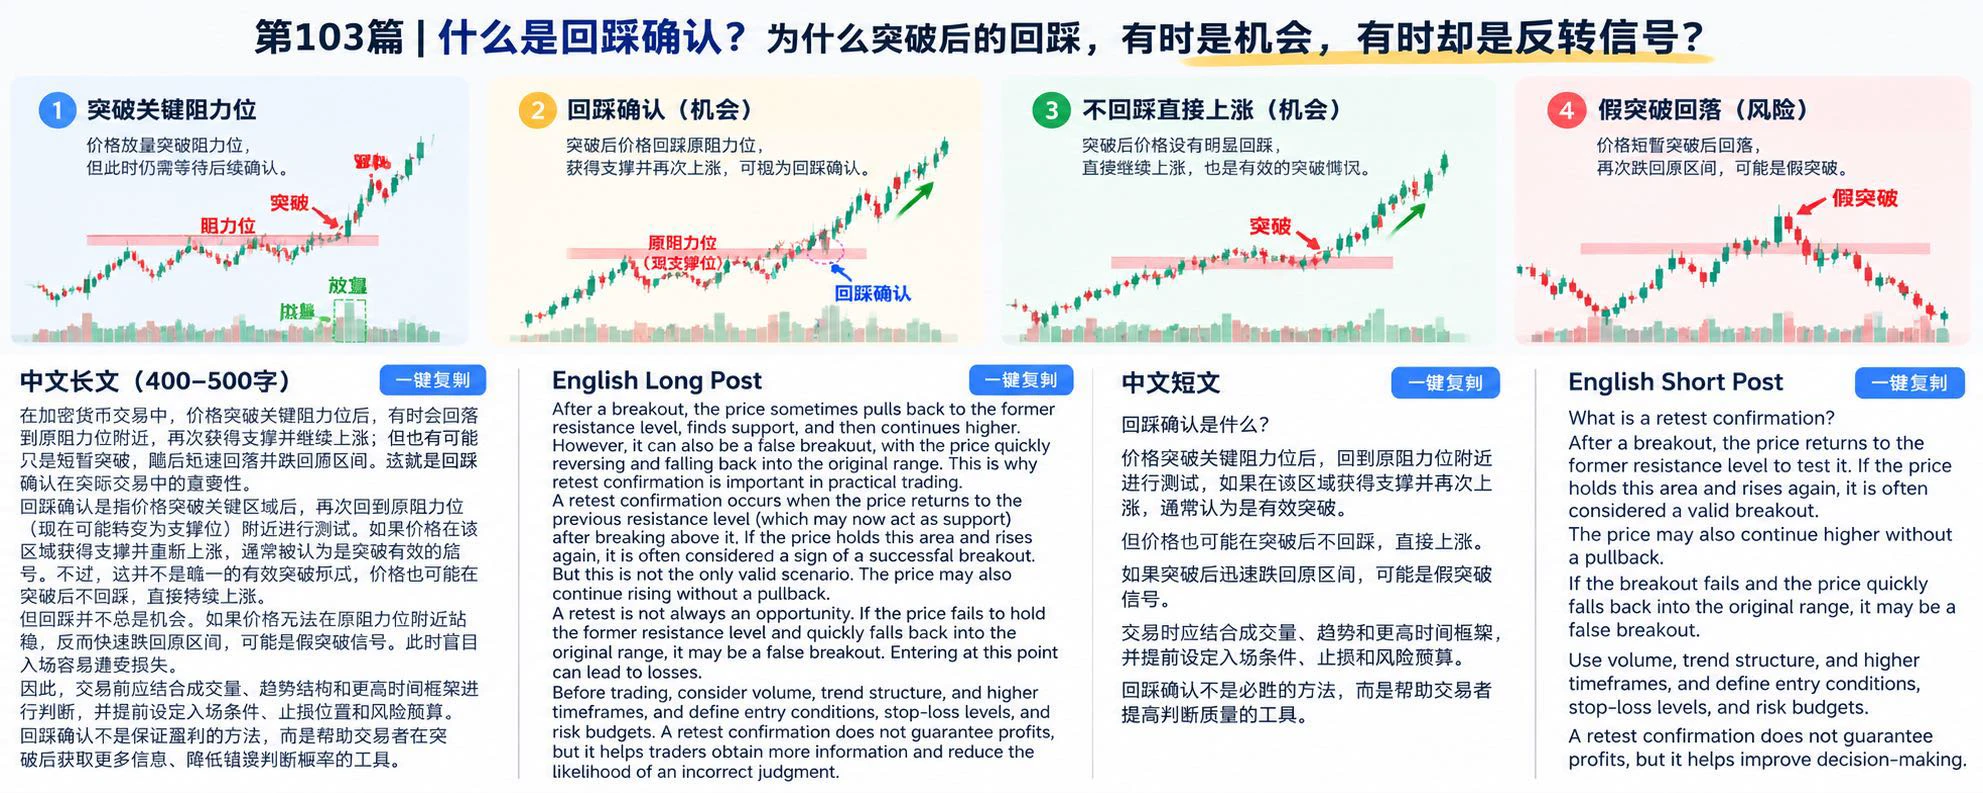
What Is Breakout Trading? How Can You Tell Whether to Enter or Wait for a Retest After Price Breaks Through a Key Area?

In cryptocurrency trading, when BTC breaks through a key resistance level, some traders chase the rally immediately, while others choose to wait for a retest. Both approaches have pros and cons. What really matters is not getting in before everyone else, but judging whether the breakout is likely to hold and planning for risk in advance.

First, what is breakout trading?

Breakout trading involves looking for trading opportunities according to predefined rules after the pric
post-image
BTC-0.67%
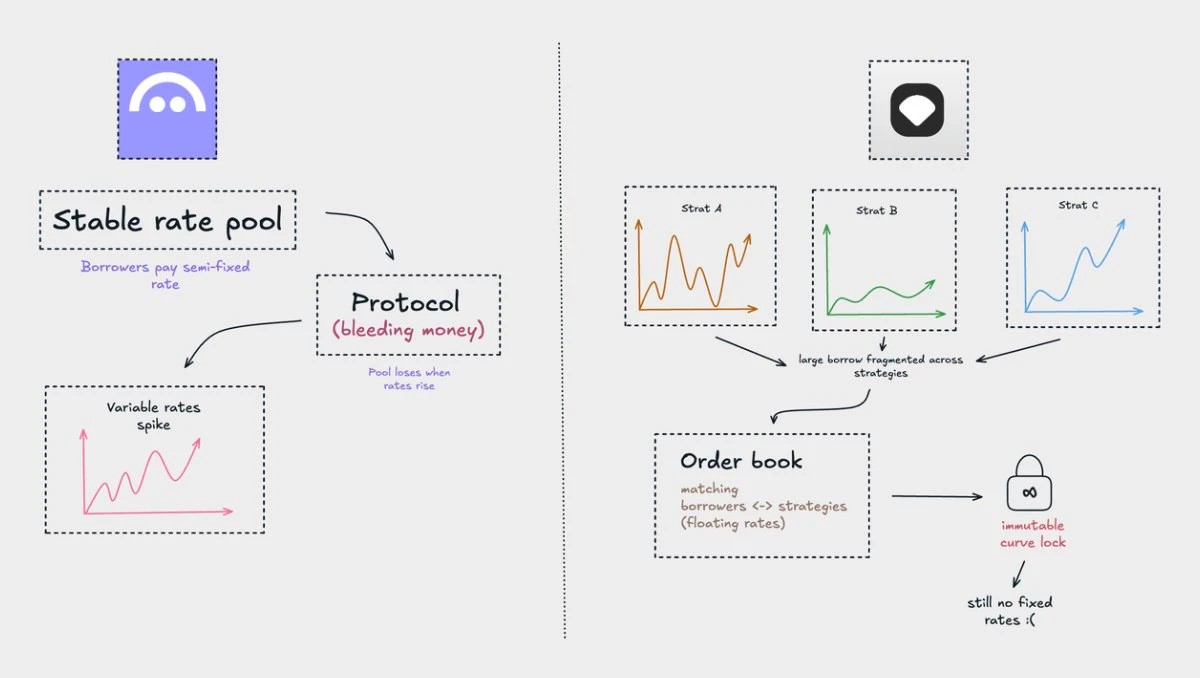
By solving old problems, you create new ones. Or why @avon_xyz avoided @aave's stable-rate failures… and introduced a different set of problems instead.
Avon never locked rates. Everything stays floating and isolated, so no semi-fixed rates, no public rebalance function, and no protocol silently losing money when variable rates rise above fixed rates.
In exchange…
- Interest curves are locked forever after deployment. Lenders get certainty… but you also can’t fix a bad or outdated strategy when the market moves.
- Strategies must update their tick levels on the order book whenever utilization
post-image
AAVE-1.22%
MEGA+0.26%
ETH-1.26%
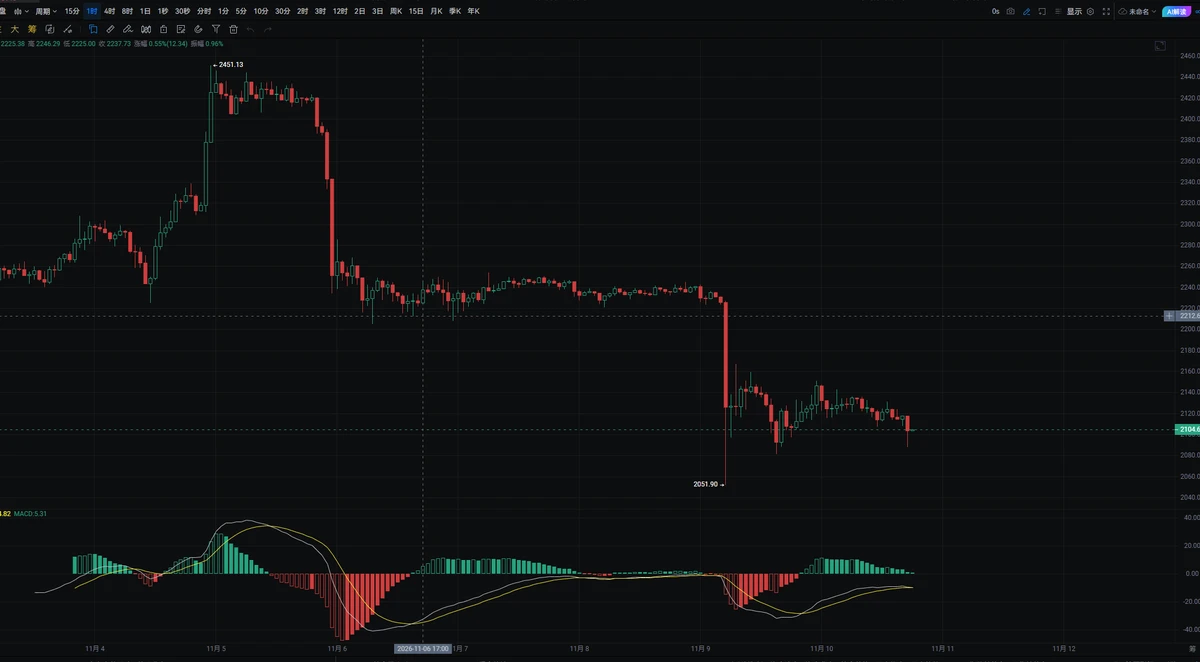
#ETH At the current price of 2105, ETH is still tracking BTC closely. The ETH/BTC ratio has continued to decline recently, and ETH is clearly underperforming Bitcoin, making an independent rebound difficult. The first short-term resistance is around 2150–2170, a range where ETH has faced selling pressure several times recently. For ETH to strengthen, BTC needs to hold above 76000, and ETH needs to break above this range on higher volume before it has a chance to test around 2220. The first support below is 2080, a key level to defend for now. If ETH breaks down along with BTC, the next support
post-image
ETH-1.26%
BTC-0.67%
🔹Goldman Sachs CEO Remains Bullish on Computing Infrastructure! Data Center Demand Continues to Sur
live-cover
LIVE2,149
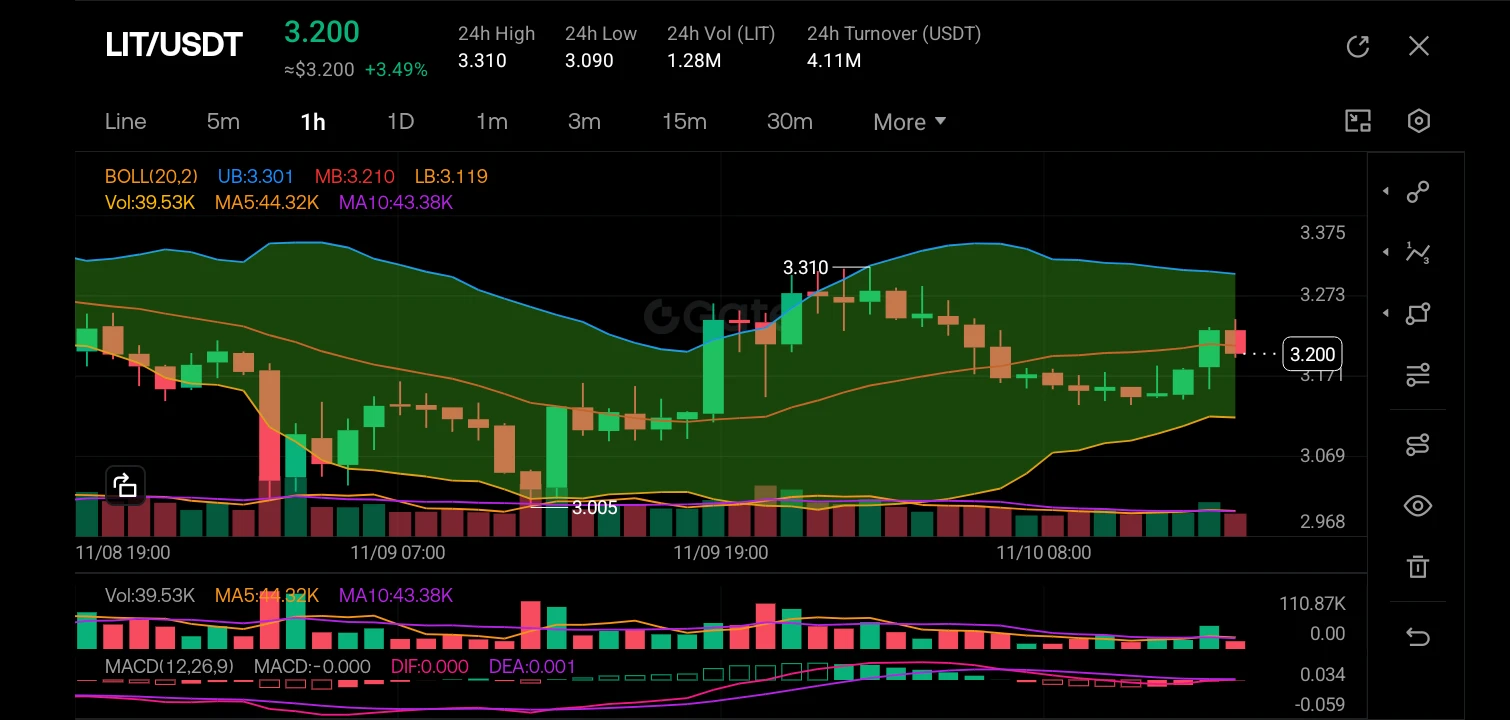
$LIT ‌#GateGlobalComplianceExpansion

Market Structure Change: The market structure has recently shifted from a defined downtrend (marked by the drop from 3.310 down to the 3.005 liquidity grab) into a bullish reversal, establishing a new higher low and breaking local resistance to current trade at 3.200 (+3.49%).

K-Line Analysis: We are seeing strong bullish momentum with consecutive green candles pushing the price above the middle Bollinger Band (MB: 3.210). The price is currently testing the upper band (UB: 3.301), indicating volatility expansion to the upside, while MACD shows a bullish
post-image
LIT-4.56%
  • 2
What Is Volume-Price Divergence? Why Might Trading Volume Gradually Decline While Prices Keep Setting New Highs?

In cryptocurrency trading, when the price of BTC continues to rise without a corresponding increase in trading volume, this phenomenon warrants attention. It may indicate a change in market participation, or suggest that the sustainability of the current trend needs further verification. However, volume-price divergence is not an inevitable reversal signal and must be assessed in the context of price structure and market conditions.

First, what is volume-price divergence?

Volume-
BTC-0.67%
$Star i am buying the bottom
Next $Aria like 600%
ARIA+22.03%
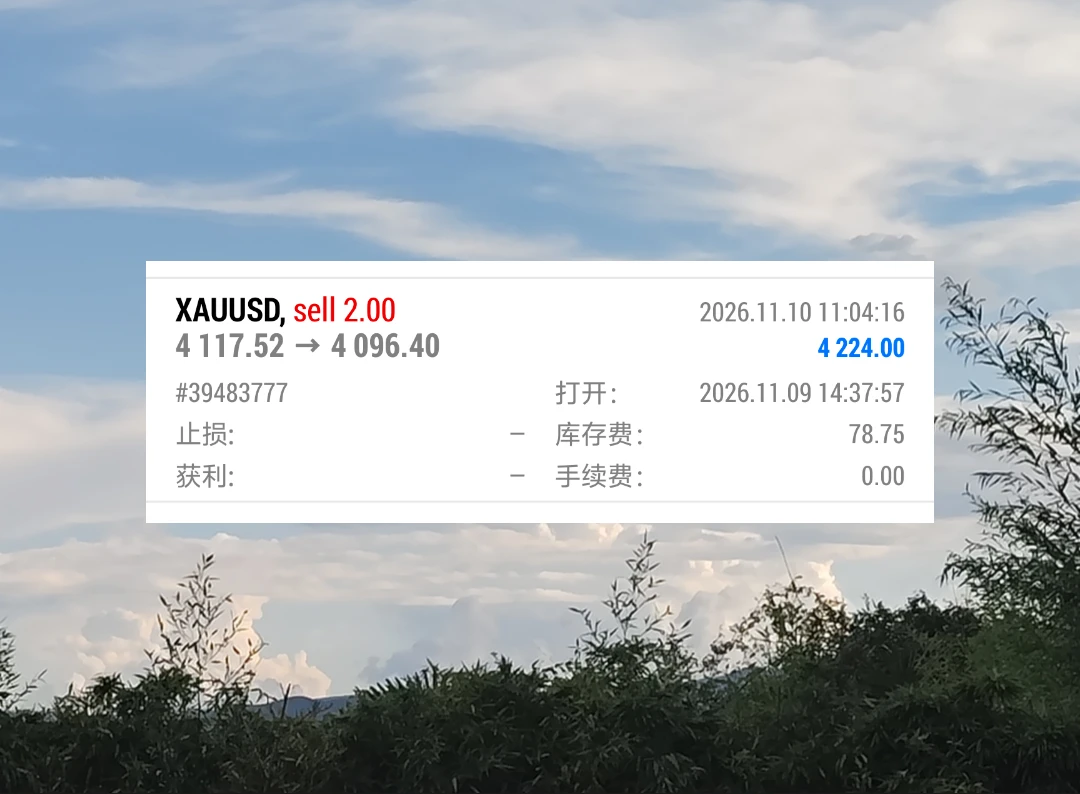
As soon as Waller spoke, gold printed a spike. What was meant to be a short-term trade turned into a small swing trade: entered at 4117, rode it for 21 points, and banked $4224.
$BTC $XAU #Gate全球合规版图扩展 #美伊谈判出现新进展 #标普500创7个月最大涨幅 #AVAX利好短时上涨6.4%
post-image
BTC-0.65%
XAU+0.38%
🚀 SUI/USDT Deep Dive: Testing Crucial Support – Reversal or Further Consolidation? 📊

Hey Gate.io family! Let's take a comprehensive look at SUI/USDT as it navigates a fascinating price zone. SUI is currently trading around $0.8415, showing a +2.13% recovery over the last 24 hours.

Here is a complete technical breakdown across multiple timeframes to help you map out your next trade!

📈 Market Snapshot & Key Metrics
Current Price: ~$0.8415 (+2.13%)

24h High / Low: $0.8697 / $0.8188

24h Volume: 11.93M SUI

24h Turnover: 10.10M USDT

Sector: Layer 1 🌐

🔍 Technical Analysis & Price Action
SUI-1.01%
  • 1
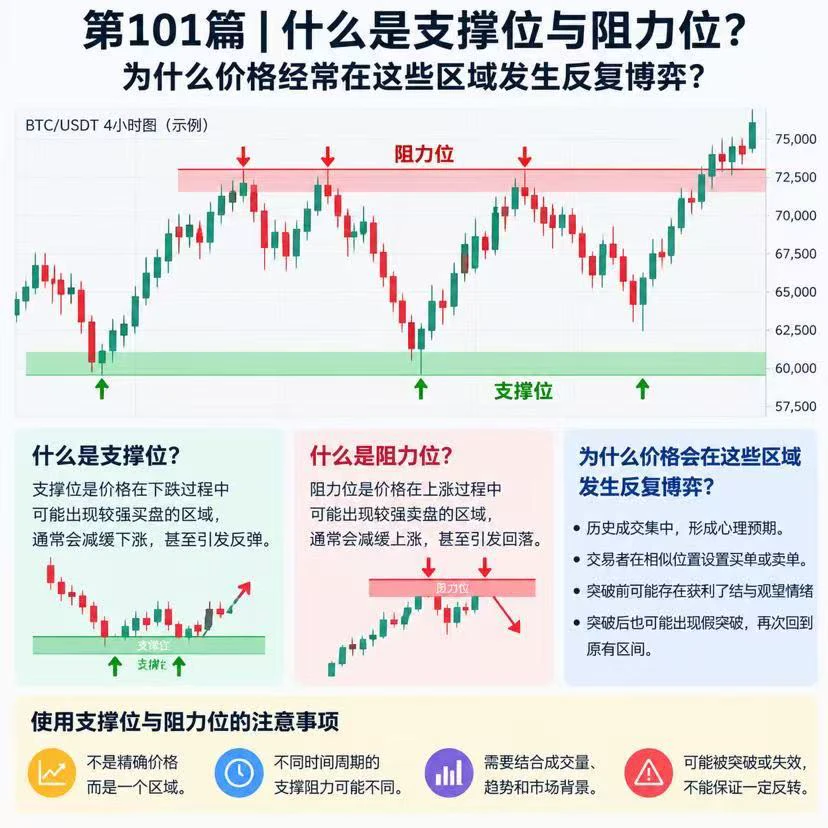
What Are Support and Resistance Levels? Why Does Price Often See Repeated Battles in These Areas?

In cryptocurrency trading, BTC may sometimes rebound after falling to a certain area, or pull back after rising to another area. These recurring price reaction points are often related to support and resistance levels. But they are not precise boundaries that guarantee a price reversal; rather, they are important tools that help traders analyze market structure.

First, what is a support level?

A support level is a price area where stronger buying may emerge during a decline, potentially slowing
post-image
BTC-0.67%
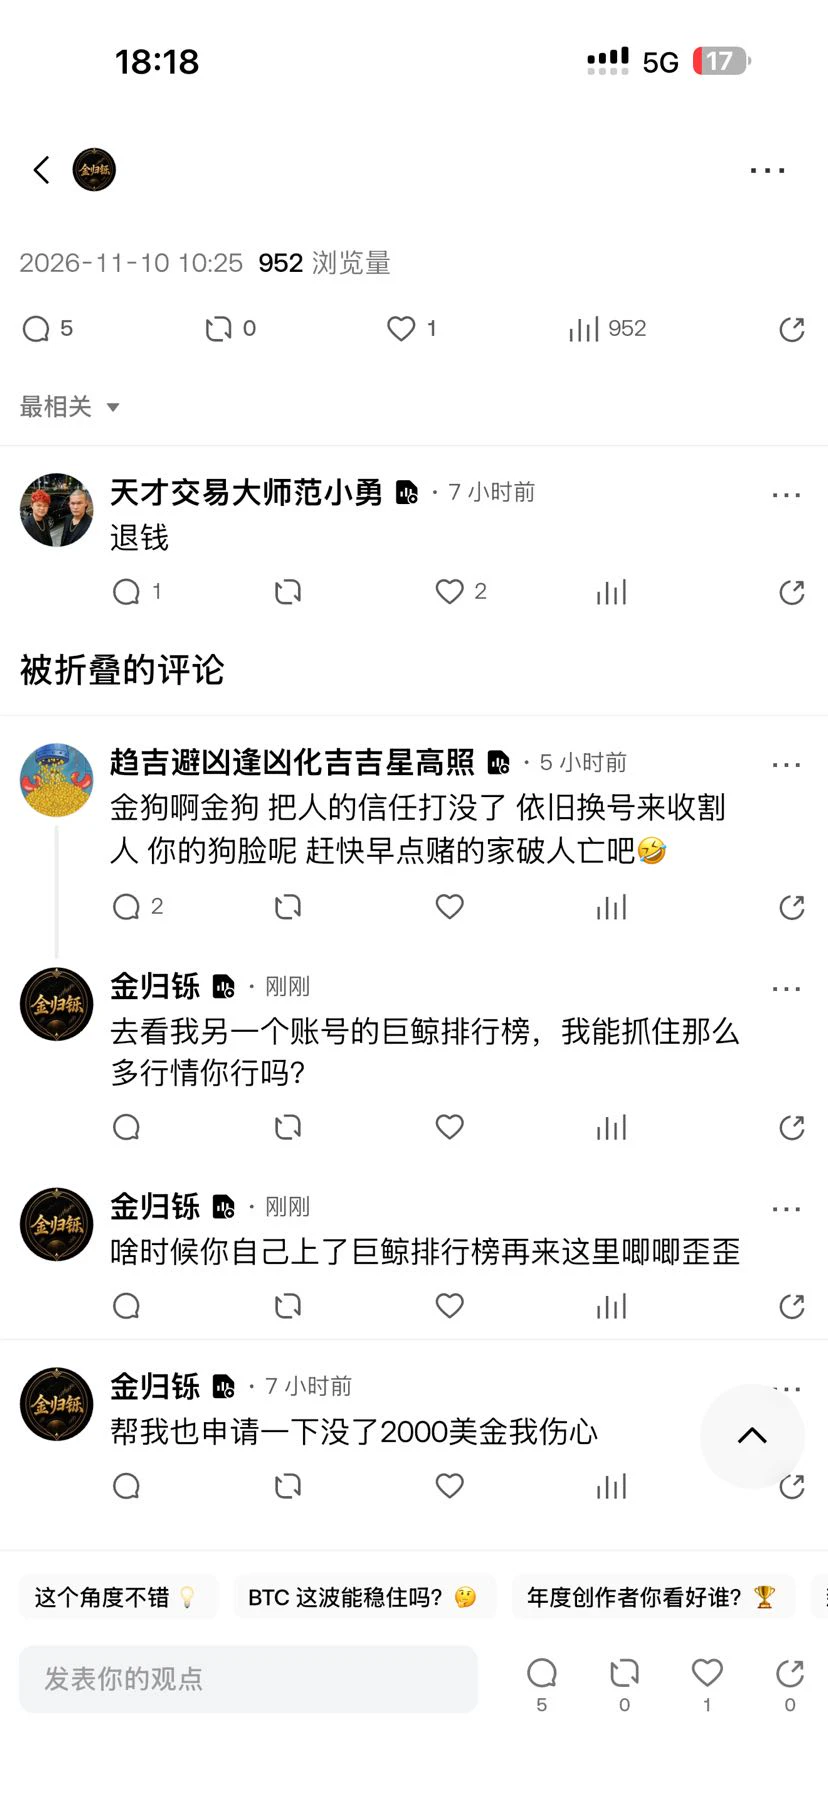
All that whining.
I've managed to survive in this market for so long, and I'm still profitable so far.
post-image
  • 2
🇰🇪 Will crypto remain "anonymous" in Kenya?
WHAT HAPPENED?
In its Nov 6 report, the IMF told Kenya that crypto firms should share sender and receiver ID and wallet details (FATF Travel Rule).
WHY?
Kenya has been on the FATF grey list since Feb 2024, and P2P trading is very popular there.
WHAT'S NEXT?
The IMF wants this rule included in the new VASP Regulations. Kenya has not made any decision yet.
Privacy or compliance, which side are you on?
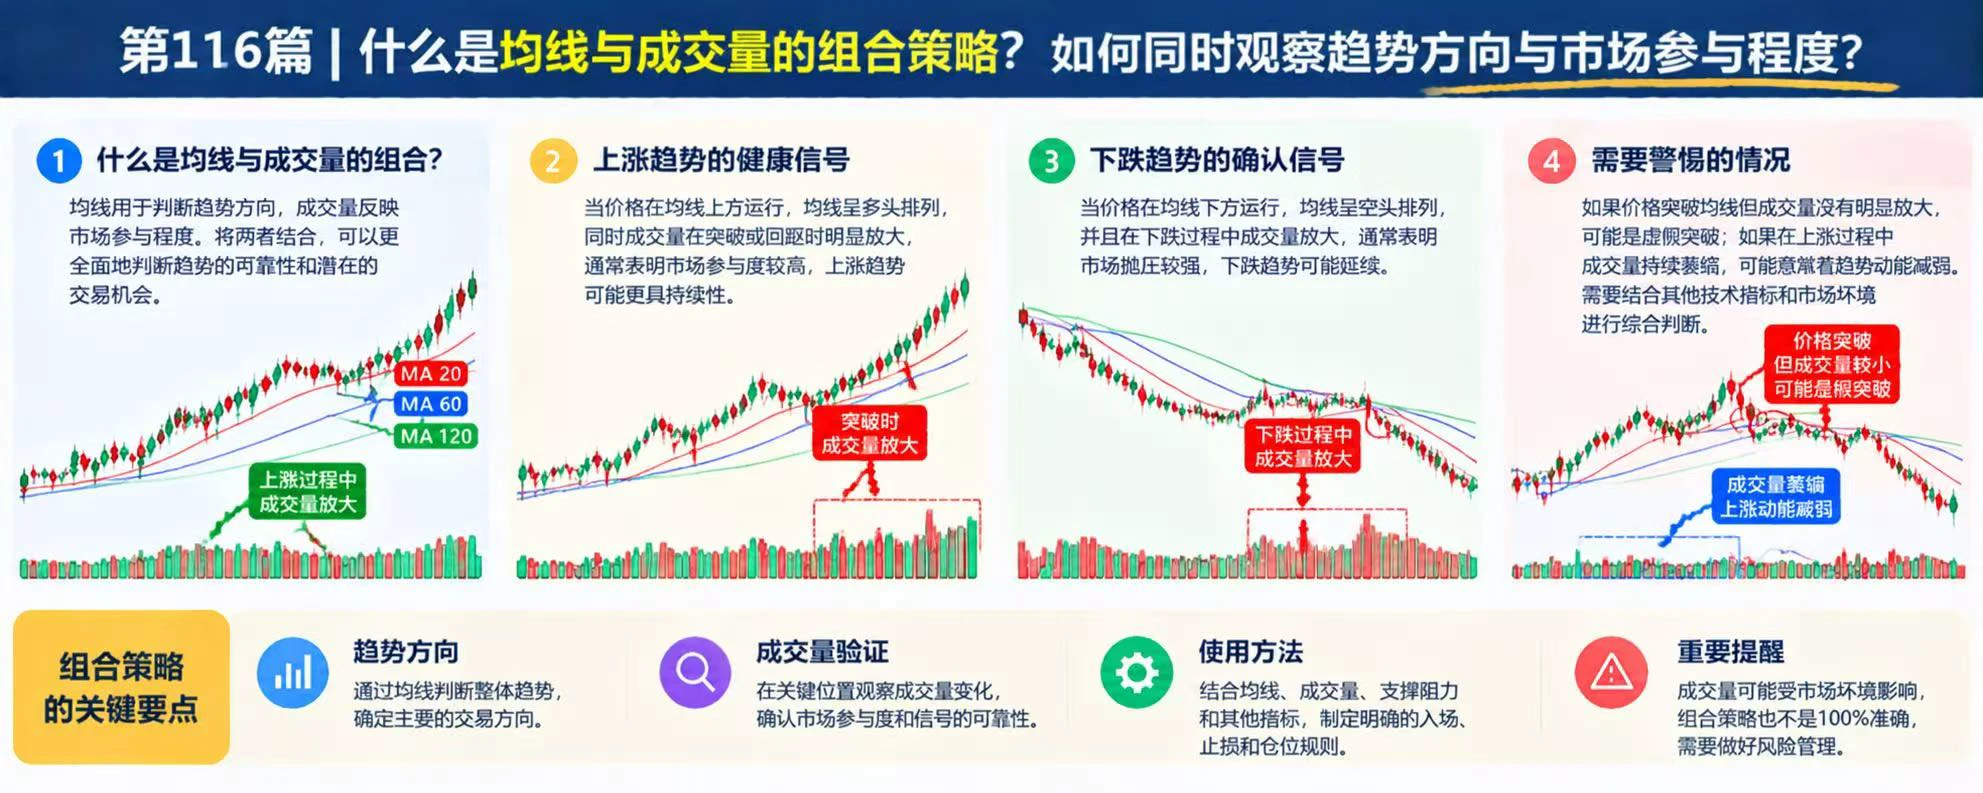
What Is a Moving Average and Volume Combination Strategy? How Can You Observe Trend Direction and Market Participation at the Same Time?

In cryptocurrency trading, rising prices do not necessarily indicate a strong trend, and an upward-sloping moving average does not mean the market cannot reverse. Moving averages (MAs) help assess trend direction, while volume reflects market activity. Combining the two provides a more comprehensive way to assess the credibility of breakouts and trend continuations.

First, what do moving averages and volume each show?

Moving averages smooth historical pric
post-image
Two aircraft carriers and a slew of destroyers deployed to the Middle East—that’s a blockade posture, not a get-ready-to-fight posture. What Jones said is the key: They’re in a strong position, but will they actually use it? In other words, the cards are on the table; now it’s a matter of who blinks first. Oil transport and shipping insurance premiums will move first, so don’t wait for the headlines. Do you think this is maximum pressure or are they really about to act? We’ll know in two weeks.
post-image
Load More

Join 40 M users in our growing community

⚡️ Join 40 M users in the crypto craze discussion

💬 Engage with your favorite top creators

👍 See what interests you

Trending Topics

GateGlobalComplianceExpansion

646 Views202 Discussing

Gate continues to expand its global compliance footprint, now covering 81 regulated jurisdictions across Europe, North America, Asia, and Oceania. From MiCA and U.S. state-level MTLs to Japan’s FSA, Dubai, and Australia-related regulatory approvals, global exchanges are entering a new stage of compliance competition. Do you think regulatory strength will become as important as products and liquidity for exchanges in the future?

USCPIDataIncoming

56.23k Views2.3k Discussing

USIranTalksShowNewProgress

10.54k Views1.29k Discussing

View More