Square
Following
Hot
News
Notifications
Profile
Share your thoughts
placeholder
Article
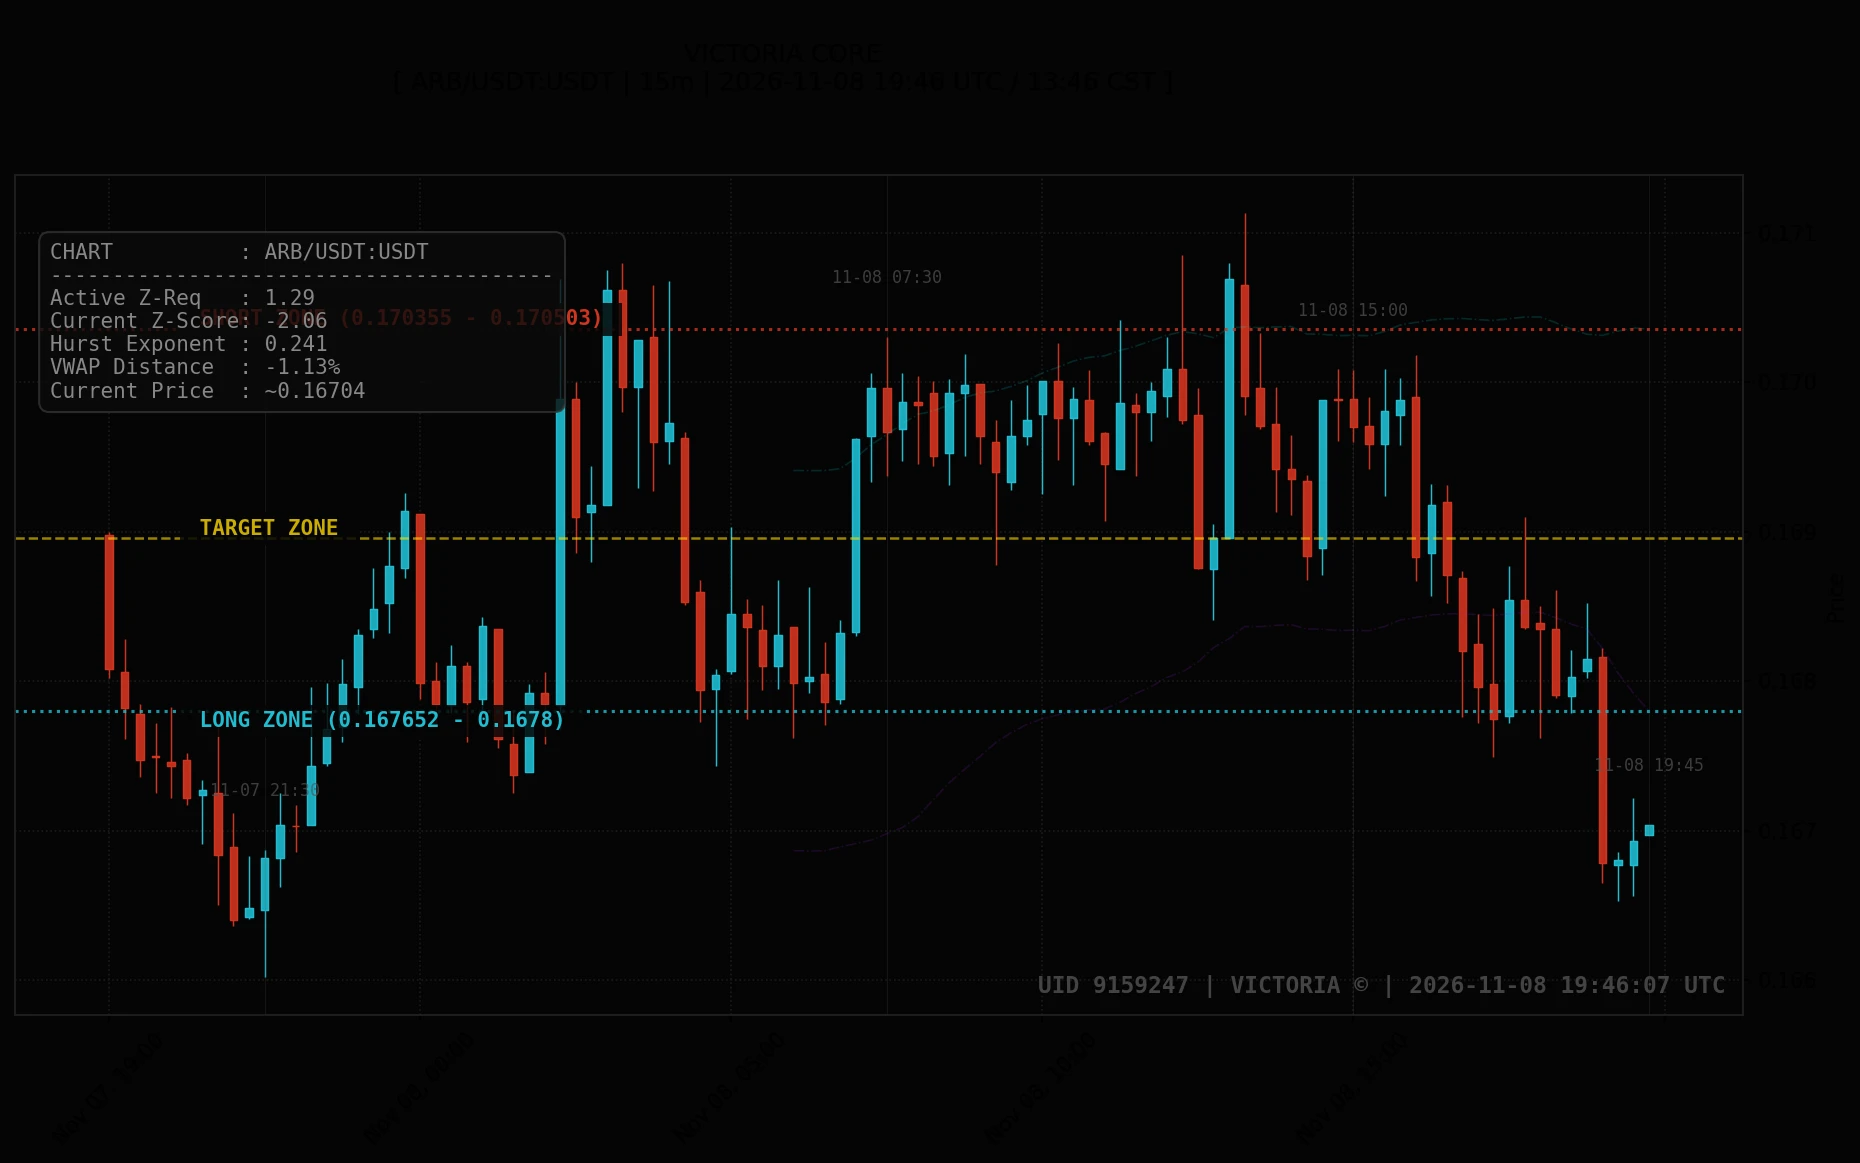
2026-11-08 19:46 UTC. ARB/USDT trades at ~0.16704 USDT in an extended discount structure, offering mean-reversion buyers an attractive risk-to-reward window if support at 0.16653 holds firmly. For safe execution, wait for price confirmation at LONG ZONE (0.167652 - 0.1678 USDT) targeting TARGET ZONE (~0.168955 USDT), while guarding against unexpected volatility with SHORT ZONE (0.170355 - 0.170503 USDT).

In secondary tracking, XRP/USDT at ~1.1544 USDT sits lower mid-range between LONG ZONE (1.15188 - 1.15267 USDT), SHORT ZONE (1.16618 - 1.16696 USDT), and TARGET ZONE (~1.15982 USDT). Finally
post-image
ARB+1.17%
XRP-1.15%
BTC-0.67%
#70%OfAltcoinsFallBelow200DMA
Market Observation: 70% of Altcoins Now Below 200DMA

Recent data from CryptoQuant analyst Darkfost indicates a notable shift in the altcoin market structure. According to the report, approximately 70% of altcoins are currently trading below their 200-day moving average (200DMA). This is a sharp increase from early October, when the figure was around 10%.

The 200DMA is a widely used technical indicator to gauge longer-term market trends. A broad breakdown below this level often indicates a shift in market momentum toward a bearish phase or a period of prolonged
Trenches
ZIG
Z
bade
b
ZIG
0x8c...1145
Market Cap
$.
Change
.
24h Vol
$.
Holders
.
STONK
S
bade
b
STONK
6GmA...UNgx
Market Cap
$.
Change
.
24h Vol
$.
Holders
.
BTC
B
bade
b
BTC
C5xp...pump
Market Cap
$.
Change
.
24h Vol
$.
Holders
.
MAGGIE
M
bade
b
MAGGIE
8rHo...PmZV
Market Cap
$.
Change
.
24h Vol
$.
Holders
.
CLAUDIA
C
bade
b
CLAUDIA
2j5S...W2ZM
Market Cap
$.
Change
.
24h Vol
$.
Holders
.
This is bad—even a Microsoft construction site has been broken into! These massive protests erupting across Europe could end up dealing a serious blow to the global expansion of AI computing capacity.

On November 8, 2026, more than 100 civil society organizations across 15 European countries suddenly joined forces to launch large-scale protests, demanding a complete halt to all new large data center construction. The streets of Ireland and Finland are already packed, and the Netherlands has gone even further: protesters stormed a Microsoft data center construction site that was still halfway
post-image
MSFT-0.95%
With everything going on in the Middle East, the thing to watch most closely isn’t who’s making threats—it’s the Strait of Hormuz. If that waterway gets choked off, oil prices jump first, then freight and insurance costs rise, and it all eventually gets passed on to what you and I pay for gas and groceries. The hardest part of trading isn’t calling the direction; it’s waiting for a signal you can understand. What are you seeing on your end? I’m keeping my eyes on oil. #MiddleEastSituation
post-image
market update
live-cover
LIVE78
*#StakeOnLaunchpoolToShare450KVLX — New Rewards Pool Live*

Stake on Launchpool to share *450K VLX* in rewards! A major opportunity for the Velas community to earn passive rewards.

*How it works:*
1. *Stake:* Deposit your tokens into the Launchpool. Choose flexible or locked options.
2. *Rewards Pool:* Tokens are collected into a shared rewards pool, distributed in real-time.
3. *Earn:* Claim your staking rewards anytime and withdraw staked + rewards.

*Key Benefits:*
Secure & Non-Custodial, Competitive APY up to 18.5% dynamic, Flexible Staking, and Transparent On-Chain activity.

With ove
post-image
VLX+0.00%
⛽ Venezuelan Gas to Colombia: Relief for the Bolívar and P2P?
While Venezuela debates the price of USDT on the P2P market, a decision is taking shape across the border that could shift the flow of foreign currency: Colombia confirmed that its natural gas deficit is pushing it to buy more than 40% of its consumption from abroad, and one of the routes under consideration runs through the Antonio Ricaurte binational gas pipeline, which connects the two countries.
🔹 The Neighbor’s Diagnosis: Low Reserves and Declining Supply
Colombia’s Minister of Mines and Energy, María Nohemi Arboleda, laid out
post-image
$NEAR holding inside this channel for almost 3 years. Despite pulling back some to return to the track line here on the Weekly, we're still sitting above both the 50W and 200W MAs lol.
Zooming in a tad on the Daily, it looks like we're approaching some possible support close to the $3.40 area. But ultimately, still waiting on something to confirm a flip out of this downtrend.
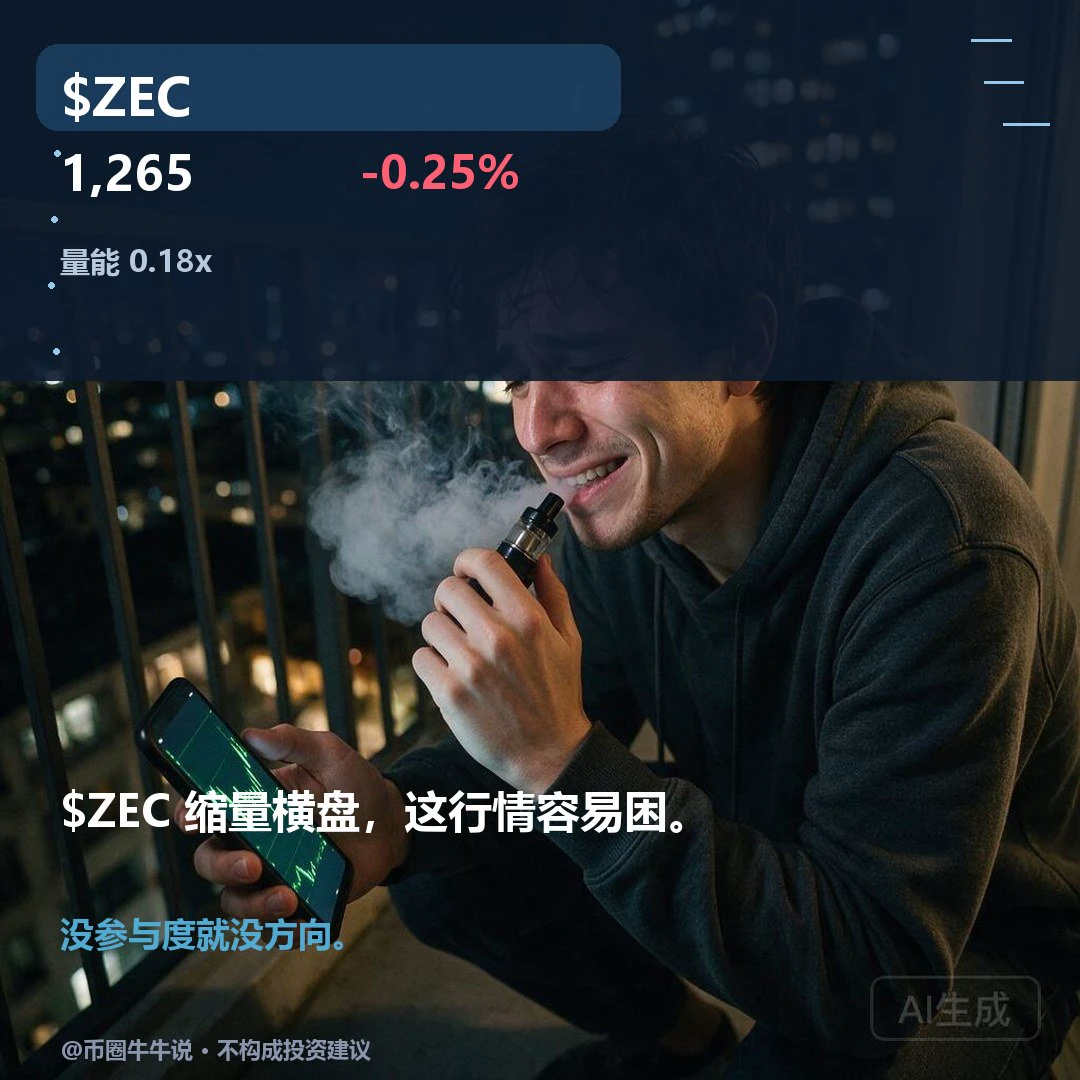
$ZEC Current price: 1264.8, 24H -0.25% (1236.64–1290.0). 1H is weak: RSI 51.45/EMA20 1266.02, support 1236.64/resistance 1290.0; 4H is weak: RSI 43.77/EMA20 1278.39, support 1213.33/resistance 1388.0. The upside condition is holding above the 1290.0 resistance level; the downside condition is breaking below the 1236.64 support level. Review whether 1290.0 can hold and whether price can recover after losing 1236.64; the volume ratio is 0.18x, and the setup is invalid without participation confirmation. Markets are volatile; for observation only.
post-image
ZEC+1.16%
$ETH Account abstraction has been talked about for ages. The news finally landed, but the price didn’t budge. There’s only one reason: TVL growth is inflated—no fresh money came in; it’s just old funds being shuffled around. A figure like $289.97M isn’t enough to fuel a real breakout. If it can’t hold, it’s a fake move. Don’t chase it. I’m watching the weekend numbers. If you think I’m talking nonsense, save this screenshot. If you’re following along, follow #DeFi
post-image
ETH-1.26%
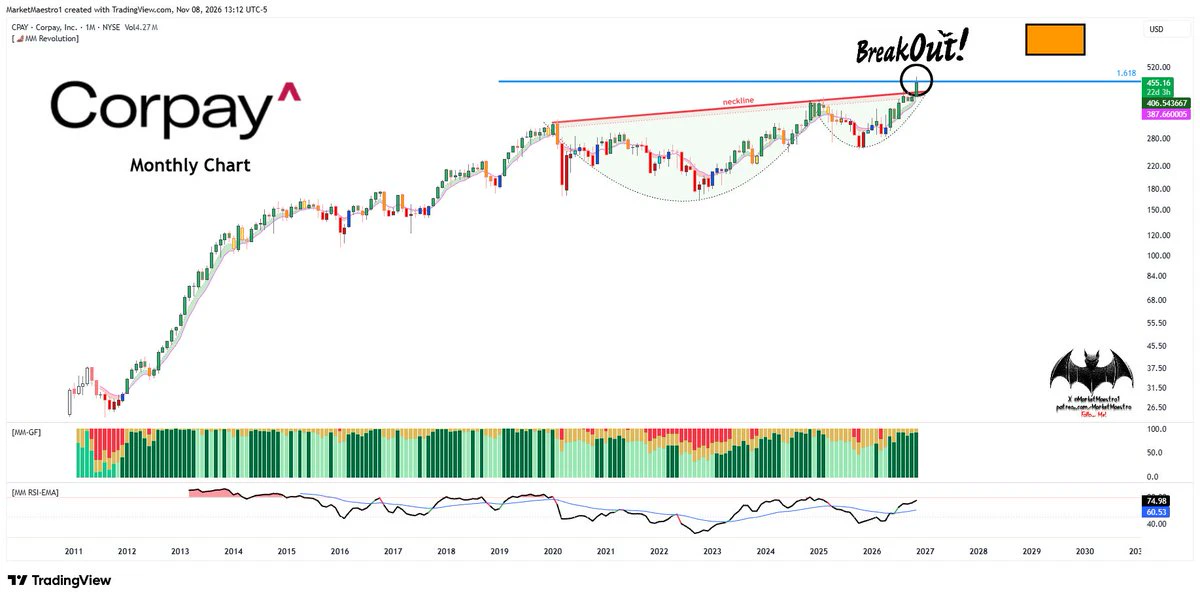
$CPAY
We haven’t seen bullish setups like this in a long time. It reached a key resistance level but broke out 💥 of its cup+handle pattern
post-image
CPAY+1.98%
$SKYAI almost shook me out on this move. A few days ago, it was bottoming around 0.0302. I saw volume keep shrinking and thought I’d wait a little longer. Then a bullish candle shot it up to 0.0411. I chased at 0.038, and my nerves went straight out the window—when it rose, I feared a pullback; when it fell, I feared getting stuck. In the end, I sold half around 0.0363 and made just enough for lunch. One lesson: when it’s moving sideways on low volume, don’t keep thinking “it might go a little lower.” Set a stop-loss at 0.033 and get in when it hits—that’s better than staring at the chart. It’
SKYAI-7.58%
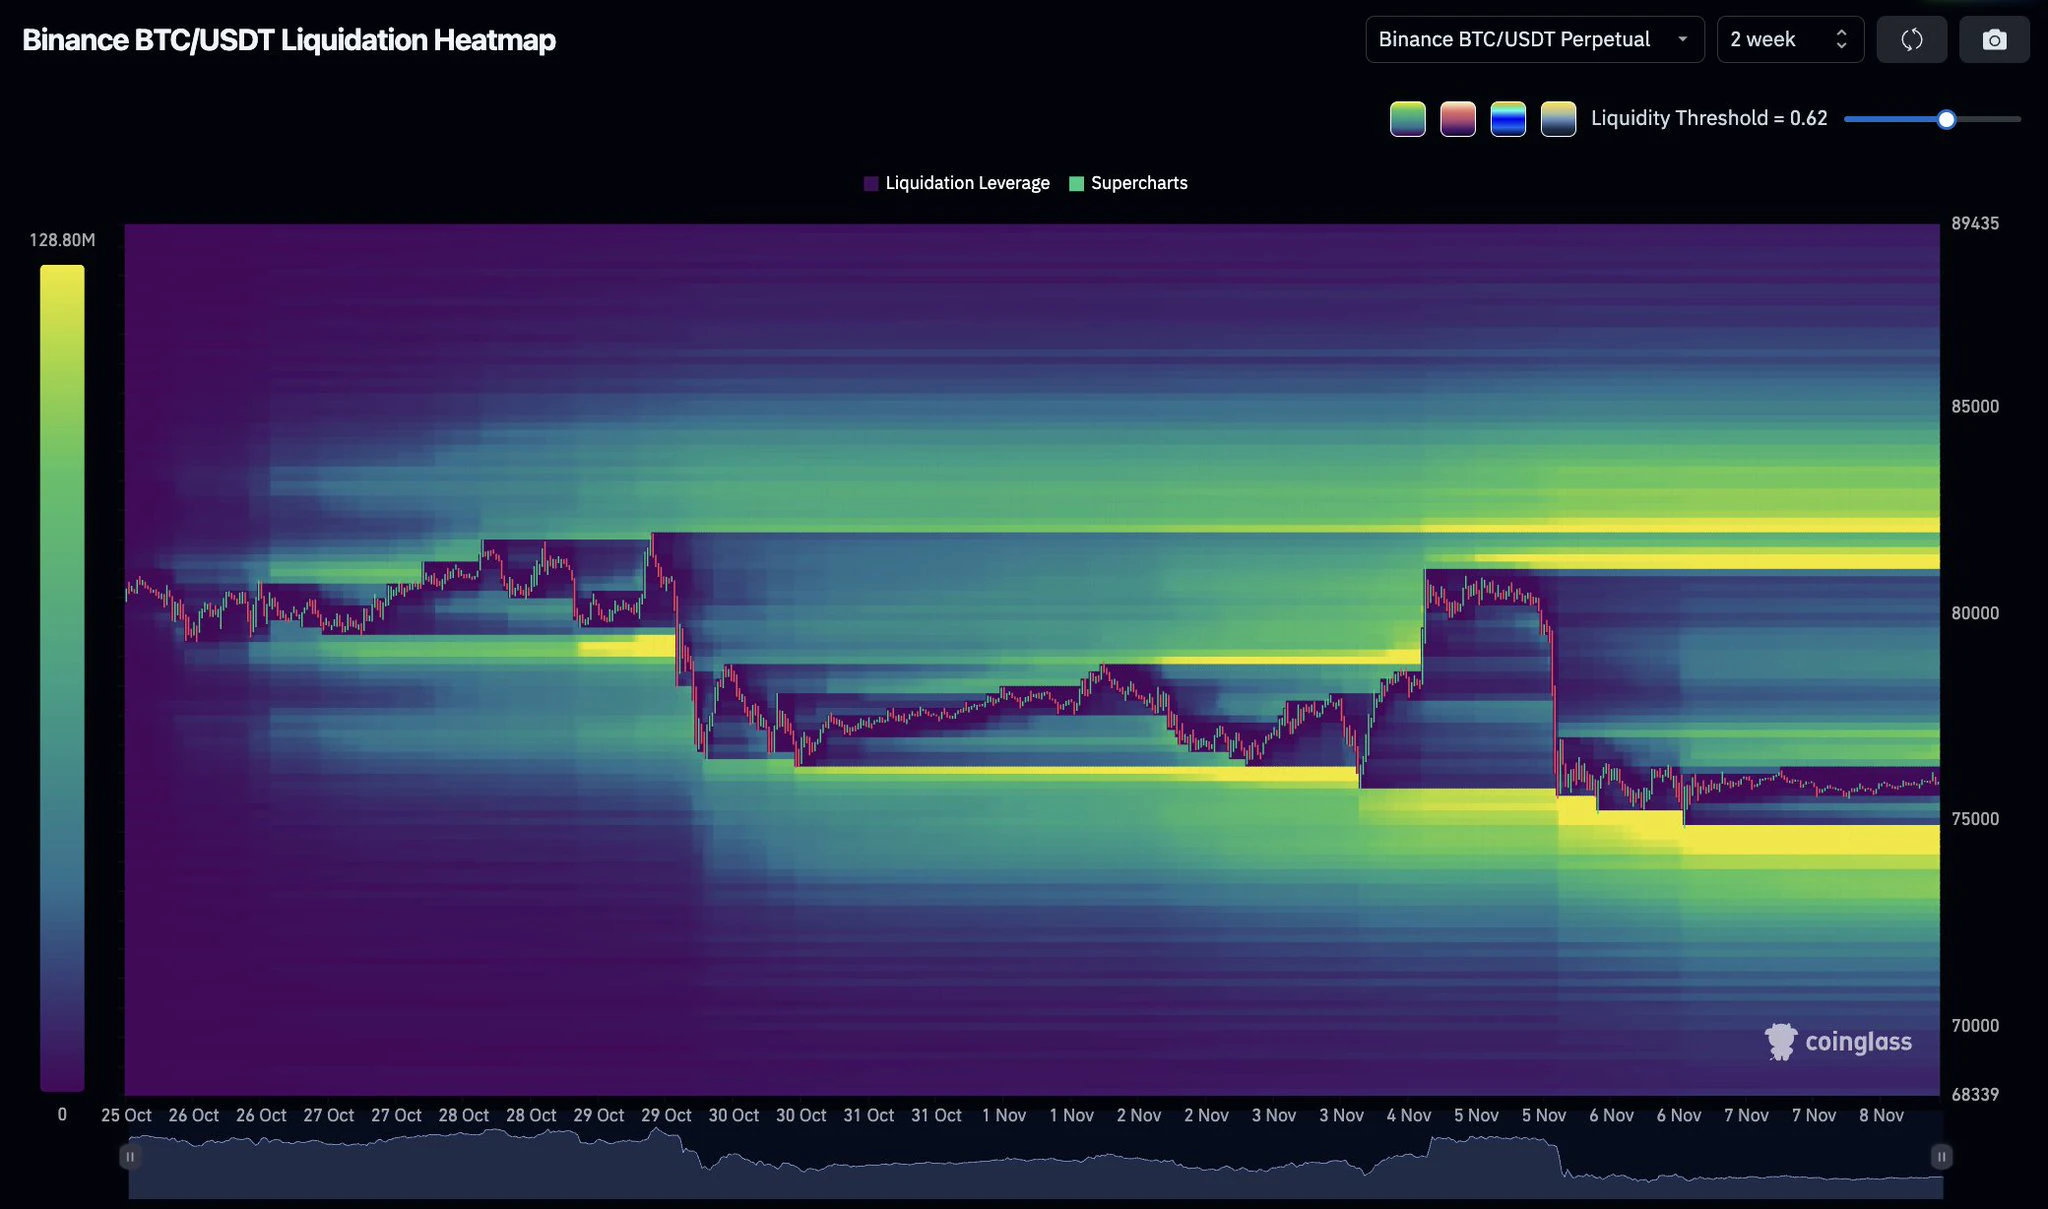
$BTC is near $76,000 with major liquidation clusters on BOTH sides.

Longs around $74,000 to $75,000.
Shorts around $81,000 to $82,000.

Which side gets swept first? 👇

#USCPIDataIncoming
#USAIStocksHitHard
post-image
BTC-0.65%
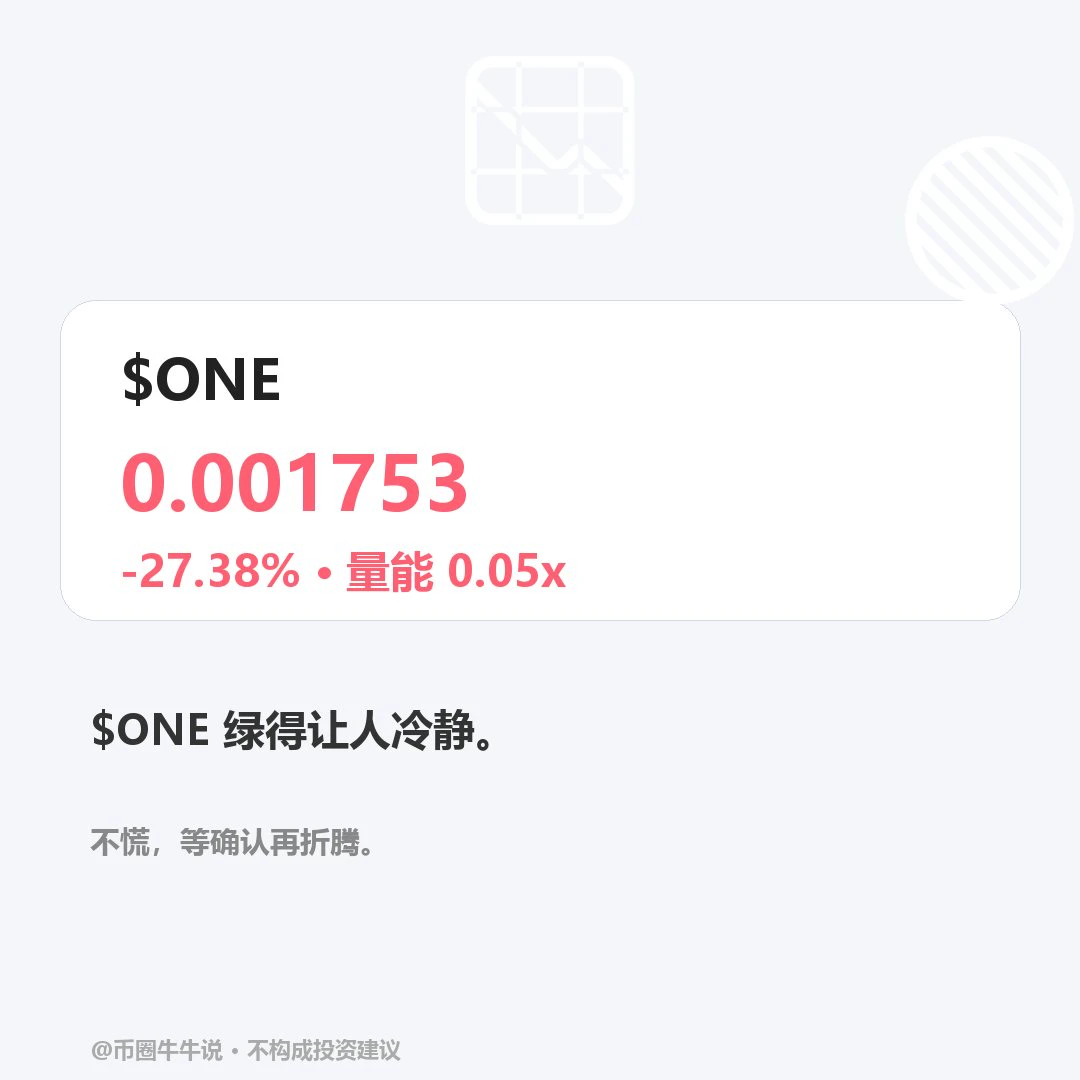
$ONE Current price: 0.001753, 24H -27.38% (0.001692–0.00243). 1H is weak: RSI 35.79/EMA20 0.001896, support at 0.001692/resistance at 0.00243; 4H is strong: RSI 54.93/EMA20 0.001732, support at 0.001027/resistance at 0.002476. The upside condition is holding above the 0.00243 resistance; the downside condition is breaking below the 0.001692 support. Review whether price can hold above 0.00243 and recover after losing 0.001692; the volume ratio is 0.051x, and the setup is invalid without confirmation of participation. Market volatility is high; for observation only.
post-image
I'm trading on Gate, a top-tier exchange with a 13-year track record. Come join me and dive into the hottest events right now! https://www.gate.com/campaigns/6848?ref=VLARBF1YAG&ref_type=132&utm_cmp=ImN6yTAn
post-image
  • 2
#StockTalkSeason
📈 StockTalkSeason: The Time to Understand Markets, Discover Opportunities, and Build a Stronger Investment Mindset!
StockTalkSeason is here, bringing investors, traders, market analysts, and financial enthusiasts together to discuss the latest developments in the global financial markets. It is more than just a conversation about stock prices. It is an opportunity to exchange ideas, explore market trends, understand economic developments, and learn how smart investment decisions can create long-term opportunities.
In today's rapidly changing financial environment, staying in
BTC-0.67%
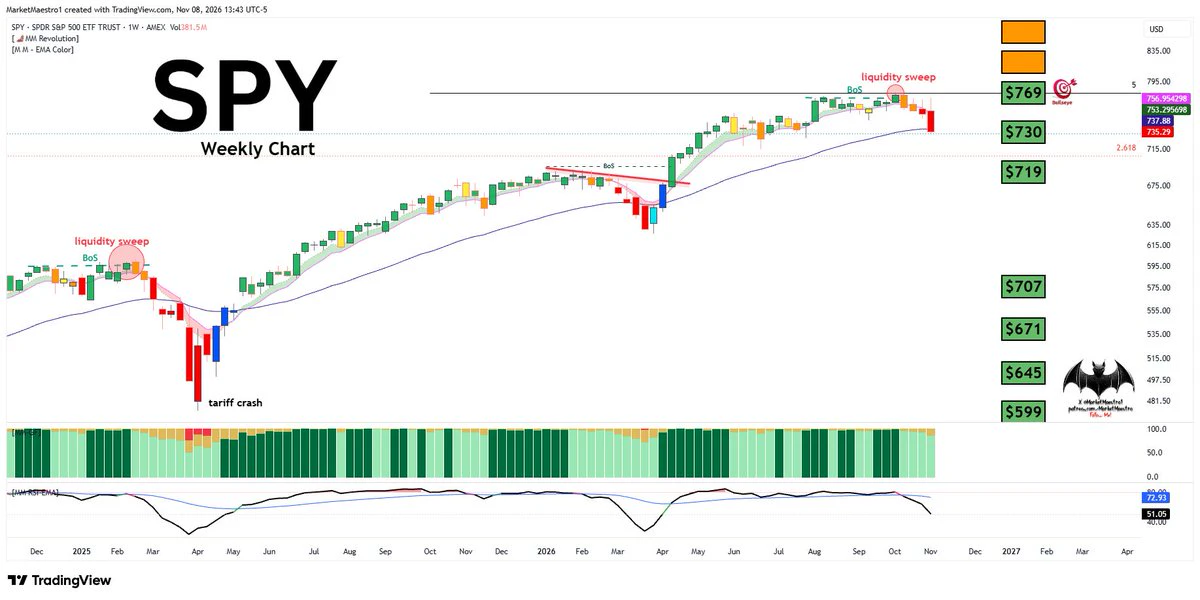
$SPY
A sharp correction began after the liquidity sweep. The last time we saw a pattern like this was during the tariff crash. A move below $740 means the correction has started. Below $736, selling pressure will continue
post-image
SPY+0.06%
Load More

Join 40 M users in our growing community

⚡️ Join 40 M users in the crypto craze discussion

💬 Engage with your favorite top creators

👍 See what interests you

Trending Topics

USCPIDataIncoming

14.34k Views1.66k Discussing

The U.S. October CPI report will be released on November 10 at 8:30 a.m. ET. September CPI came in at 3.7% year over year, and markets will be watching closely for signs that inflation is cooling, especially in core CPI. A softer-than-expected reading could strengthen rate-cut expectations, while hotter inflation may pressure risk assets through higher Treasury yields and a stronger dollar. How do you think this CPI print will move $BTC, U.S. stocks and gold?

USAIStocksHitHard

28.78k Views3.74k Discussing

USNonfarmPayrolls

55.32k Views4.5k Discussing

View More