Square
Following
Hot
News
Profile
Share your thoughts
placeholder
Article
Now that $AVAX has fallen to its current level, the easiest illusion to fall for is that a larger drop necessarily means it is already cheap.
I’m watching just one divergence: whether it can quickly recover after breaking below 9.764. The current price is 10.177, with volume at 0.45x. The 1-hour and 4-hour trends are both weak, with RSI at 29 and 28, respectively.
If it breaks above 11.261 and volume continues to increase, the initiative will shift toward the bulls; if it breaks below 9.764 and fails to recover, the short-term assessment is invalidated. Stop trying to guess the bottom for
post-image
AVAX-8.55%
$VIX - The longest stretch in a while without any major spikes. Usually we bottom or top around triple witching, but lately the past few has remained in a range. Market either isn't scared of downside or is preparing for a big move.
post-image
I did nothing—just went to the restroom, and by the time I came back, the candlestick chart had already done the work for me. A few days ago in the afternoon, I only wanted to see whether $BOME would offer a pullback opportunity, but unexpectedly, it started moving up the moment I sat down.

As the price formed a bottom intraday, I saw buying pressure strengthen, while the pullback held the key level. I judged that funds were quietly entering, so I suggested a long entry around 0.0009974. At that point, the market had not fully started moving yet, and many people were still watching from the
post-image
BOME+1.06%
XRP-2.65%
SOL-5.04%
This isn’t a rebound—it’s CPR for my empty account, right? No, a long-position account; either way, I woke up to see the account dancing.
When I checked the chart right after lunch, $ZZZ pulled back to 0.00751 and held, buying pressure strengthened, and funds quietly entered. I didn’t wait for a big bullish candle and signaled Open Long. The view was that it was bottoming out without breaking down, so it was worth taking. Stay bullish and hold if it doesn’t break; exit if it does.
The afternoon gave us the answer directly: the price reached 0.0103, with a return of +370.06%. Feels good, broth
post-image
ZZZ+23.95%
BTC-1.74%
SNDK-4.68%
$TIA Current price 0.517, 24h +15.76%, trading volume 21.2M USDT, funding rate +0.0050%, Fear & Greed Index 64 (Greed). On the moving-average front, MA5=0.5036 has crossed above MA20=0.484465, the MACD histogram at +0.003991 remains bullish, RSI 63.0 is not yet overbought, and the Bollinger upper band at 0.52355 is right overhead. Assessment: Bulls have the upper hand, but the price is already pressing against the upper band and the funding rate has turned positive, creating a short-term structure that is “strong but crowded.”
A funding rate of +0.0050% means longs must pay to hold positions,
post-image
ZRO-10.57%
$DOGE Current price: 0.08442. In the short term, key support is the lower Bollinger Band at 0.08142, while resistance above is the MA20 at 0.08582.
Comparing with the mainstream coins in the same sector: $BN is quoted at 736.01, down 4.45% over 24h, with RSI falling to 33.0 and the MACD bearish bar at -1.48, showing more pronounced weakness; $DOGE is down 4.90%, but its RSI of 38.6 remains higher than BNB, while its funding rate of -0.0063% is the most negative among the three, indicating the highest level of short crowding—once sentiment recovers, it may instead have greater short-squeeze
post-image
DOGE-4.96%
BNB-4.50%
HYPE-4.06%
$Q Looking back at this trade, I entered too late and exited too early; emotions replaced the plan. Next time, set the stop-loss first before taking action.#Gate.io 📈 #Gate广场中秋团圆局
Dump it to 60K, make them think Bitcoin will go to 40K
Good now pump it to 82K
Let them think the bottom is in
Good now dump it to 57K and make them think its going to 40K again
Now pump it back to 87K
Good now bring out the 10/10 exec file...
post-image
BTC-1.80%
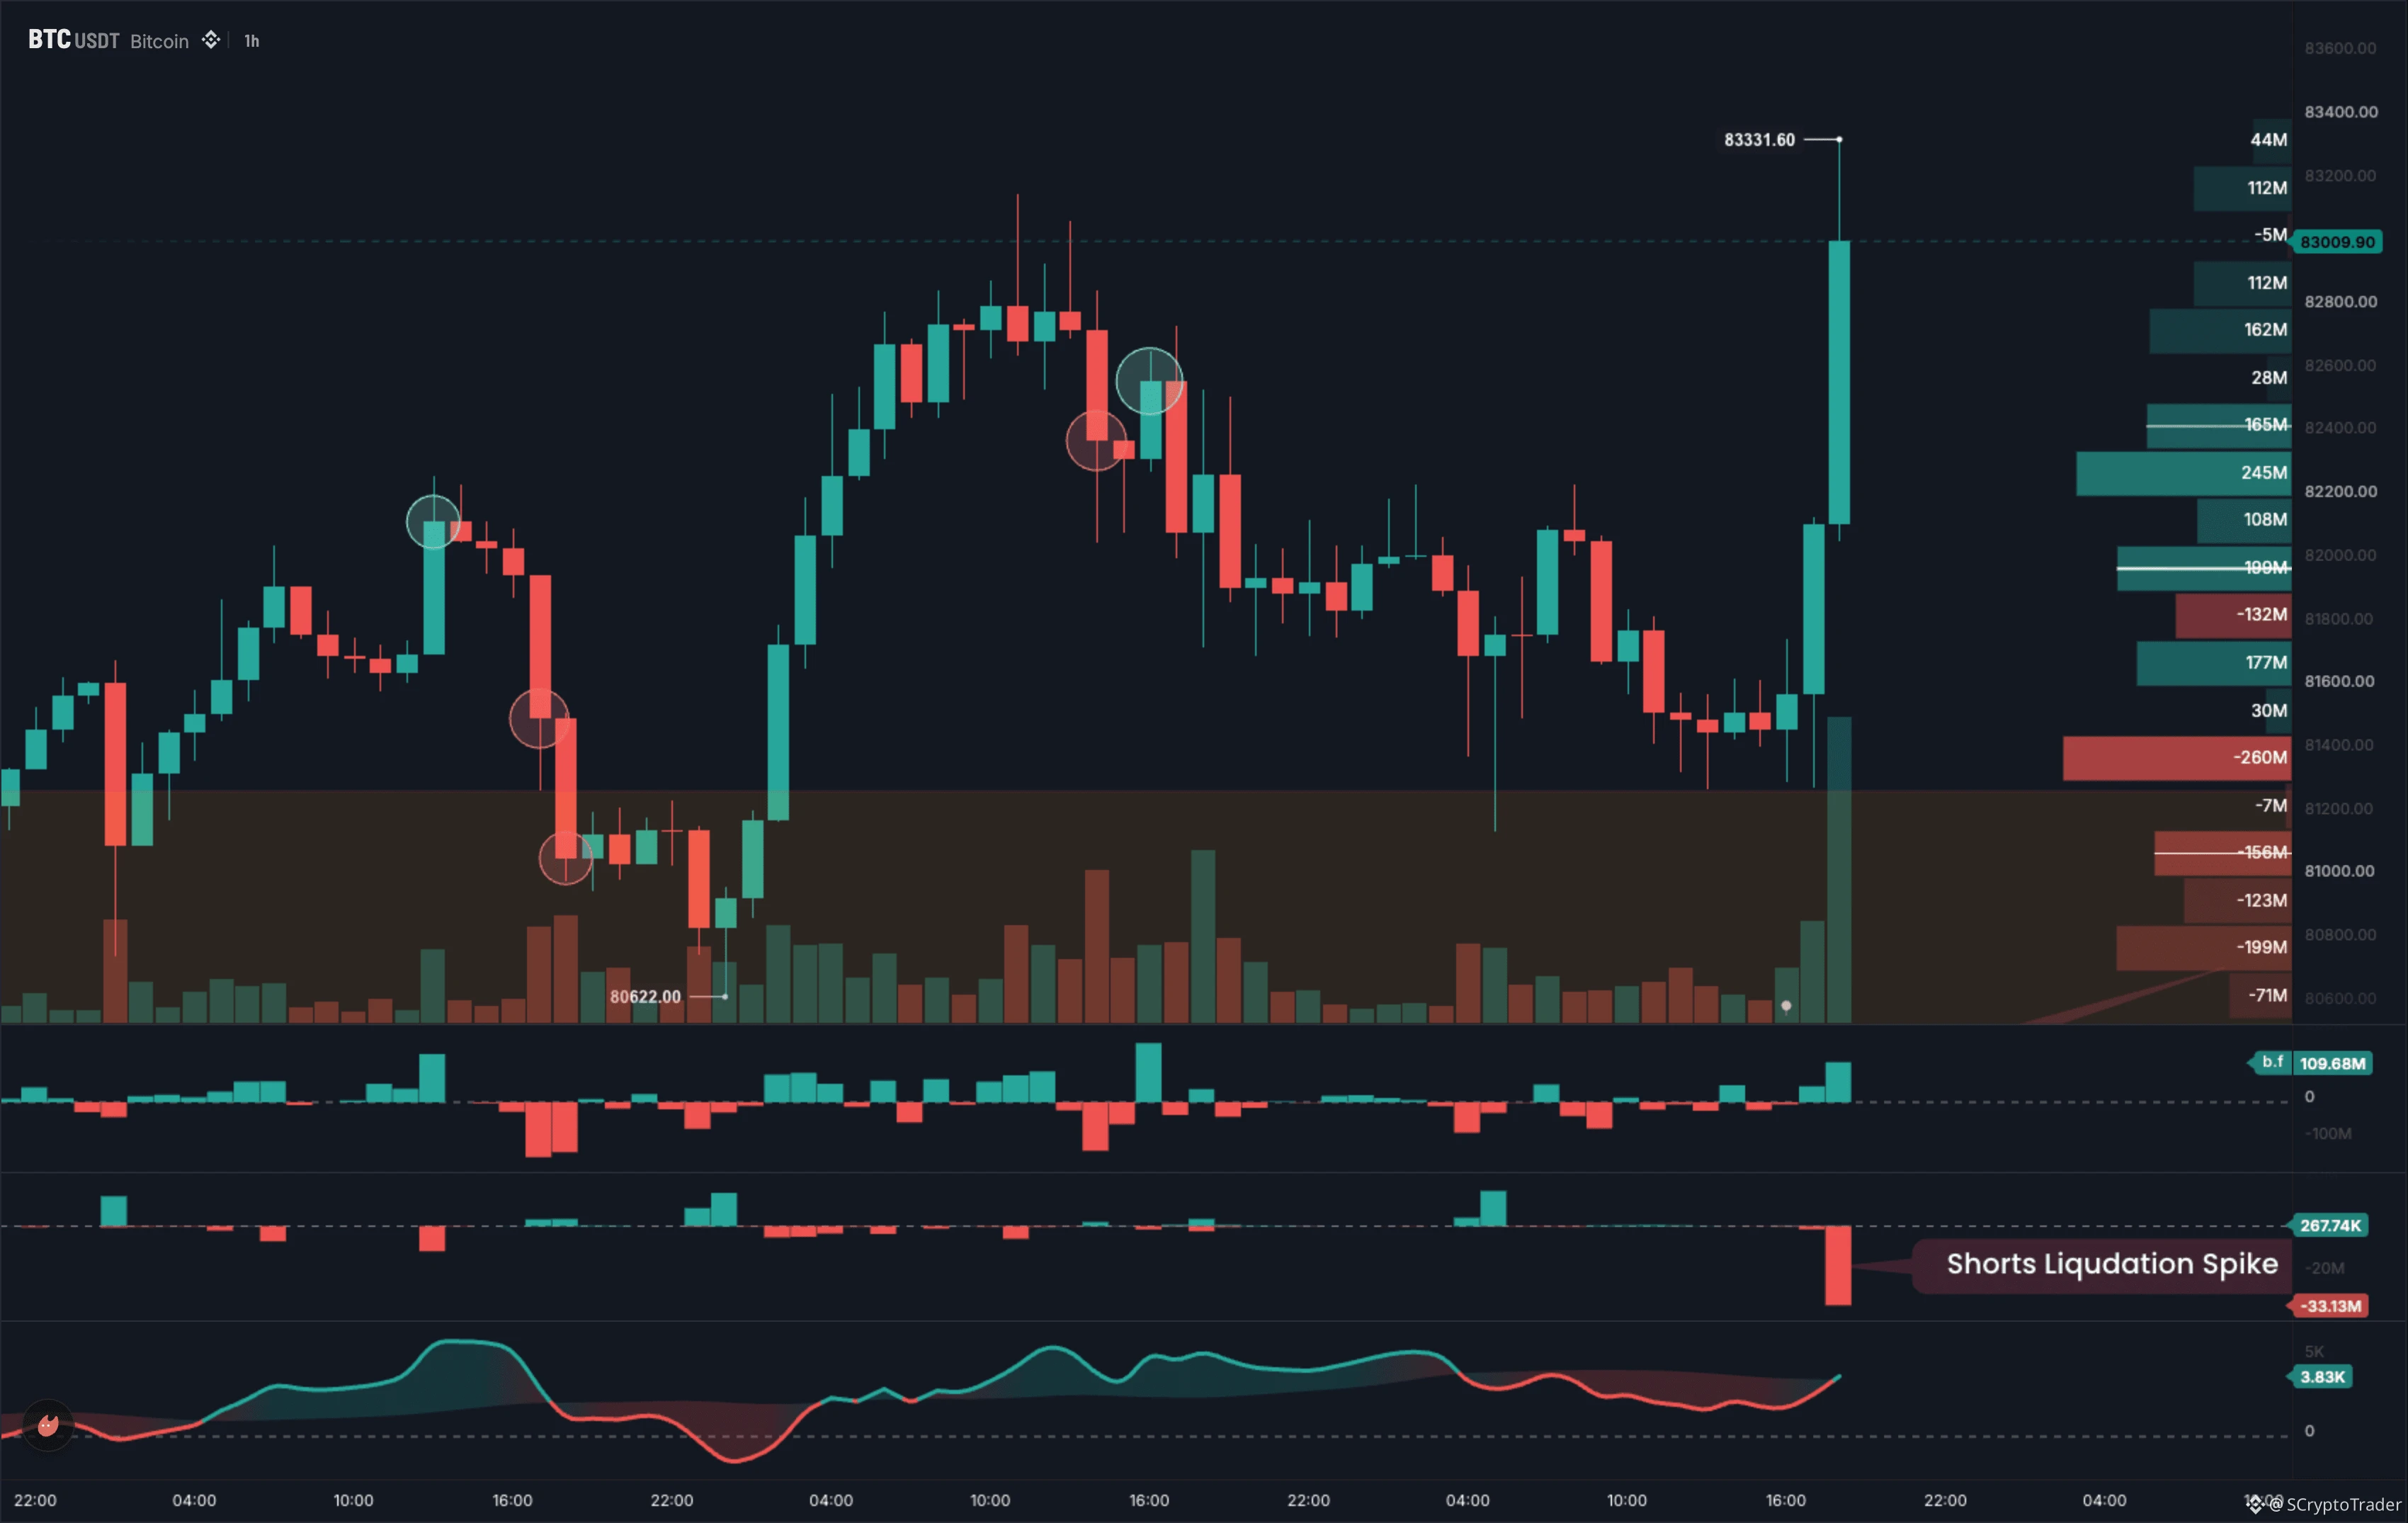
$BTC Where is the capital taking a side? The answer is: bears are applying pressure in plain sight, but the funding rate has exposed the overcrowding of short positions.
Current price: 81781.9, down 1.91% over 24h. MA5=81355.4 has crossed below MA20=82324, the MACD histogram at -29.11 remains bearish, and RSI=41.0 is weak but has not reached oversold territory. The lower Bollinger Band at 80836.6 is the first support level ahead. The key factor is the funding rate of -0.0001%—the price is falling while the rate is negative, meaning short positions need to pay longs, which is a typical signal
post-image
BTC-1.80%
TAO-6.94%
🚨#Bitcoin repeats the cycle: from 20,000… more
post-image
BTC-1.80%
crypto market update
live-cover
LIVE77
The Greed Index is still at 64, so why has $NEAR fallen much harder than the broader market?
The answer lies in a structural mismatch: broader market sentiment is relatively warm, but $NEAR's 24h decline has reached -14.71%, with its current price of 4.533 falling below MA5 (4.5512) and MA20 (4.9626), forming a bearish moving-average alignment; RSI is only 31.1, nearing oversold territory, while the MACD histogram at -0.05263 continues to show bearish momentum. The lower Bollinger Band at 4.2513 is the nearest psychological support. The funding rate is -0.0044%, meaning shorts are paying longs
post-image
AMP+19.32%
Many people see the 16% drop in 24 hours and rush to buy the dip, thinking “after falling this much, it should rebound”—but this treats the decline as a margin of safety. The real risk is that a negative funding rate during a downtrend does not necessarily mean shorts are overcrowded; it could also indicate a cascading liquidation of longs.
$ORC Current price 2.321, MA5=2.3046 is clearly below MA20=2.5814, forming a bearish moving-average alignment; although RSI=32.1 is close to oversold, the MACD histogram at -0.0335 remains in bearish expansion, while the lower Bollinger Band at 2.1994 is th
post-image
SKL+16.65%
The lower levels of $ENA are drawing attention, but cheapness can never replace evidence that the decline has stopped. I would rather lay out the bearish case first.
Bears see the risk after a break below 0.1941, while bulls need to prove that buyers remain after a break above 0.2283. Current volume is 0.12x.
The current price is 0.2067, about 6.10% from the 1-hour support at 0.1941 and about 10.45% from the resistance at 0.2283. Positioning determines which side is more urgent. Stop guessing the bottom for now and wait for a new support structure.
It is more reliable to let the boundaries pr
post-image
ENA-7.88%
PUMP hit by reverse-engineering access revocation -7.9%, rebounds 2.41%; I’m bullish
$PUMP Its access was revoked following reverse engineering last night. The current price is 0.00568, with 24h performance at -7.9%, yet the chart didn’t collapse: after the incident, it moved from 0.005557 to 0.005691, rebounding +2.41%. I’m bullish at this level.
The daily structure remains intact—RSI 65.2 is strong, MACD has been above the zero line with a bullish crossover for the 11th day, MA7 has stayed above MA30 for the 14th day, and the short-term moving averages remain in a bullish alignment.
Funds
post-image
PUMP-8.31%
Bitcoin's bottom range has been supported since the breakout on September 21, then failed again near 87k. Now let's see whether there is some relief... If this can hold, we will once again see some decent conditions. Is this a good rebound/recovery zone...? An accumulation range?? The best buying opportunity??$BT
post-image
BTC-1.80%
What, you foreigners don't use this chat tool????
$PUMP is trending — but the real test is positioning.
A large trader reportedly closed a 1B $PUMP long at a ~$265K loss, then opened a 1.5B PUMP short with 5x leverage.
Volume remains elevated, so I’m watching whether this is a leverage flush or deeper distribution.
$0.0052 → key support
$0.0058 → reclaim zone
Above $0.0058 = recovery gains credibility.
Below $0.0052 = structure weakens.
Shakeout or breakdown?
#PUMP #PumpFun #Solana
post-image
PUMP-8.31%
  • 1
Financial News, Crypto Updates, Real Trading Strategies
live-cover
LIVE880
Load More

Join 40 M users in our growing community

⚡️ Join 40 M users in the crypto craze discussion

💬 Engage with your favorite top creators

👍 See what interests you

Trending Topics

Gate Money Officially Launches

3.44k Views12.86k Discussing

Gate officially launches Gate Money, a global integrated financial services app that brings digital assets, fiat, stocks, ETFs, gold, bank accounts, and payments into one Gate App. Users can manage assets, invest, send and receive funds, convert currencies, and make payments — all from a single account. Which use case are you most excited about? [👉 Learn more](https://www.gate.com/announcements/article/102094)

Fed September Minutes Lean Hawkish

64.13k Views2.72k Discussing

Samsung Q3 Operating Profit Surges 782.5%

36.83k Views1.93k Discussing

View More