







Square
Following
Hot
News
Profile
Share your thoughts
placeholder
Article
Short setup $IDOL
Entry: 0.019 Take profit: 0.018 Stop loss: 0,02 Why short? The current trend is downward, with clear signs of a top forming, and it is gradually declining. There are far more people going long than short.
post-image
IDOL-6.71%
If a transaction is flagged as unusual, you’ll get an anti-fraud call. Has this ever happened to you?
post-image
Trenches
ZIG
Z
bade
b
ZIG
0x8c...1145
Market Cap
$.
Change
.
24h Vol
$.
Holders
.
BTC
B
bade
b
BTC
C5xp...pump
Market Cap
$
Change
.
24h Vol
$.
Holders
.
HIGH
H
bade
b
HIGH
7ymF...high
Market Cap
$.
Change
.
24h Vol
$.
Holders
.
STONK
S
bade
b
STONK
6GmA...UNgx
Market Cap
$.
Change
.
24h Vol
$.
Holders
.
CORLA
C
bade
b
CORLA
0xba...7777
Market Cap
$.
Change
.
24h Vol
$.
Holders
.
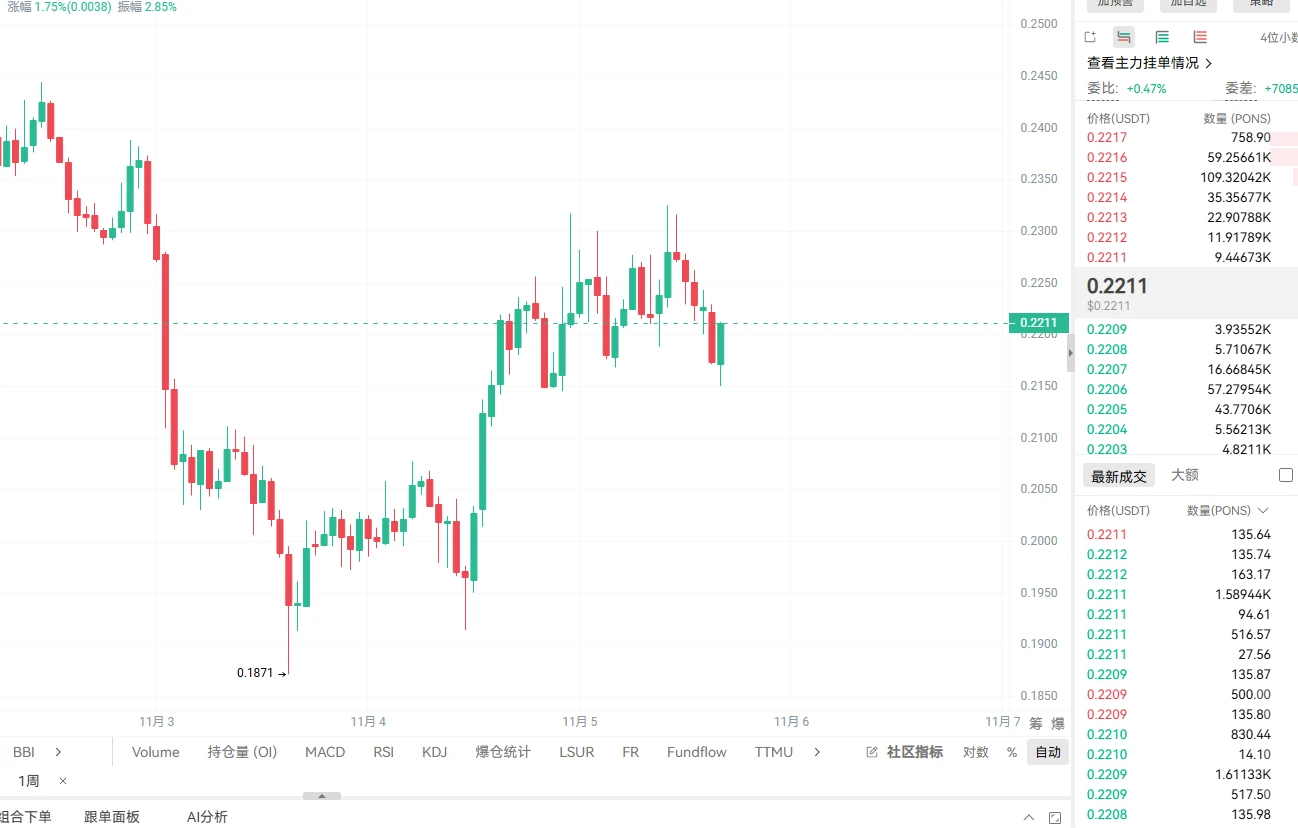
Yesterday, Da Chao said pons at 0.19 was a once-in-a-century bottom. Today, it climbed as high as 0.2317, up more than 20% from the bottom.
After he said that, it didn't even come close to 0.19. It bottomed at 0.1953, and buyers scooped it up immediately.
Some say this is just a rebound. Da Chao's take is simple: a coin that's been falling for two months finally couldn't be pushed lower for the first time—that's a bottom forming.
Let's take another look at its fundamentals. It's the leading launchpad on Robinhood Chain, and most of the chain's meme coins come from it. All the tokens are circul
post-image
PONS+4.32%
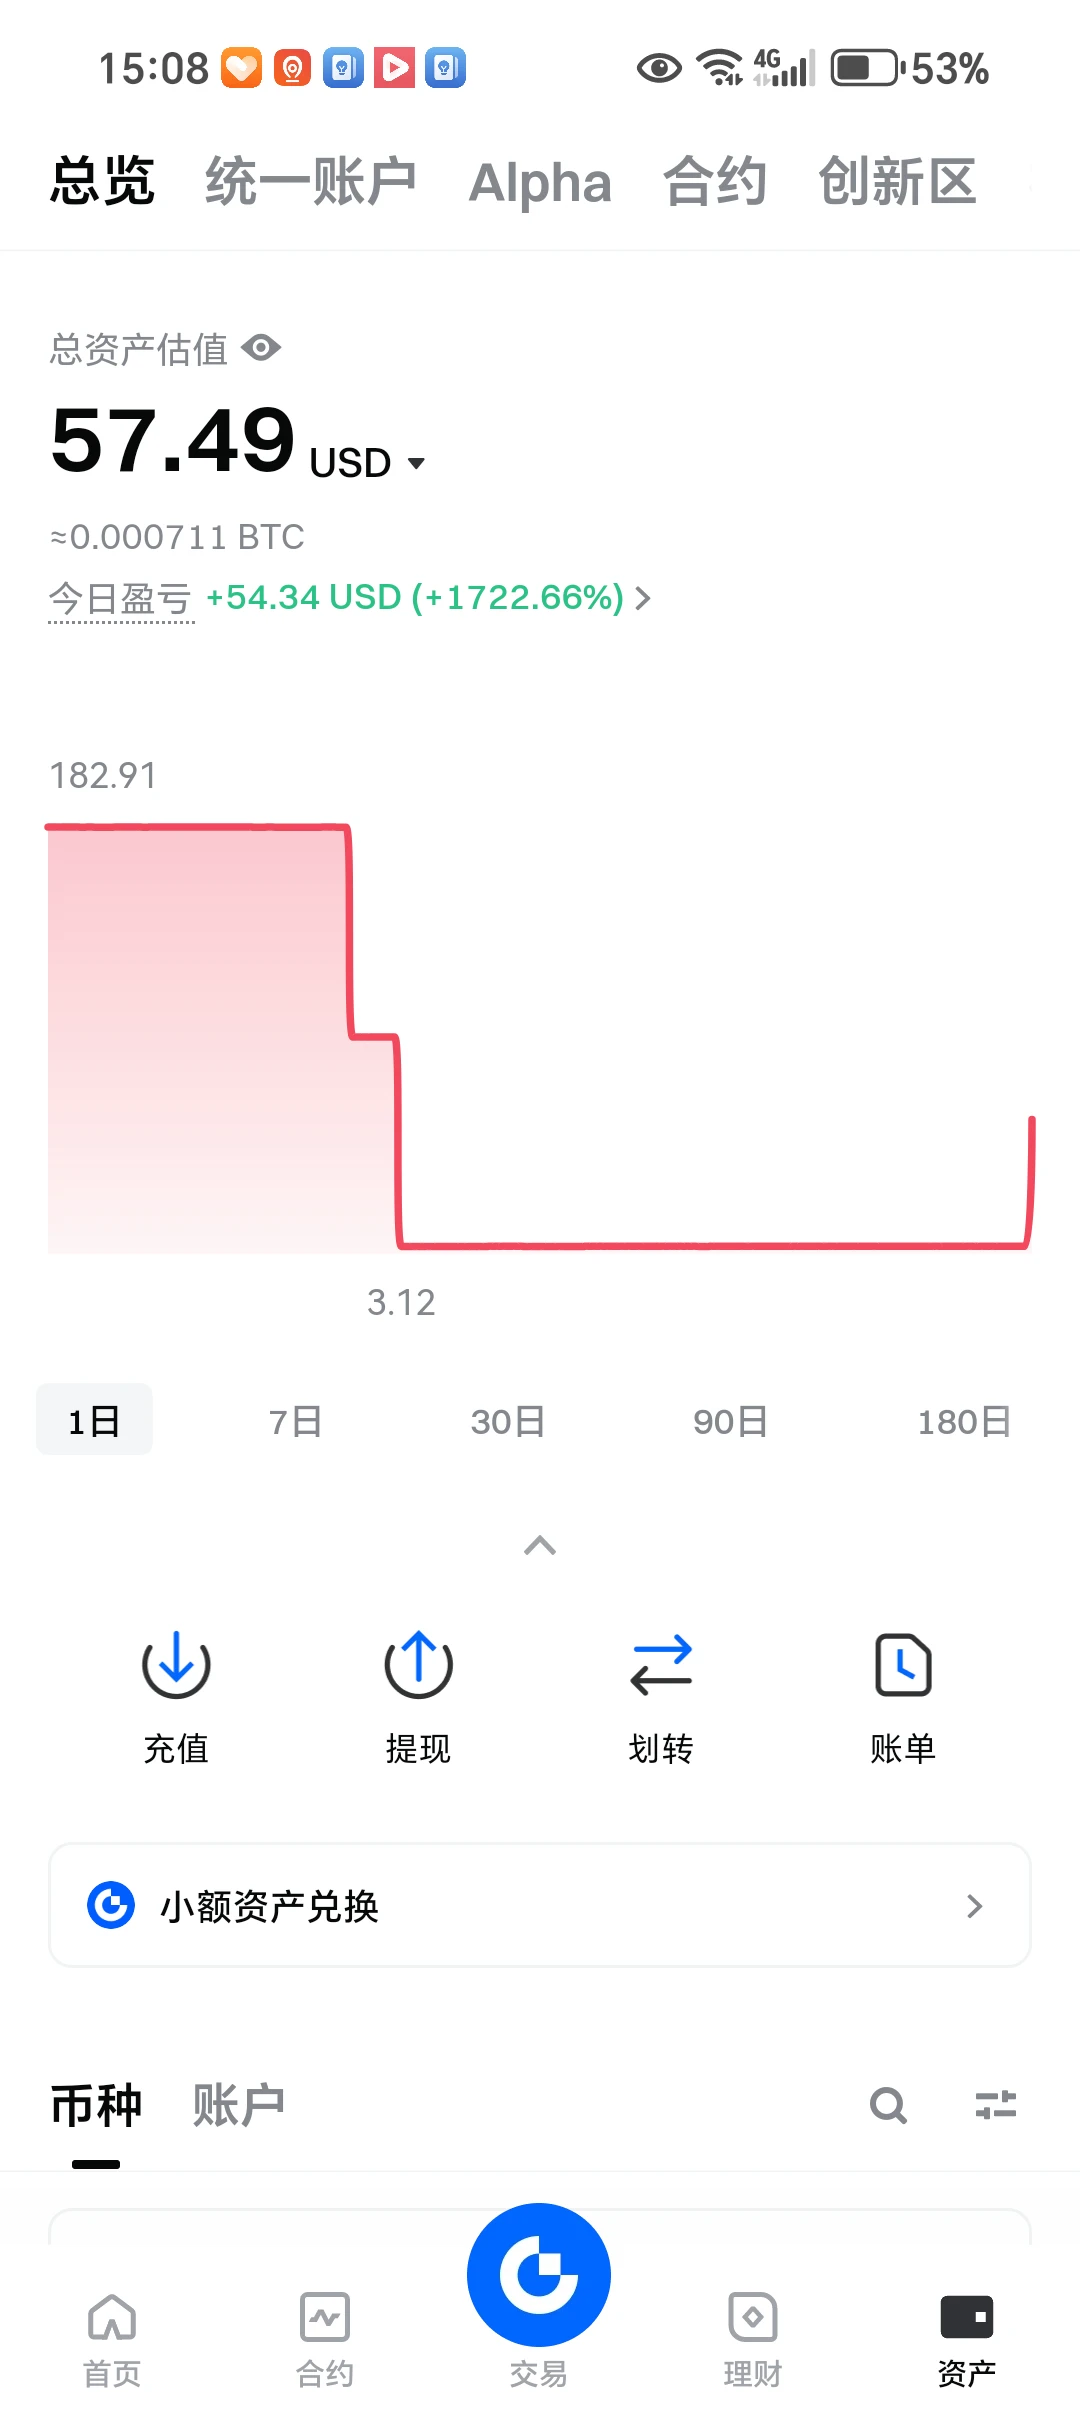
#KOR With a stunt like this, you can rip people off once, but nobody will trust you again after that. You dumped 399 million coins all at once in the middle of the night. Everyone, look at how far you dumped it—down to 3.14. I just want to know how it ended up at this level and how that was calculated. At 9 a.m., I was completely baffled: it showed today's P&L as over 2,800% profit. For such a big exchange to list this thing—unbelievable. We're not saying everyone has to make money; pumping the price, dumping, and all that is normal, but you can't go too far! What even is this? I'm starting to
post-image
Make this $BTC cook for me proper so I can take a rest.
post-image
BTC-0.67%
Use a small investment to pursue big gains, and join my livestream at 21:00 tonight
post-image
  • 3
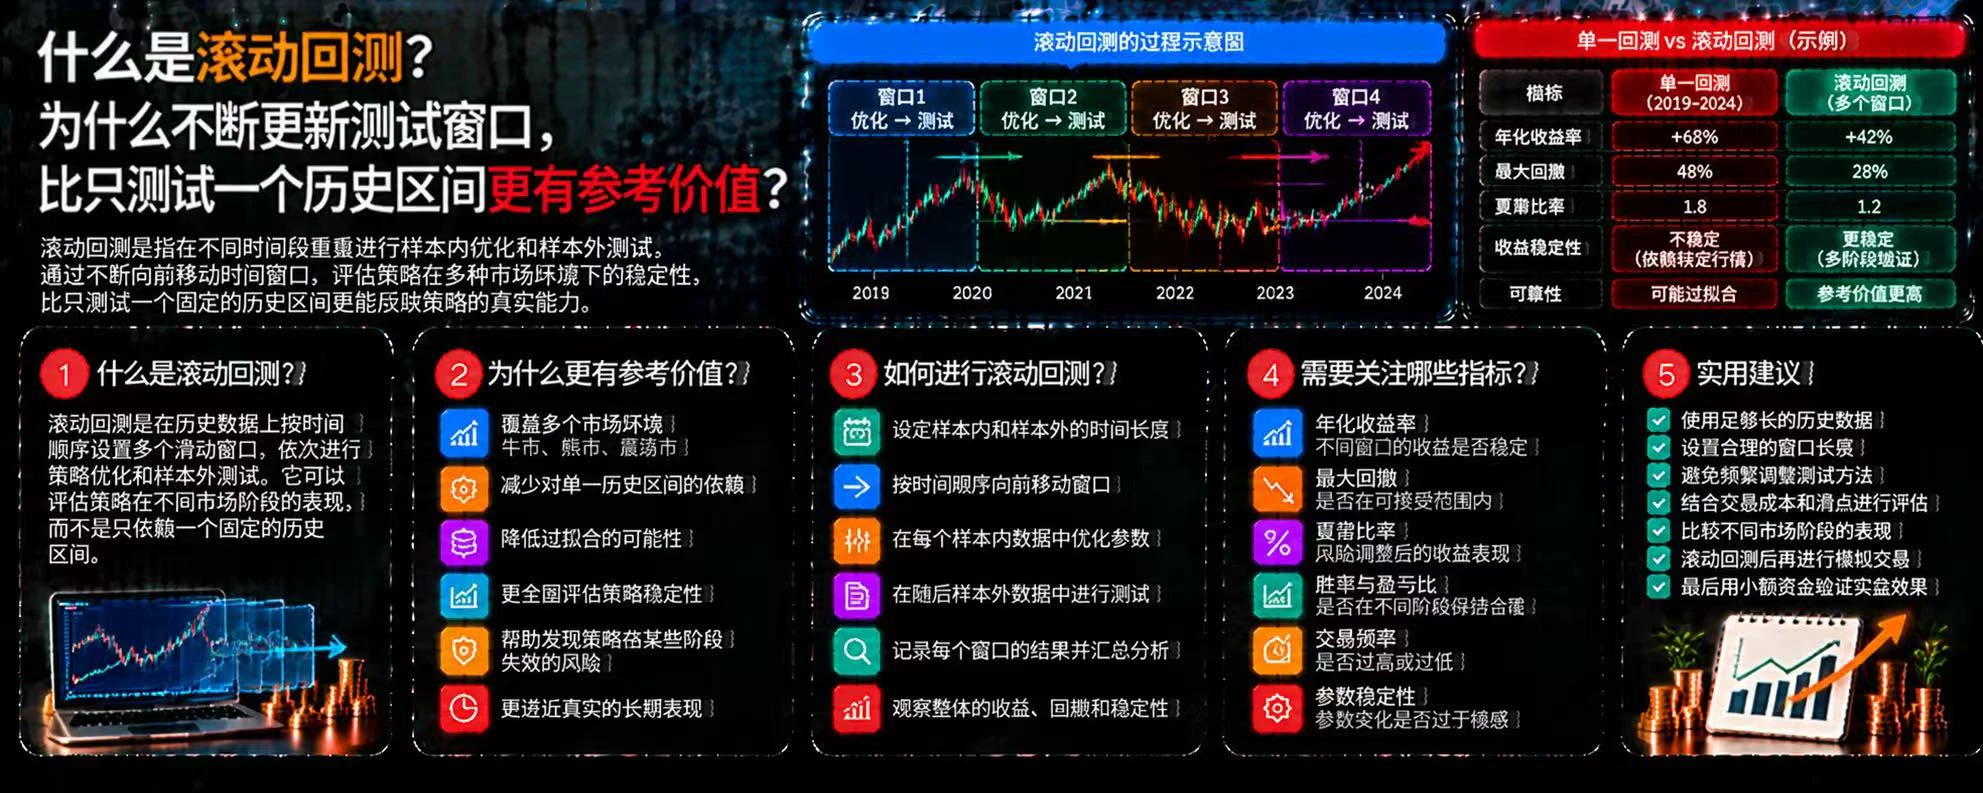
What is rolling backtesting? Why is continuously updating the test window more informative than testing just one historical period?
In cryptocurrency trading, a strategy may perform well only during a certain period of historical market conditions but fail to adapt to subsequent market changes. Testing just one fixed period can easily overlook how the strategy performs in different environments. Rolling backtesting continuously updates the test window, helping traders assess a strategy's stability more comprehensively.
First, what is rolling backtesting?
Rolling backtesting divides historical
post-image
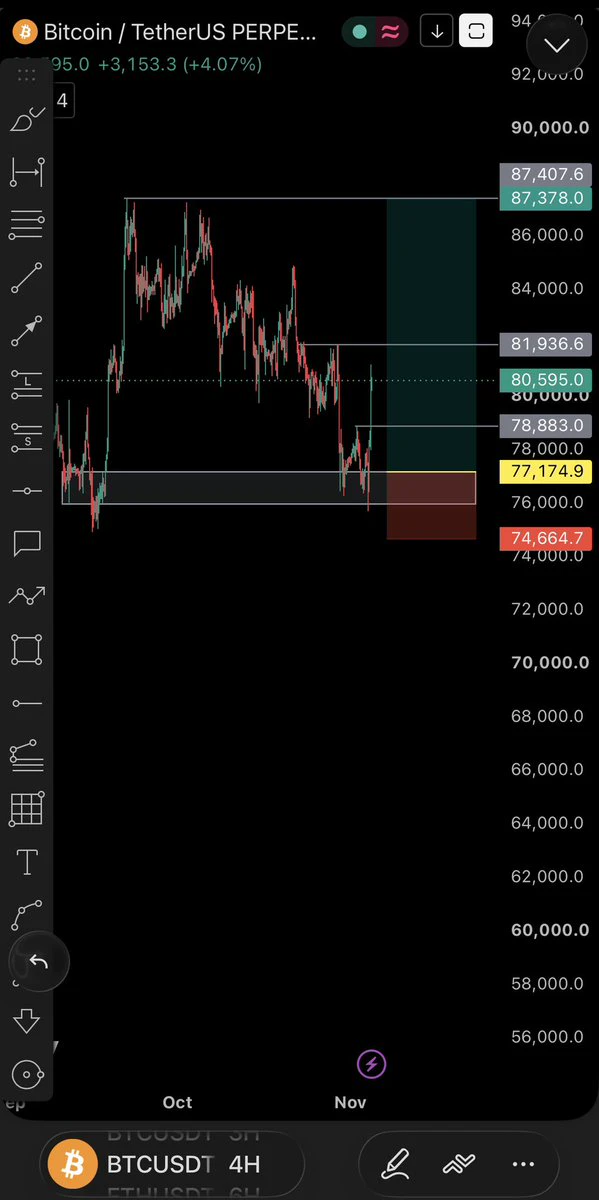
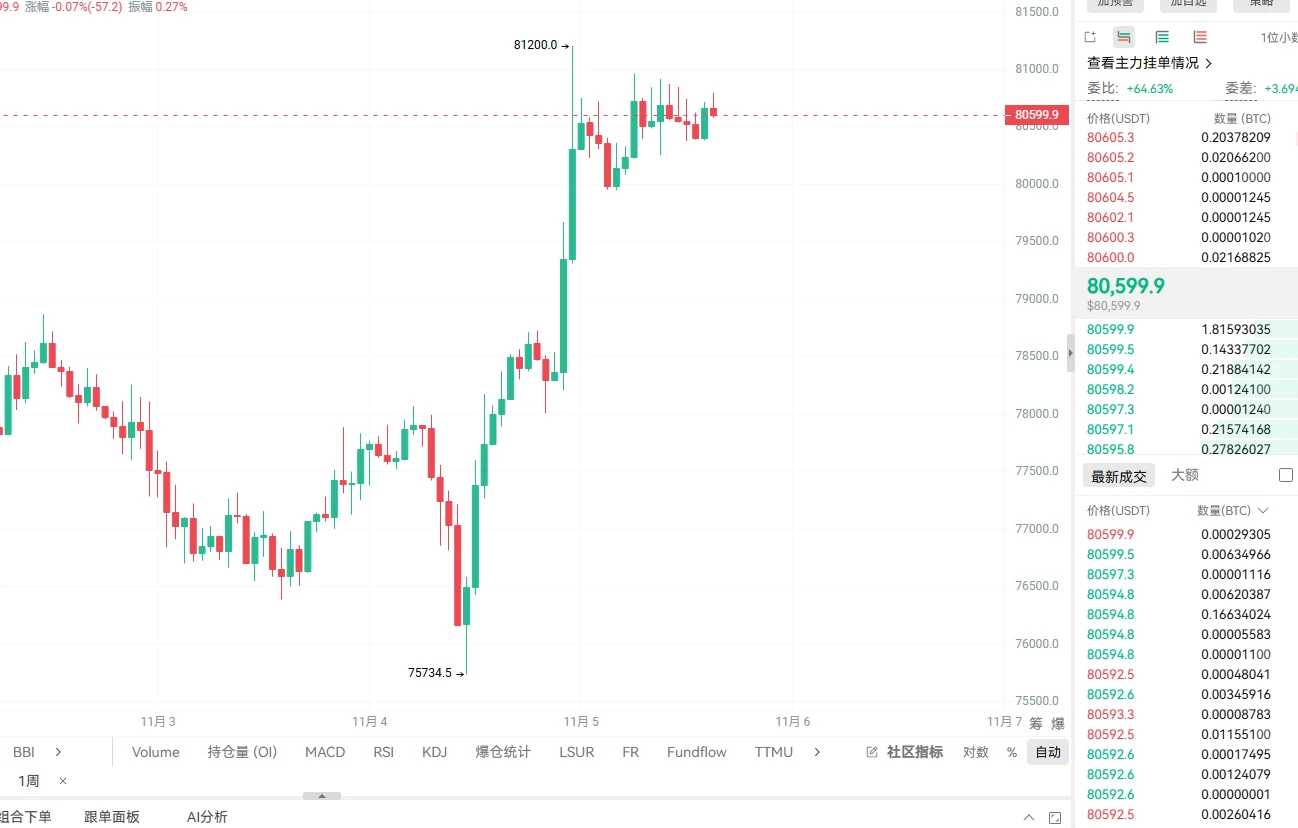
BTC was called at $77,800 on the 30th, and now it’s at $80,600—a $2,800 gain per coin.
You guys remember what things were like the day I called it, right? Binance had just been hacked for $6.3 billion, everyone was yelling about a crash, and BTC had just plunged to $76,400.
What Dachao said back then was: a dip caused by an unexpected event gets filled quickly.
It wasn’t like we never got spooked in between. During election week, it plunged to $75,700 again, leaving me down over $1,000 on paper. Plenty of people couldn’t hold on and got out. I never moved the $74,800 stop-loss, and just rode i
post-image
BTC-0.67%
$ZEC A staggering move just happened on-chain—4 million ZEC were withdrawn directly from exchanges, leaving spot-market liquidity almost completely drained.
Look at the market data: short positions have climbed to 65%, and the long-short ratio has been pushed down to 0.54. Yet large orders in the futures market are stubbornly propping up the price, while shorts pay the full interest every day just to hold on.
If the big players were to push the price down now and hand you free money, they’d have to be out of their minds.
Spot selling pressure has dried up, while shorts are packed into a crowde
post-image
ZEC+1.16%
10u🦌 Gold Challenge, Day 1
post-image
GLDX-0.40%
PAXG+0.37%
Bitcoin Is Showing Signs of Recovery.
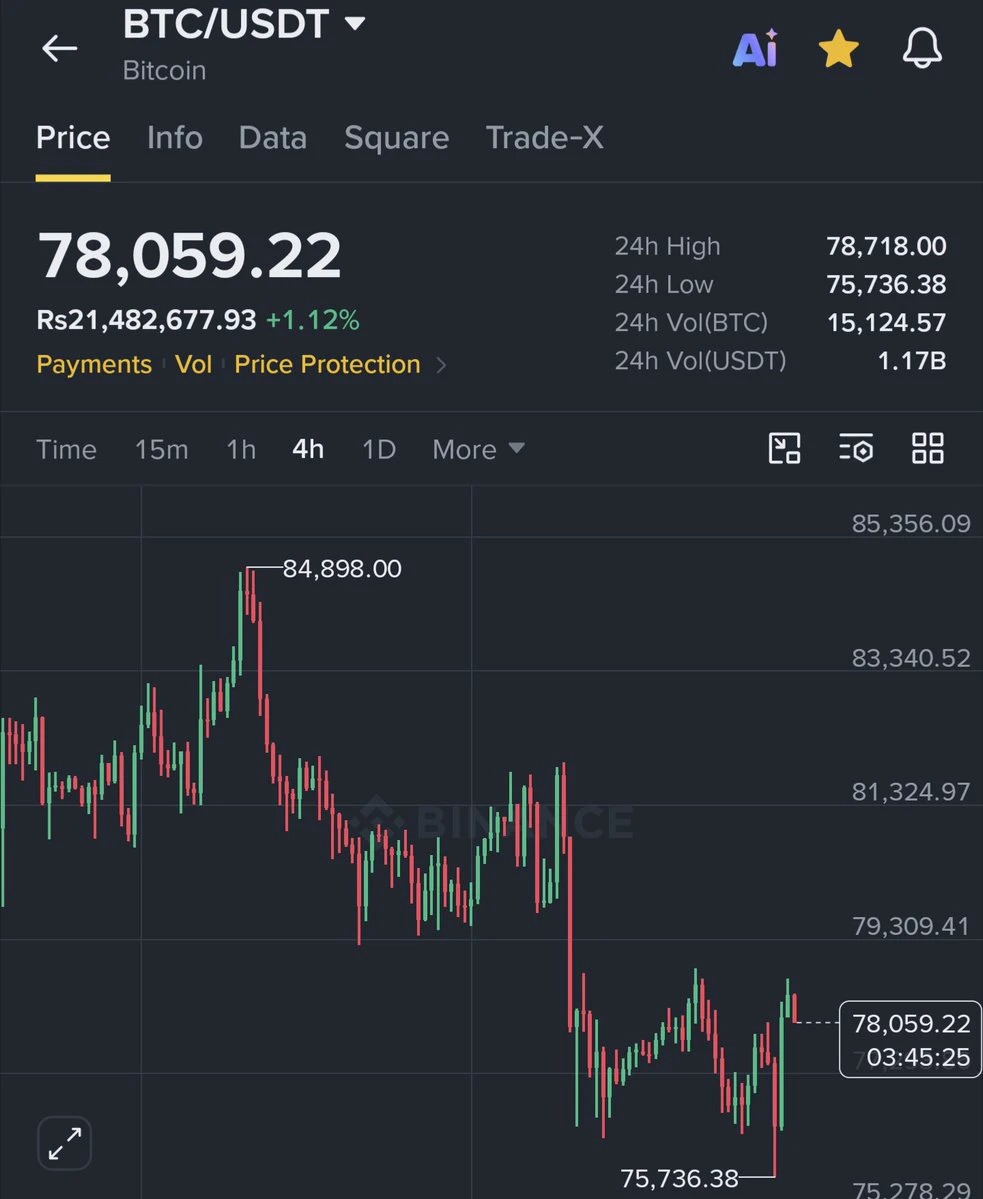
BTC is trading near $78,457, up 2.02% today.
Price has moved above the 7 day average, showing short term strength. However, the 30 day average near $81,011 remains the next major test.
A break above $81K could strengthen bullish momentum. The $73K area remains key support.
post-image
BTC-0.67%
Yesterday's market move was just the latest opportunity!
Keep risk management ingrained in your bones, and leave the rest to the market. Once the wind picks up, doubling your account in a few days comes naturally.
BTC: positioned near 76000, and it has now reached a high of 81188. ETH: went long near 2230, reaching a high of 2450.
Calling out levels in advance and having the courage to act when the market moves—that's the value of trading.
I've always believed that the biggest market moves are never captured by chasing them, but by anticipating them, waiting patiently, and acting decisively.
W
BTC-0.65%
ETH-1.23%
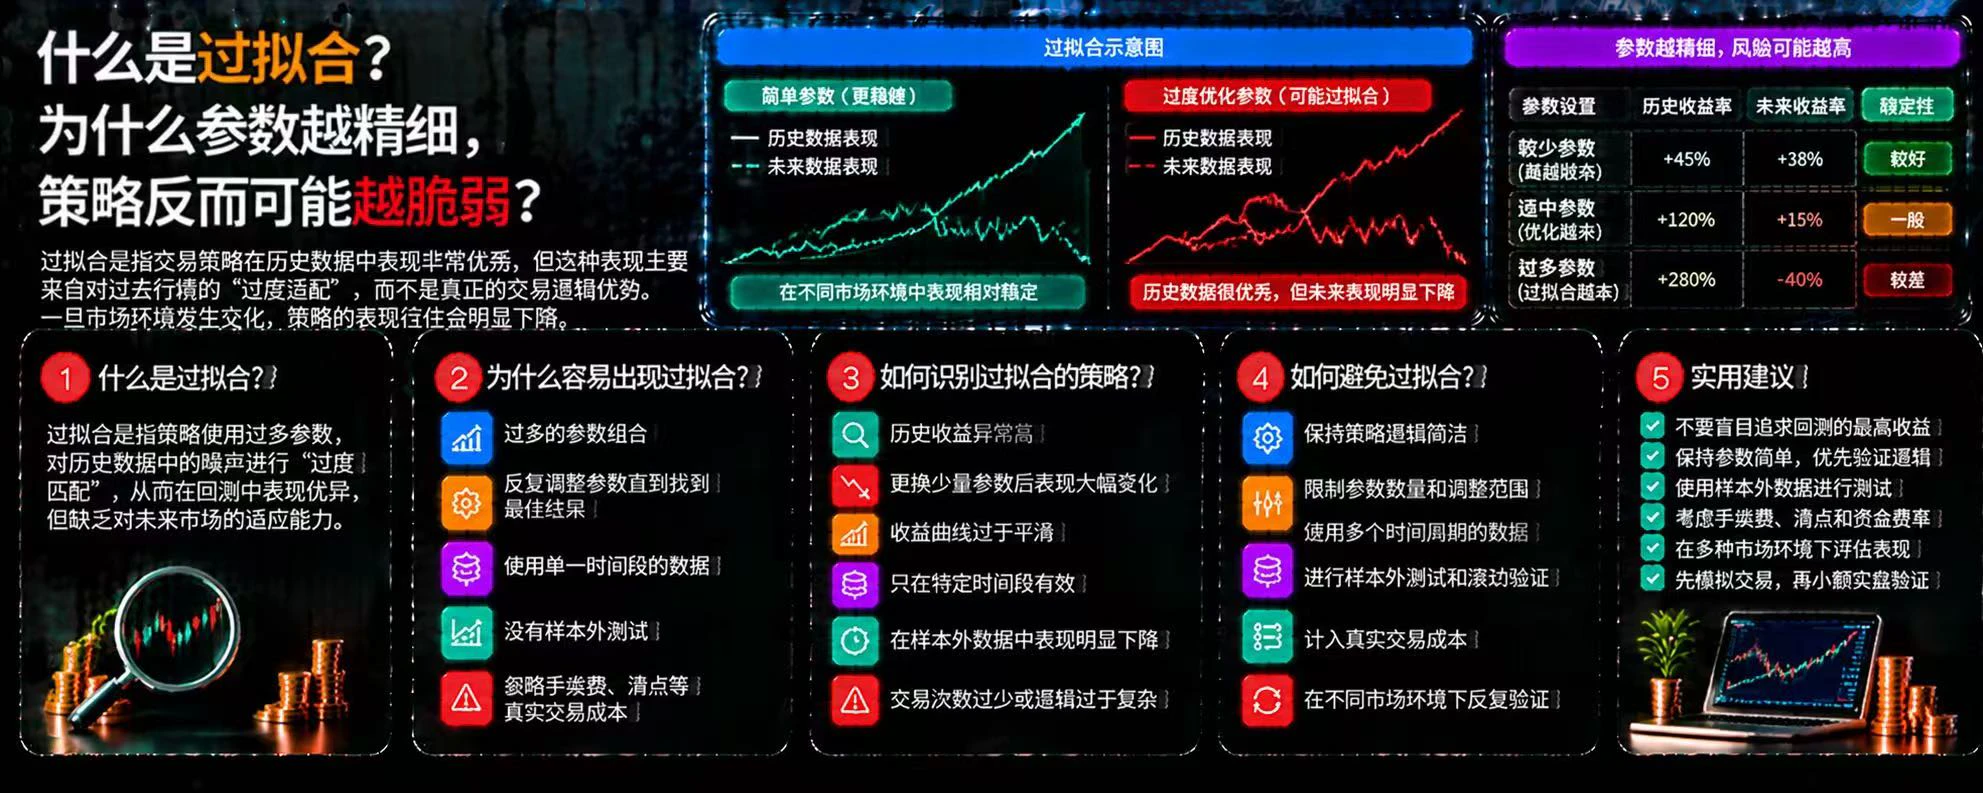
What Is Overfitting? Why Can More Fine-Tuned Parameters Make a Strategy More Fragile?
In cryptocurrency trading, some strategies show increasingly high historical returns and increasingly attractive backtest curves after repeated parameter adjustments. However, once they enter the real market, their performance may deteriorate rapidly. A common reason behind this is overfitting.
First, what is overfitting?
Overfitting occurs when a strategy adapts too closely to specific fluctuations and coincidental patterns in historical data, causing it to perform well in the past but lack the ability to ad
post-image
crypto market update btc
live-cover
LIVE2,028
BTC, ETH, GT, XRP, DOGE
live-cover
LIVE2,806
Getting unstuck | Don't rush to cut losses; check the levels first
When you're stuck in a position, the biggest risk isn't the loss,
but losing your composure and making rash moves.
In this market, don't cut your losses at every dip or blindly add to your position just to break even.
First, work out your cost basis, position size, and risk.
When the price reaches key support, consider what to do;
when a rebound reaches resistance, consider reducing your position.
Getting unstuck isn't about betting on a rebound, but about gradually managing your position according to a plan.
Before the market
post-image
BTC-0.65%
ETH-1.23%
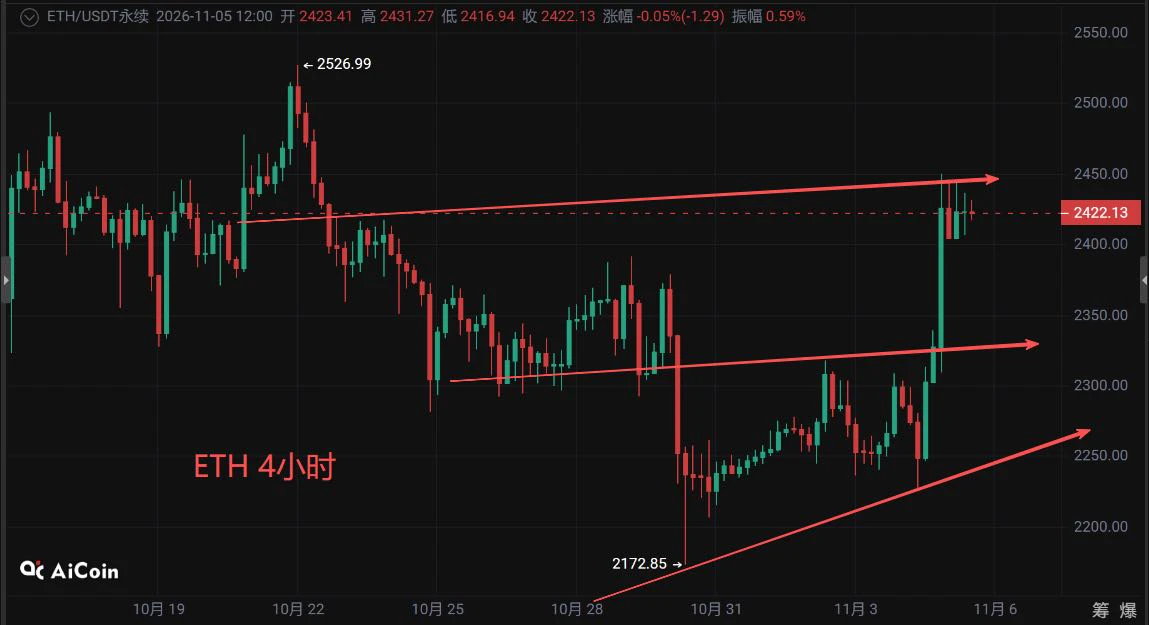
November 5 $ETH Market Update
ETH’s rebound has been somewhat stronger than expected.
On the 4-hour chart, ETH has rebounded steadily from around 2172. It was capped near 2300 several times before, but this time it surged on heavy volume, reaching a high of 2449.
It is now consolidating around 2420, and I think the short-term structure has improved significantly. The most important thing next is whether it can break through 2450.
If it holds above that level, the next targets could be 2500–2525; for now, watch whether 2400 holds.
Democrats won both chambers of Congress, and the market had ini
post-image
SevenSevenSeven
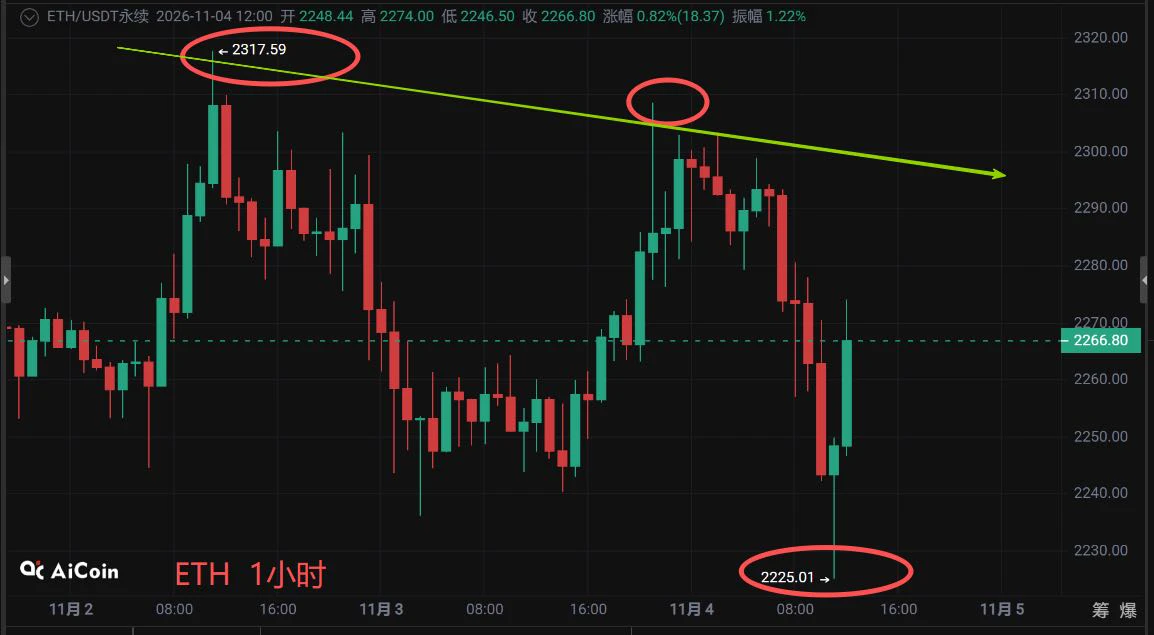
November 4 $ETH Market Update
Yesterday, we advised watching support around 2220. This morning, the price fell to a low of 2225, close to that support, then rebounded to around 2266, but the market has yet to stabilize.
On the 1-hour timeframe, clear resistance formed around 2318. A second rebound to around 2310 failed to break through, with heavy selling pressure overhead. Although the price is rebounding now, the highs continue to move lower, and the short-term trend has not strengthened.
Preliminary results from the U.S. midterm elections have also put some pressure on the market. Democrats made gains in several key districts, but control of both chambers remains to be confirmed. BTC also fell to around 75700, and overall market sentiment is cautious.
Liquidation data shows ETH has broken above $2,359, with cumulative short liquidation intensity across major CEXs at about $776 million;
If it falls below $2,136, long liquidation intensity would be about $381 million. These are estimates only and do not mean the price will necessarily reach that level.
Trading advice: The key short-term support zone is 2220-2230. Holding above it keeps the rebound outlook intact; if it breaks, the price may retest around 2170 or continue falling.
The short-term upside target is 2280, with strong resistance in the 2300-2318 zone. Stay cautious and do not chase longs before a decisive break above resistance.
Those holding low-entry long positions can continue to hold and monitor the market, reducing positions as appropriate if the price rebounds into the resistance zone;
Those who have not entered should wait patiently for the price to stabilize after a retest or for a breakout above resistance before taking action.
#BTC打破历届中期选举前看跌走势
repost-content-media
ETH-1.23%
Good moornings chat <3
What’s the plan today?
post-image
Load More

Join 40 M users in our growing community

⚡️ Join 40 M users in the crypto craze discussion

💬 Engage with your favorite top creators

👍 See what interests you

Trending Topics

GateLaunchesPoSECProofOfSecurity

239 Views455 Discussing

Gate has officially launched Proof of Security, or PoSEC, extending beyond Proof of Reserves by disclosing the distribution of cold-storage and hot-wallet assets and introducing a cold storage coverage ratio to measure protection under extreme-risk scenarios. Gate’s latest cold storage coverage ratio stands at 104.58%, with 88.26% of assets in cold storage and 11.74% in hot wallets. A coverage ratio of at least 100% means cold-storage assets alone would still be sufficient to cover all user assets even if hot-wallet assets were fully lost. Exchange security is not only about whether reserves are sufficient, but also how assets are stored and protected under extreme conditions. Could cold storage coverage become a new industry standard?[👉 Learn more](https://gate.com/proof-of-security)

BTCBackAbove80K

45.78k Views41.28k Discussing

DemocratsWinBothChambers

19.88k Views461 Discussing

View More