Square
Following
Hot
News
Notifications
Profile
Share your thoughts
placeholder
Article
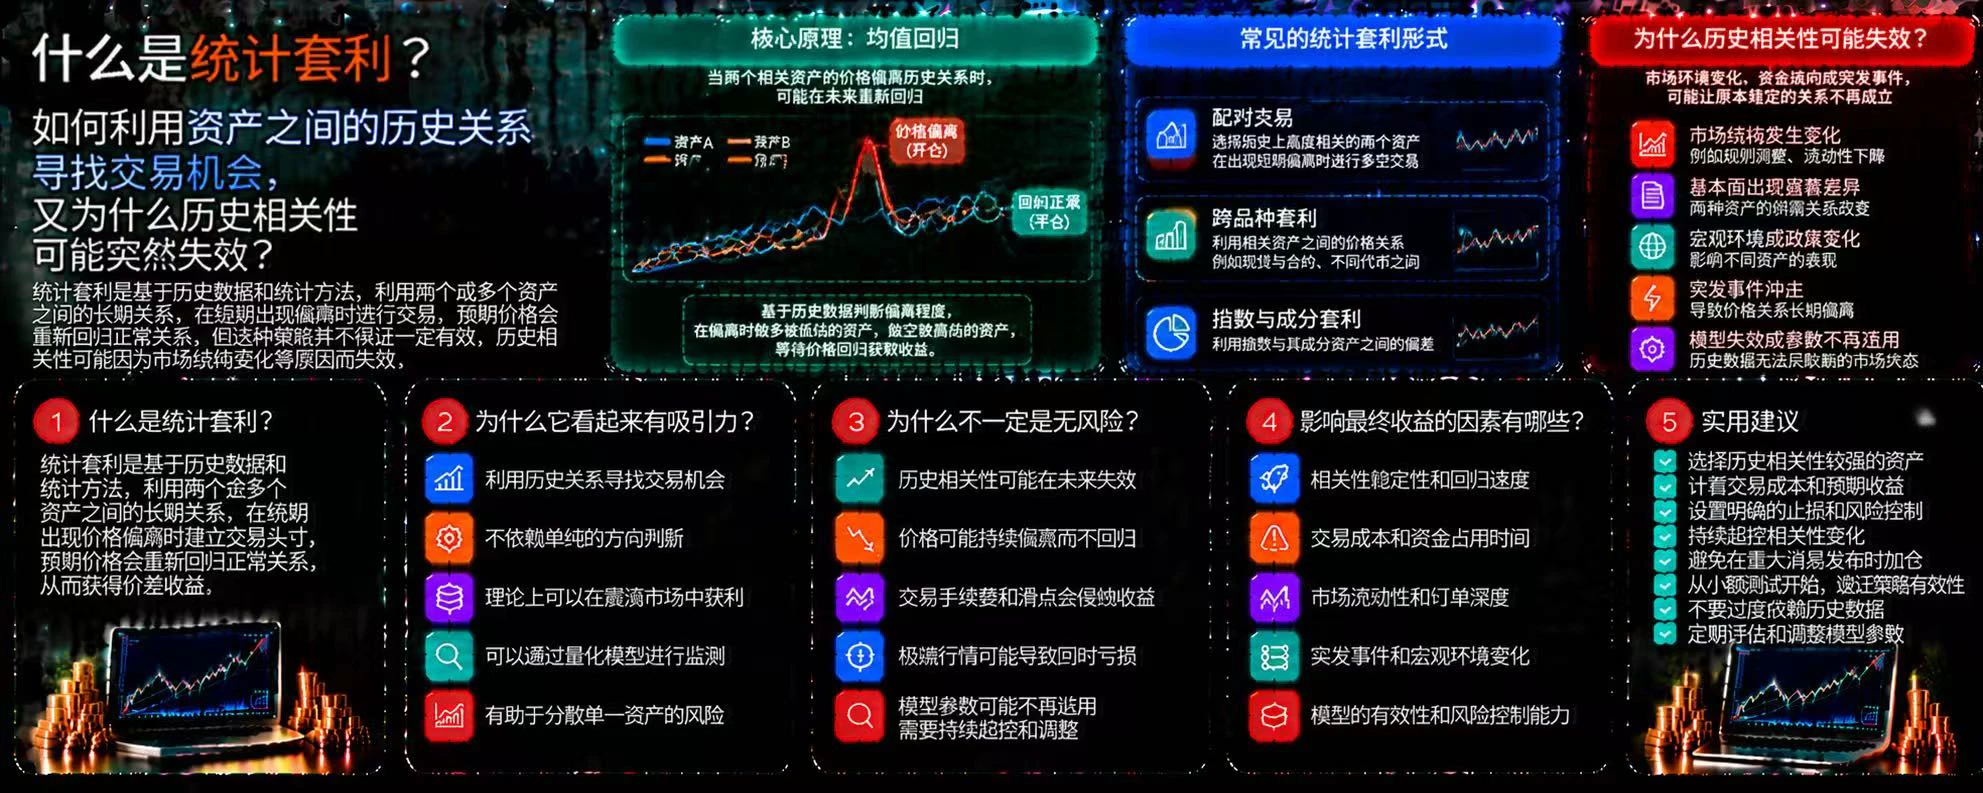
What is statistical arbitrage? How can historical relationships between assets be used to identify trading opportunities, and why might historical correlations suddenly break down?

In the cryptocurrency market, some assets have long exhibited similar price movements. When their historical relationship temporarily deviates, traders may try to exploit the discrepancy. This is the basic idea behind statistical arbitrage, but historical patterns do not guarantee that they will repeat.

First, what is statistical arbitrage?

Statistical arbitrage is a type of trading strategy that uses historical
post-image
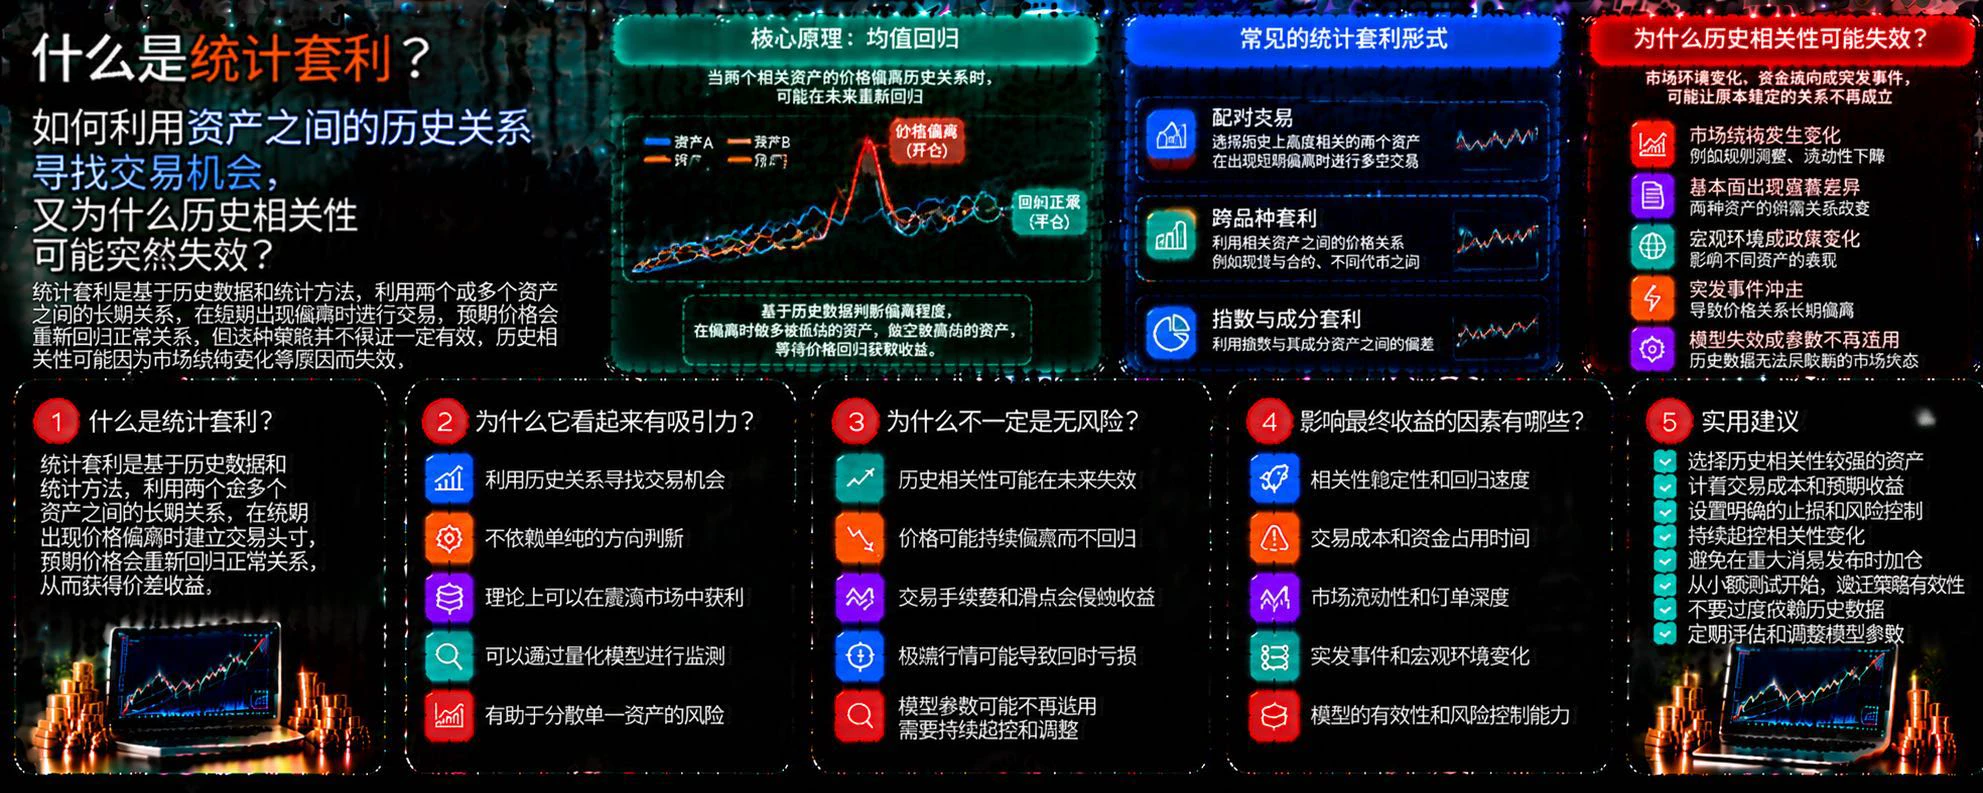
What Is Statistical Arbitrage? How Can Historical Relationships Between Assets Reveal Trading Opportunities, and Why Might Historical Correlations Suddenly Break Down?

In cryptocurrency markets, some assets have long shown similar price movements. When their historical relationship temporarily diverges, traders may try to exploit the deviation. This is the basic idea behind statistical arbitrage, but historical patterns are no guarantee of future repetition.

First, what is statistical arbitrage?

Statistical arbitrage is a type of trading strategy that uses historical data, statistical model
post-image
Trenches
ZIG
Z
bade
b
ZIG
0x8c...1145
Market Cap
$.
Change
.
24h Vol
$.
Holders
.
BTC
B
bade
b
BTC
C5xp...pump
Market Cap
$.
Change
.
24h Vol
$.
Holders
.
CORLA
C
bade
b
CORLA
0xba...7777
Market Cap
$.
Change
.
24h Vol
$.
Holders
.
STONK
S
bade
b
STONK
6GmA...UNgx
Market Cap
$.
Change
.
24h Vol
$.
Holders
.
DESSA
D
bade
b
DESSA
npz2...pump
Market Cap
$.
Change
.
24h Vol
$.
Holders
.
$IDOL The death cross appeared again today.
post-image
IDOL-6.71%
  • 3
What Is a Market Maker? How Do They Improve Market Liquidity by Providing Bid and Ask Quotes, and What Risks Do They Face?

In the cryptocurrency market, whether a trade can be executed quickly depends not only on the willingness of buyers and sellers, but also on whether sufficient liquidity is available. Market makers are important participants in providing market liquidity, but they are not intermediaries who always make a profit.

First, what is a market maker?

Market makers typically continuously provide buy and sell quotes, making it easier for other traders to find counterparties. By a
post-image
A scene on the subway.
A beautiful woman says the child bumped into her.
post-image
Gold has formed an upward structure. How much farther can this rebound go?🔹 BTC is approaching $82,
live-cover
LIVE1,269
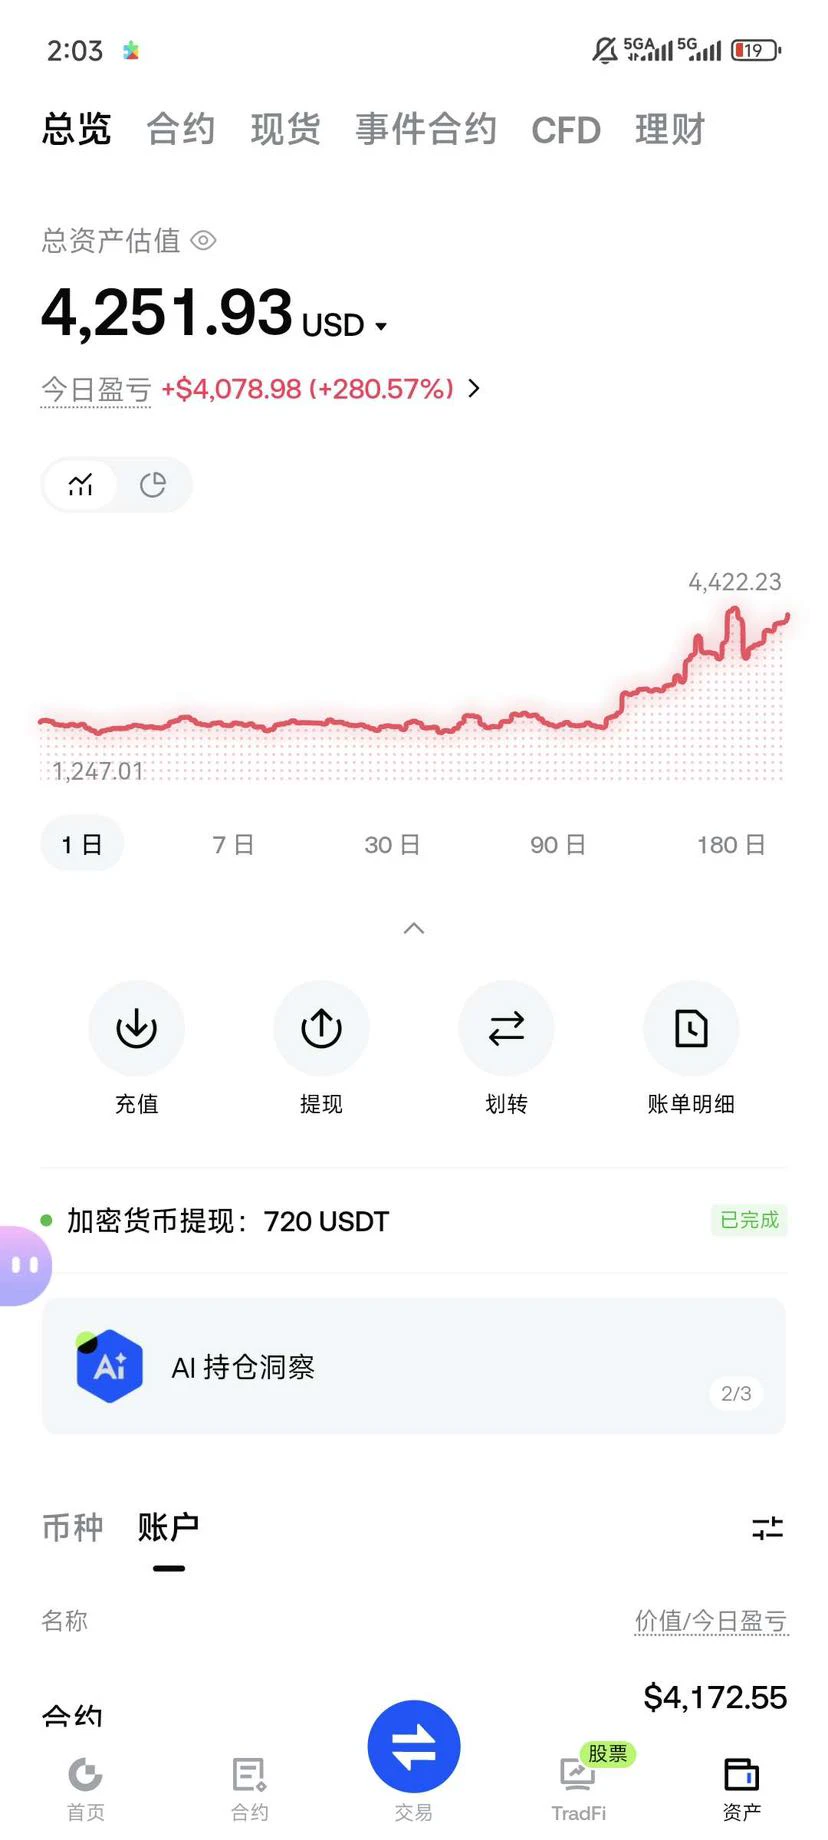
#晒出我的持仓收益 No Monday-morning quarterbacking,
Congrats to us—let’s move the take-profit/stop-loss on our zec short
ZEC+1.29%
#USStocksFaceHistoricSelloff Wall Street had its roughest day in months on 5 November, and the damage was concentrated in the names that carried the AI rally. Closing prints from the Gate feed show the S&P 500 ETF (SPY) at $733.00, down 4.41%, and the Nasdaq 100 ETF (QQQ) at $647.05, down 6.49%. Reuters reported that the Nasdaq 100 fell 6.4% and erased about $2.5 trillion in market value, its deepest one-day drop since "Liberation Day" in April 2025. The sell-off started after the midterm results, when investors began to question how much of the AI data-center buildout could survive a Democrat
Right-side opportunities are rare—you may not see one even a few times in a week. You have to wait for a breakout before entering, and then use protection.

With left-side trades, you must never get greedy; they’re all short-term. But 80%-90% of the market is range-bound, so there are plenty of opportunities. As long as you maintain a certain win rate and identify the right entry points, you can still achieve great results through compounding.

In other words, capture opportunities on both higher and lower timeframes[阴险]
post-image
$MU Shares of Micron Technology Inc. (NASDAQ: MU) plunged sharply in trading on November 5, 2026. The stock fell 17.46%, closing at $656.39 on exceptionally high trading volume of 77.87 million shares (nearly three times the average)
MU-17.23%
$HYPE The plan for this trade was pretty clear: enter at 86, with a target around 77. But I lost my nerve midway and cranked the leverage straight up to 20x. Looking back, if I’d simply stuck to 10x, I wouldn’t have come anywhere near the liquidation price. The market did indeed reach around 77, so my call was right, but my position management failed first. Once I was liquidated, I lost all my principal. Getting the direction right doesn’t mean you can withstand the volatility. Leverage amplifies gains, but it also raises the cost of having less room for error. $HYPE That was a hard lesson. Ne
post-image
HYPE+0.33%
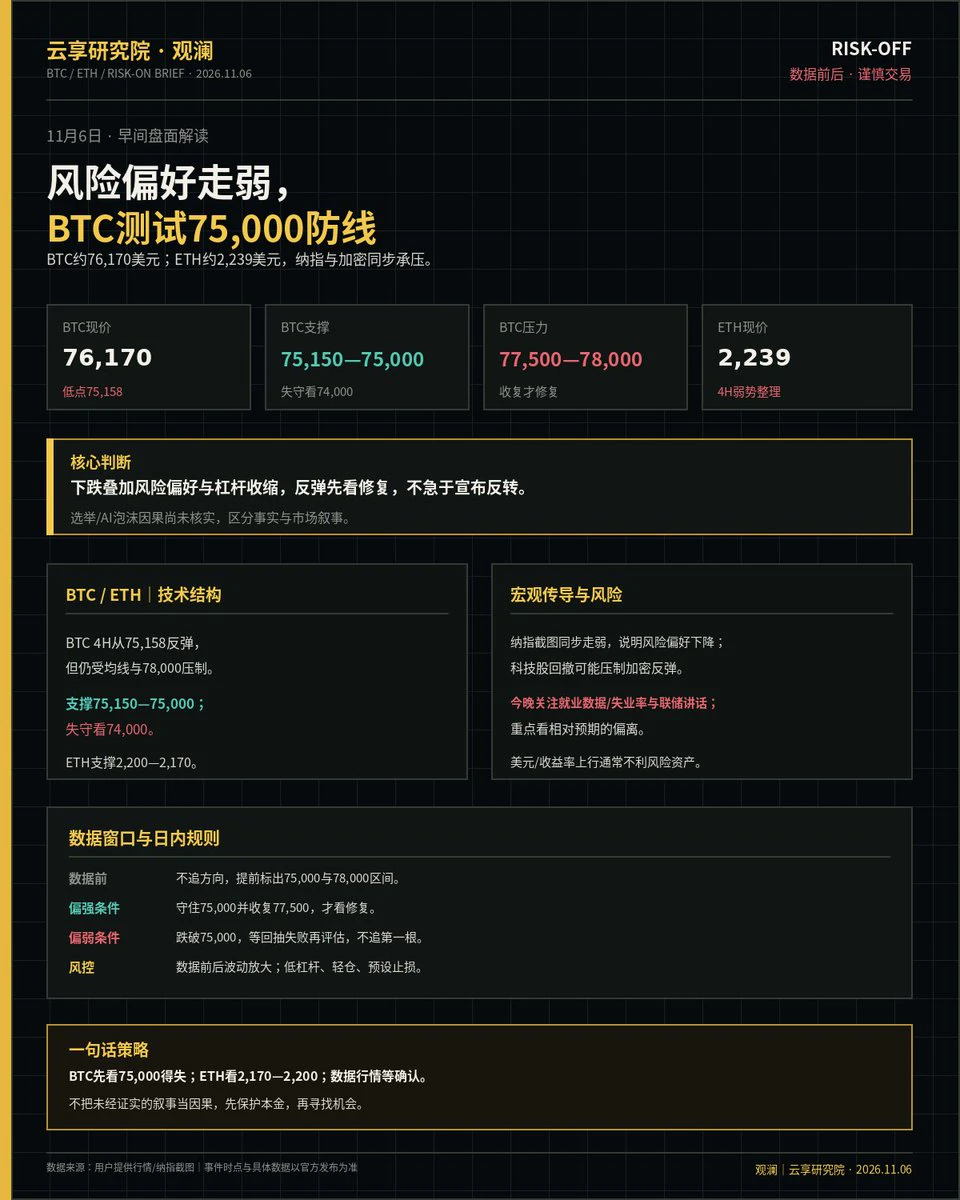
【November 6 | Morning Market Update and Macro Risks】
First, the facts: BTC is around $76,170. The weekly and daily charts remain in a pullback structure. It has rebounded from the 4-hour low of 75,158 but remains capped by the moving averages. ETH is around $2,239, consolidating weakly on the 4-hour chart. The Nasdaq screenshot shows risk assets under pressure across the board, with the market in a risk-off and deleveraging phase.
Key BTC levels: 75,150–75,000 below; a break below that puts 74,000 in focus. 77,500–78,000 above; reclaiming that range would open room for a recovery. ETH support
post-image
BTC-0.67%
ETH-1.26%
NAS100+1.45%
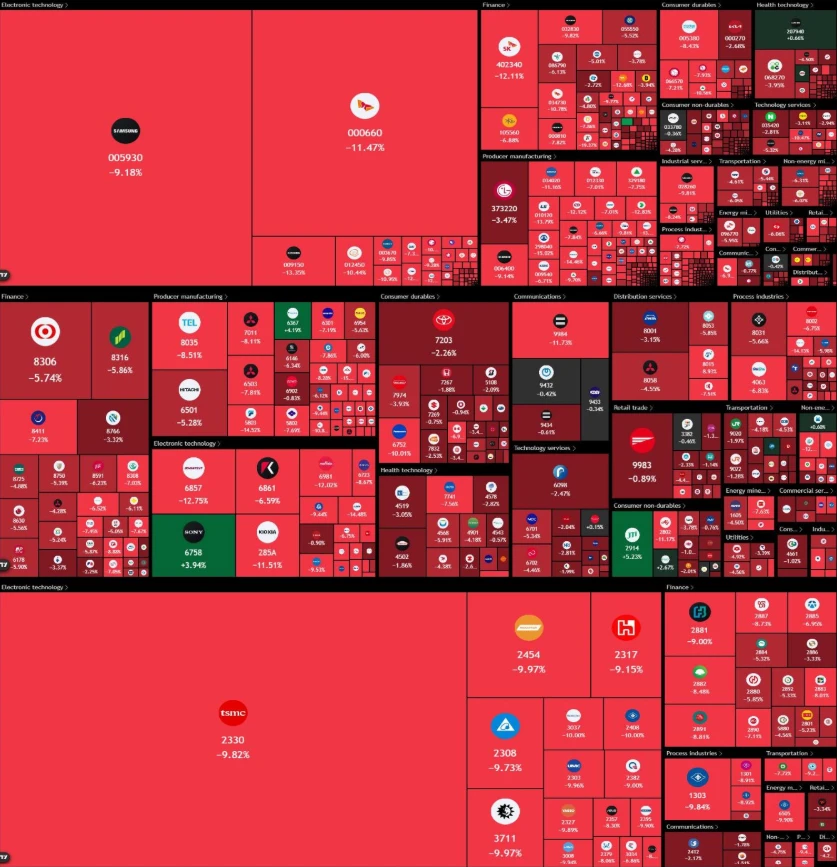
BREAKING: Asia now has 4 major stock markets in bear markets, after Japan and Taiwan joined today.

🇰🇷 South Korea: −45% from its June record
🇨🇳 China’s Shenzhen: −30% from its June high
🇹🇼 Taiwan: −24% from its October record
🇯🇵 Japan: −21% from its June record

Japan, South Korea and Taiwan have lost over $900,000,000,000 this morning.

AI giants TSMC, SK Hynix and SoftBank are all down around 10%.

It follows US chip stocks’ 2nd worst day on record.
post-image
TSM-10.96%
SK Hynix-7.51%
SKHY-13.76%
FeaturedWall Street Suddenly Turns! AI’s Cash Burn Is Causing Big Trouble—How Far Will U.S. Stocks Fall This Time?

How quickly can Wall Street change its tune? Yesterday it was cheering AI; today it’s collectively hitting the sell button!
U.S. stocks came under heavy selling pressure on Thursday, with the Nasdaq down more than 5% and the Philadelphia Semiconductor Index down more than 12%. AI and chip stocks plunged across the board. Market sentiment cooled instantly, and investors finally started doing the math.
Building AI data centers requires huge amounts of capital. Chips, servers, power, coolin
NAS100-0.07%
  • 17
#美股史诗级抛售 #Gate股票畅聊季 #WCTCS9 $NVDA The direct trigger for this sell-off was investors beginning to reassess the policy risks facing the AI industry's rapid expansion after Democrats scored a major victory in the U.S. midterm elections.
Democrats gained ground in Congress and several states, raising market concerns that tighter AI regulation and local restrictions on data center construction could delay investment in U.S. AI infrastructure. UBS analysts estimate that about 30% of the data center capacity expected to be added in the U.S. in 2028 could be affected by potential construction morato
NVDA-9.33%
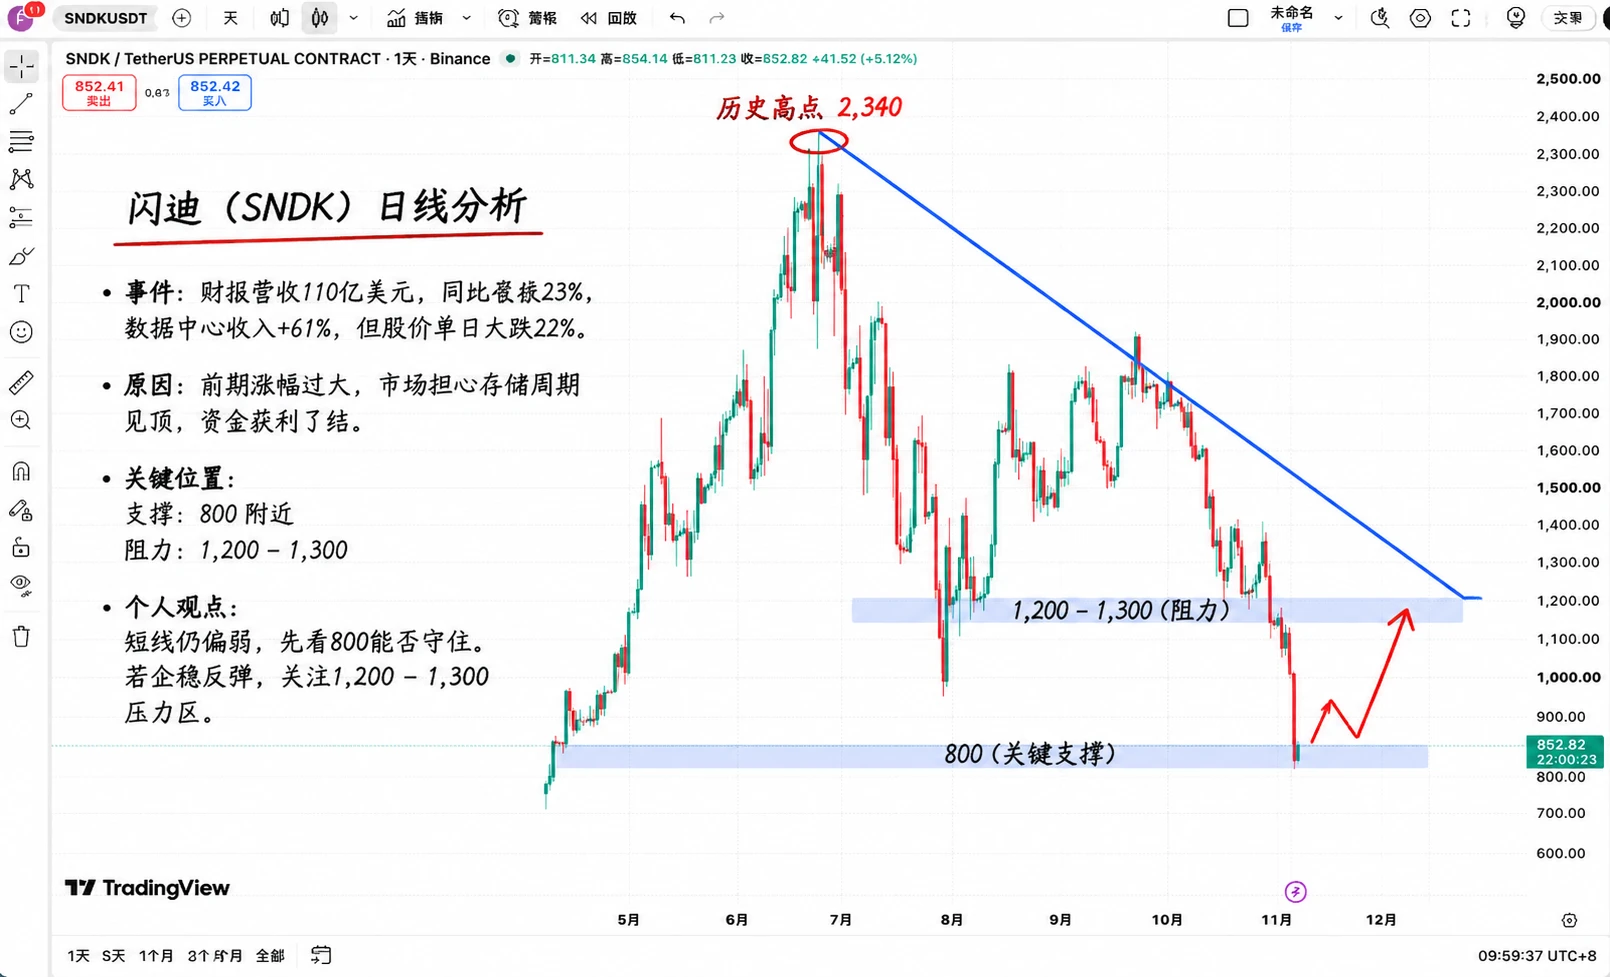
SanDisk really blindsided those who bought the rally this time! It just posted strong earnings, but its stock plunged 22% in a single day, dropping straight to $806.

What’s even more outrageous is that the results were not bad at all.

Revenue for the latest quarter was $11 billion, up 23% quarter over quarter, while data center revenue grew 61%. The company also announced a $5 billion share buyback and an 8-for-1 stock split.

With so much good news, the market still sold.

The reason is easy to understand. SanDisk had surged too much beforehand, and the market had already priced in AI stora
post-image
SNDK-22.24%
  • 1
11.6 Market Trend Analysis

ETH Strategy Reference Setup
Rebound zone: short around 2250--2270
Stop loss: 2310
First target: 2200, second target: 2150

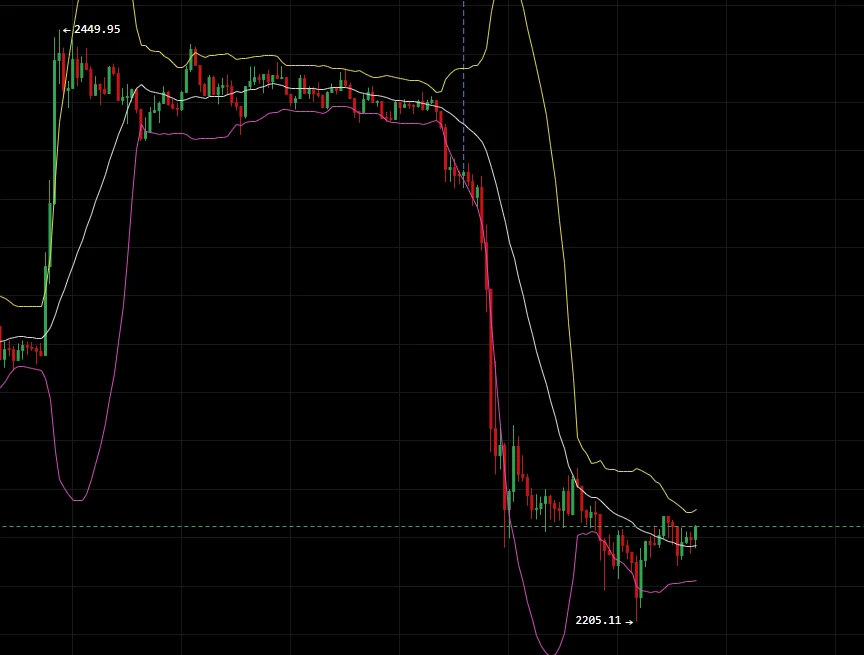
Dream of a surge shattered! A wave of heavy-volume selling directly reversed the short-term trend.

On the one-hour chart, after reaching a high of 2449.95, the market came under pressure and plunged. Heavy-volume long bearish candles successively broke through layers of key support, with the low reaching 2205.11 and the current price at 2238.32.
The previous bullish structure has been completely broken, with bearish selling pressure released i
post-image
BTC-0.65%
ETH-1.23%
Last night's recommendation at 2280 hit stop-loss; we can try again! Other plans remain unchanged.
This here ↓
has only just begun!!!
post-image
Myanmar A-shares: All responsibility lies with the U.S.!
U.S. stocks: It’s all the donkey’s fault!
Haha, the elephant is still the same elephant. It’s just that this world doesn’t work the way you think it does.
post-image
What Happens If BTC Breaks Above 82,000?
live-cover
LIVE1,210
Load More

Join 40 M users in our growing community

⚡️ Join 40 M users in the crypto craze discussion

💬 Engage with your favorite top creators

👍 See what interests you

Trending Topics

USStocksFaceHistoricSelloff

586 Views3.46k Discussing

U.S. stocks suffered a sharp selloff on Thursday, with the Nasdaq closing down more than 5% and the Philadelphia Semiconductor Index falling over 12%. AI and chip stocks including $NVDA and $AMD were hit especially hard. Markets are reassessing AI valuations, data-center spending and future returns. Is this just short-term deleveraging, or the start of a deeper correction in the AI trade? Which sectors are you watching next?

GateLaunchesPoSECProofOfSecurity

11.51k Views563 Discussing

USNonfarmPayrolls

8.95k Views3.97k Discussing

View More