Square
Following
Hot
News
Notifications
Profile
Share your thoughts
placeholder
Article
🔹Democrats Sweep Congress: Is a Major Shift Coming for Crypto? Tighter SEC Oversight and Prediction
live-cover
LIVE1,944
BTC keeps falling toward 74,000, and everyone’s exhausted from watching the charts. Strategy founder @saylor is actually posting an AI rap video.....
The caption says just one thing: AI can make me rap. It can't print Bitcoin.
His company is sitting on 849,327 BTC, and even with the price down this much, he still has the mood to play around with AI rap. After seeing red candles these past few days, I can’t even eat my lunch.
AI really can’t print Bitcoin, but it can’t save my portfolio either😭
post-image
BTC-0.67%
Trenches
ZIG
Z
bade
b
ZIG
0x8c...1145
Market Cap
$.
Change
.
24h Vol
$.
Holders
.
BTC
B
bade
b
BTC
C5xp...pump
Market Cap
$.
Change
.
24h Vol
$.
Holders
.
STONK
S
bade
b
STONK
6GmA...UNgx
Market Cap
$.
Change
.
24h Vol
$.
Holders
.
ANSEM
A
bade
b
ANSEM
9cRC...pump
Market Cap
$.
Change
.
24h Vol
$.
Holders
.
牛逼
牛
bade
b
牛逼
0x96...7777
Market Cap
$.
Change
.
24h Vol
$.
Holders
.
$UAI This -24.51% bearish candle is a textbook display of market-maker tactics. Let me simulate the market narrative: Dense sell walls appeared near 0.0890 early in the session. Retail traders saw “resistance” and were afraid to chase, but in reality, the market maker was creating the illusion of selling pressure by trading back and forth between its own accounts. Then it used a series of small, roughly 5,000U orders to push the price down. Each time it broke through a key level (0.07, 0.065), it ramped up volume to 5 million U in trading value to trigger panic. The 24-hour trading volume hit
UAI-7.58%
What exactly is the difference between isolated and cross margin? Why can the same loss have a completely different impact on your entire account?

In crypto futures trading, many people focus on leverage, entry prices, and stop-loss levels, but overlook an equally important question:

Are you using isolated margin or cross margin?

These two margin modes affect how margin is allocated, how account funds are used to bear risk, and how widely losses from a position may affect your account.

The core difference between isolated and cross margin is not that one is necessarily safer than the other
post-image
How to build a trade review system that turns every loss into a verifiable lesson?

Many traders watch candlestick charts every day and record their entry and exit prices, but rarely carefully record why they entered in the first place, why they exited, or whether a loss came from a flawed judgment, execution deviations, or trading costs.

If all you write down after every loss is “be careful next time,” then even after years of trading, you may just be repeating the same mistakes.

An effective review is not about explaining why you lost. It’s about identifying problems that can be verified w
post-image
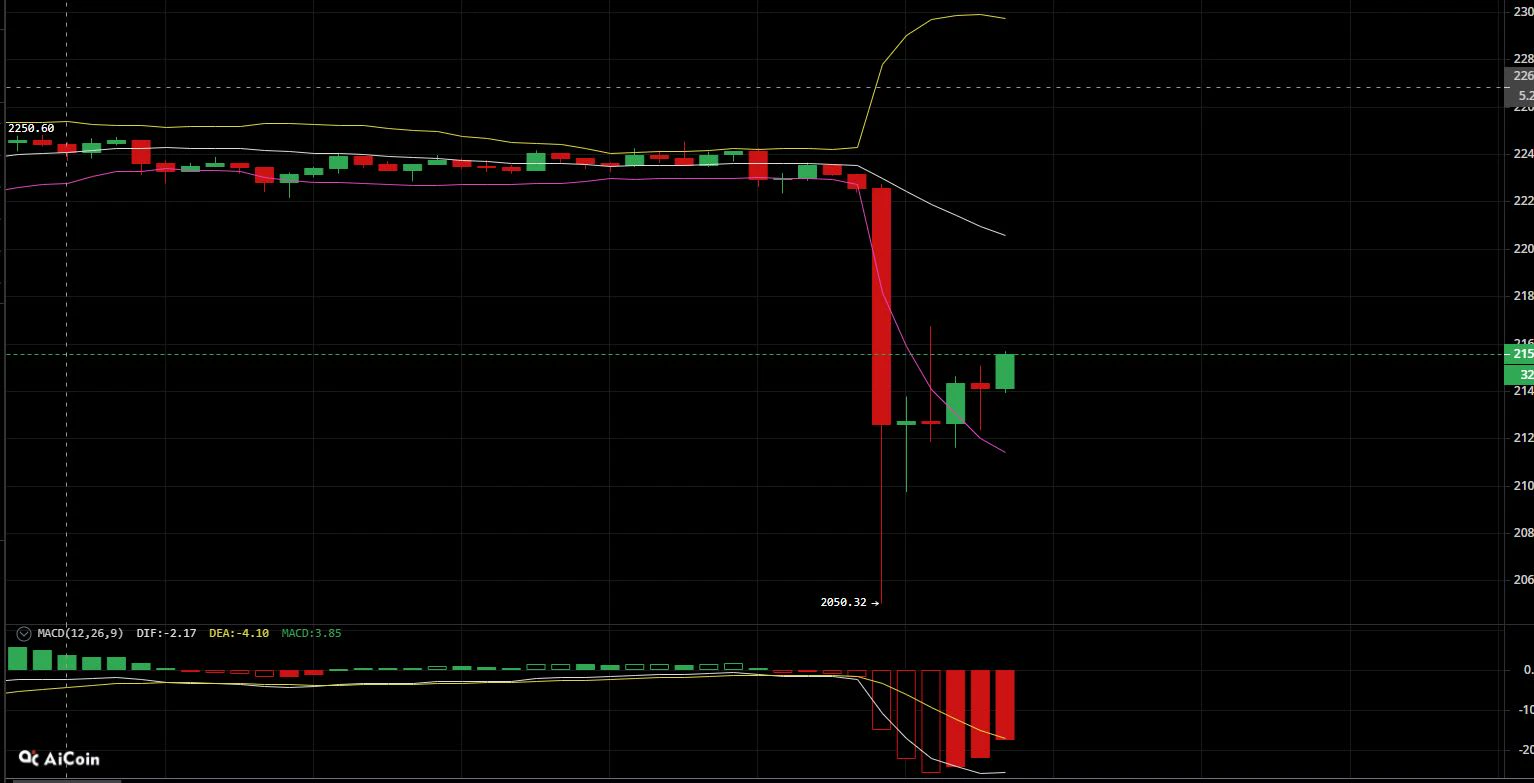
11.9 ETH Silk Road

### Market Analysis
$ETH ‌#美伊谈判出现新进展
The asset previously consolidated sideways for an extended period around 2250. A large bearish candle decisively broke below the trading range, and the price quickly dropped to 2050.32, unleashing concentrated bearish momentum. The current move is a technical recovery bounce after the sharp decline, with the price rebounding to around 2150 and the MACD green bars gradually contracting, indicating easing short-term selling pressure. However, a bearish moving-average alignment has formed, and the previous trading range combined with the
post-image
ETH-1.23%
Hey @grok, I see something in common.
Who is a target of a foreign intelligence effort?
How does foreign intelligence penetration work?
post-image
Tonight, I’m challenging myself to make 10,000 U in profit—just wait and see, you big shots! #山东济宁大壮哥 I’m going to become the richest person in our village
post-image
A Moment of Panic at $73,510! Is Bitcoin Shaking Out Weak Hands or Selling Off? $745 Million in Liquidations Send a Dangerous Signal

The Bitcoin market has increasingly started to feel like a TV series lately, with a new plot twist every day.
This time, SBTC suddenly plunged, hitting a low of $73,510 within 15 minutes before quickly rebounding. The whole thing happened so fast you might wonder if you missed several episodes.
However, what really made the market nervous was the liquidation data.
In just 1 hour, around $745 million in positions across the market were liquidated, including aroun
BTC-0.65%
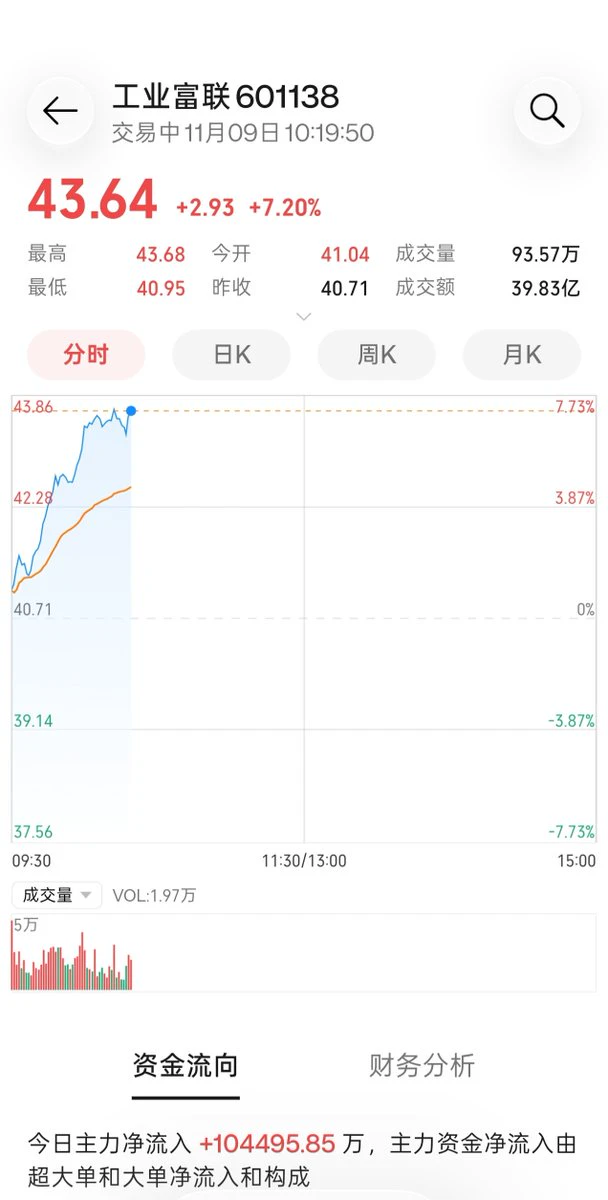
Jensen Huang’s affair, Nvidia’s board immediately launches an independent investigation, national security risks compounded by a top-level scandal
Foxconn Industrial Internet, which is deeply tied to Nvidia, still turned sharply higher today
Given the A-share market’s usual behavior, this shouldn’t be happening. Could it be because it had fallen too far earlier
post-image
NVDA+2.80%
How Can Out-of-Sample Testing and Walk-Forward Backtesting Help You Determine Whether a Trading Strategy Is Truly Reliable?

Suppose you spend several months researching a trading strategy, constantly adjusting its parameters, and eventually produce a beautiful historical return curve.

You might think you have found an effective method.

But there is a problem: if you repeatedly use the same historical data to adjust the strategy, does that return curve prove the strategy works, or merely show that you found the parameters best suited to that historical data?

This is the problem overfitting
post-image
Seems like $ESPORTS $ESPORTS is finally catching a bit of a bid after that nasty drop. Is this the floor or just another trap before we head lower? Watching the 15m closely to see if buyers actually show up here.TP: 0.00985SL: 0.008849Around the market:
$ETH : Current Price 2,146.75 - 24h Change: -3.90%
$AIO : Current Price 0.04771 - 24h Change: +14.74%
post-image
ESPORTS-5.30%
ETH-1.26%
AIO-3.19%
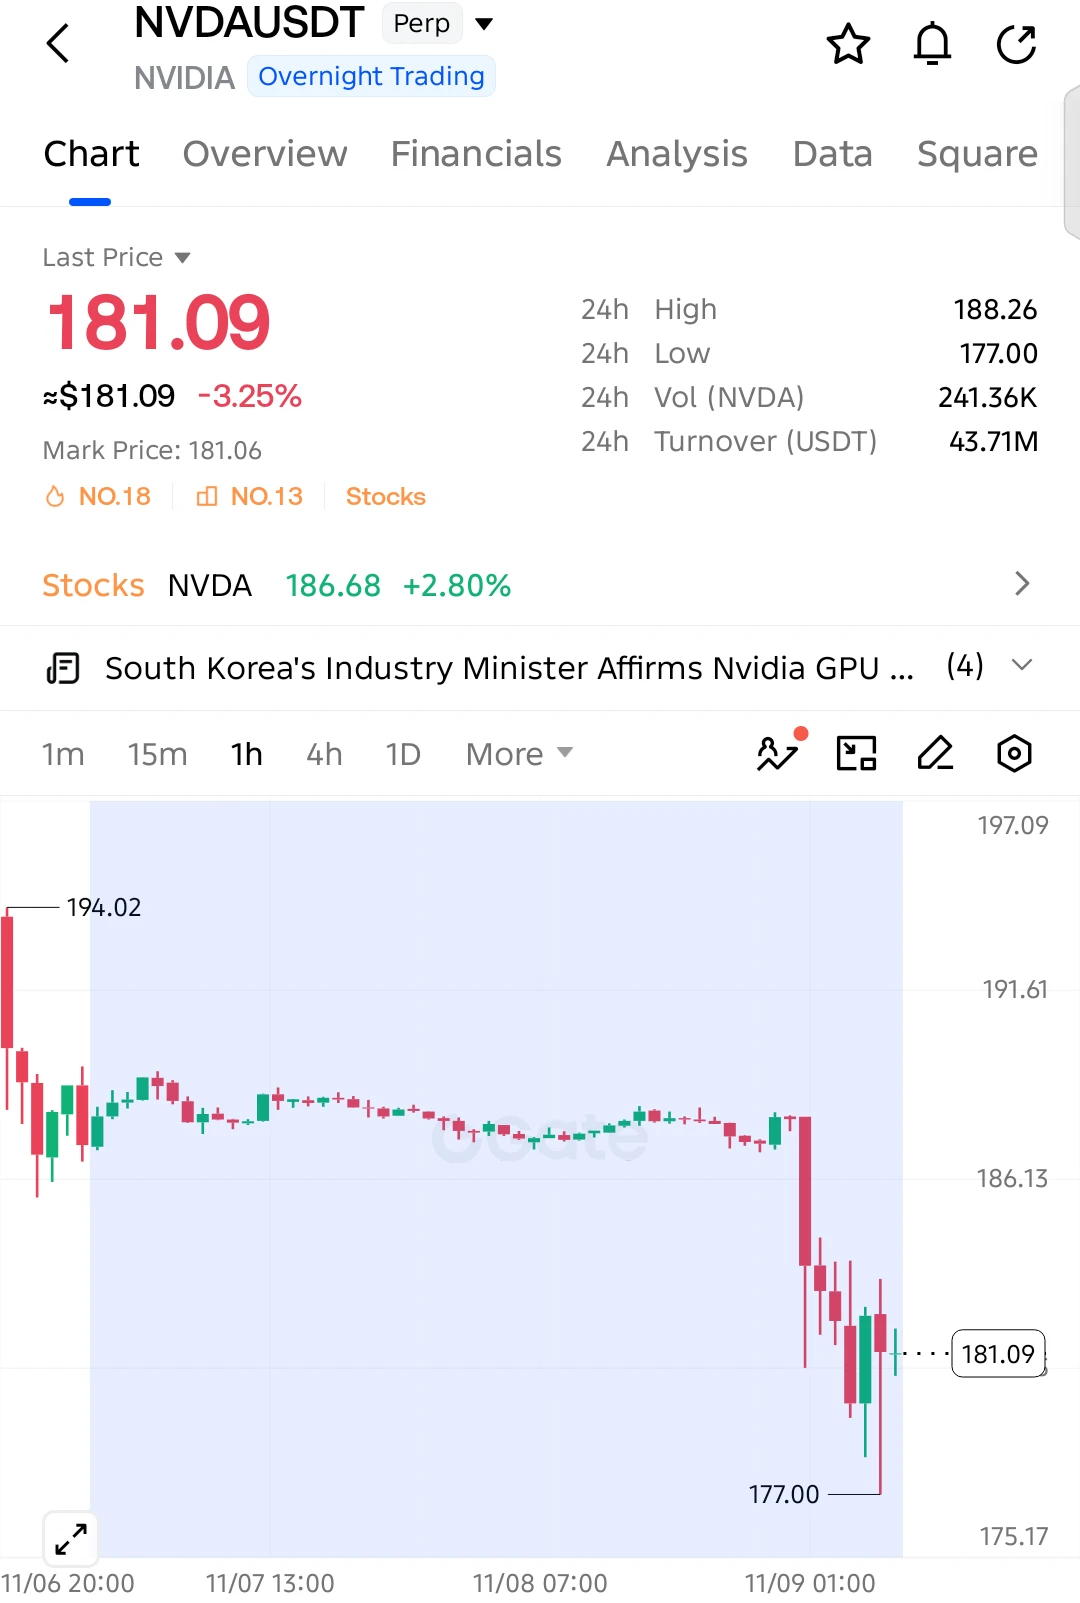
$NVDA SHORT SETUP — SELLERS TAKING CONTROL!

$NVDA is down 3.25% after a sharp breakdown from the 187 area. Buyers are struggling to recover, and another downside move could be developing!

Entry: 181.09
SL: 184.50

TP1: 177.00
TP2: 175.20
TP3: 172.50
Final Target: 170.00

Selling pressure remains strong as $NVDA trades below its previous support. The latest bounce from 177.00 shows some buying interest, but sellers still have the advantage below 184.50. A fresh breakdown below 177.00 could extend the decline toward 172.50 and potentially lower.

Invalidation: A sustained recovery above 184.50
post-image
NVDA-0.35%
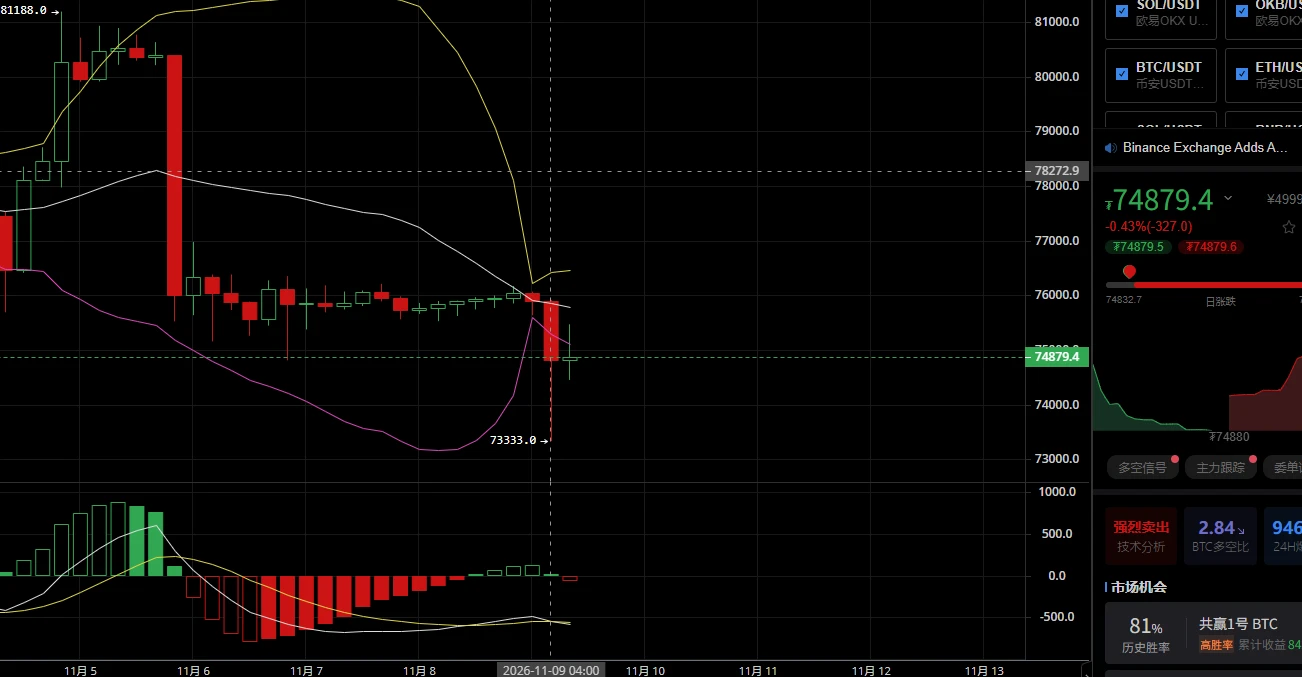
11.9 BTC trade setup
The chart shows BTC plunging sharply in the short term, hitting a low of 73333 before quickly recovering. This presents an oversold rebound opportunity after the sharp drop, with support below; the strategy is to trade a short-term rebound and go long.

- Entry range: 74600-74800; try a small long position near the current price. If it retests around 74200, you can add to the position.
- Stop loss: 73300. A break below this low would signal that bearish momentum is continuing and invalidate the long thesis, so exit the position.
- Take profit:
First target: 76000 (resistan
post-image
BTC-0.65%
Zec market update
live-cover
LIVE1,871
this is almost worse than callouts
post-image
The real-life Fast & Furious?
Why Do Spot Prices and Contract Prices Trade at a Premium or Discount?

Sometimes, you may notice that the BTC spot price and perpetual contract price are not exactly the same.

When the contract price is higher than the spot price, it is generally called a premium; when the contract price is lower than the spot price, it is generally called a discount.

Why does this happen?

Some believe that a premium means the market is bullish, while a discount means the market is bearish.

But the reality is much more complex.

Price differences between spot and contracts not only reflect market sentimen
post-image
BTC-0.65%
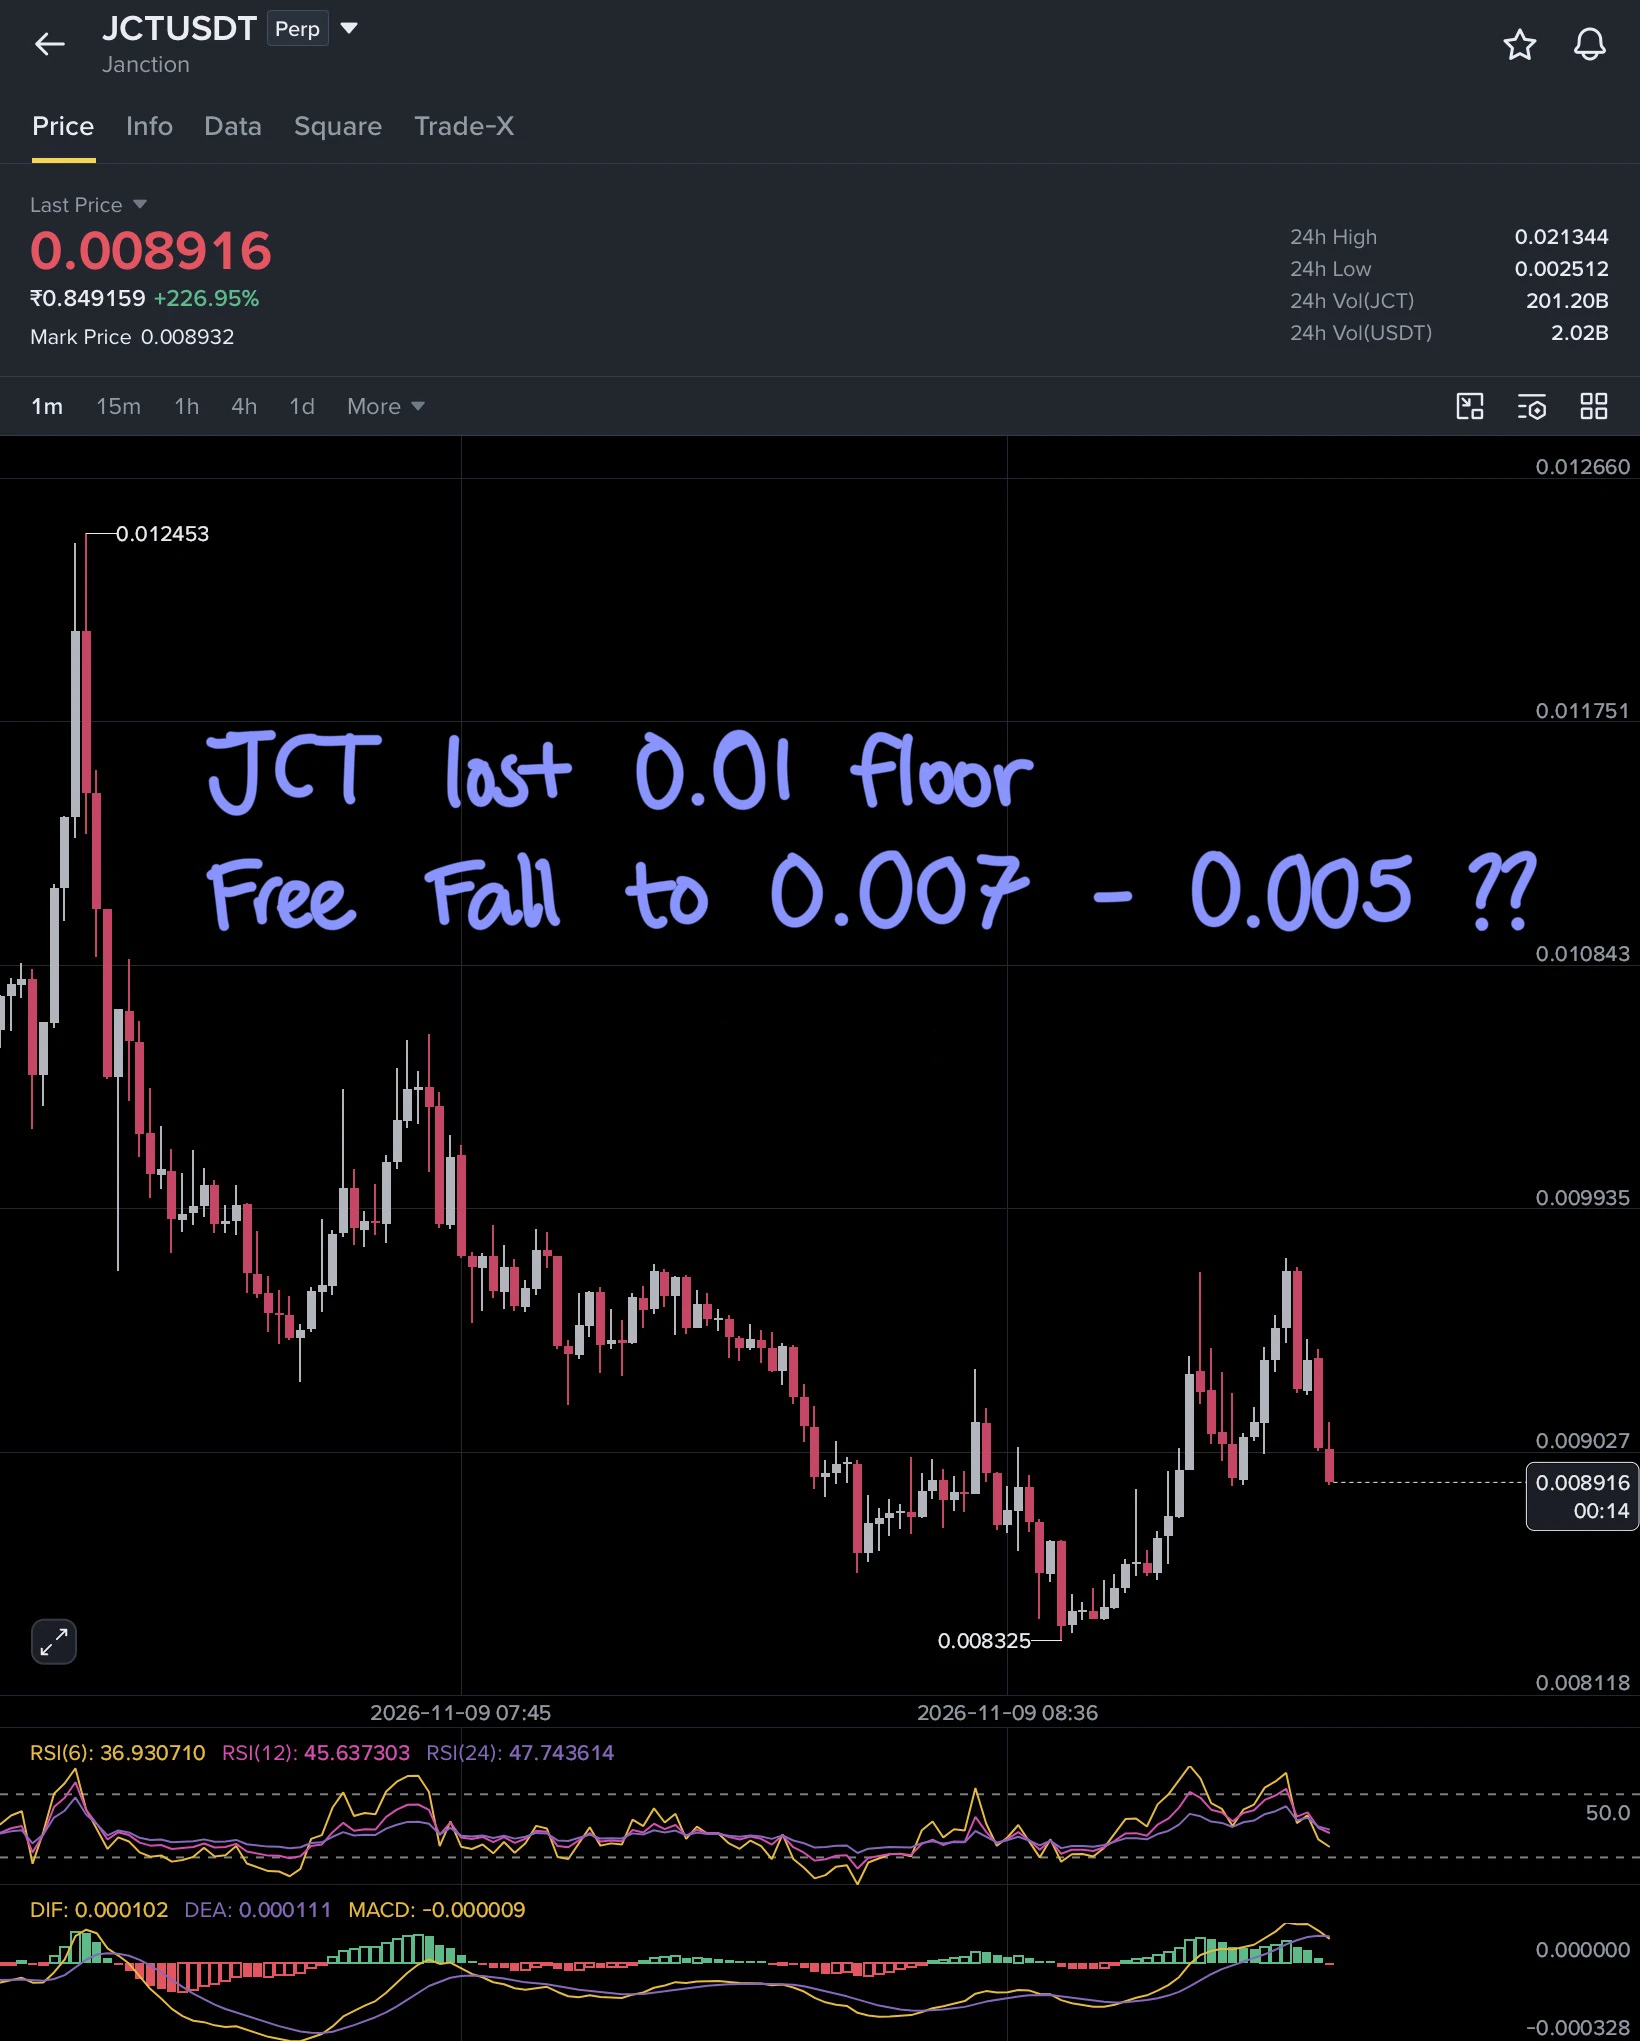
$JCT JUST LOST 0.01 , loosing 0.008325 will leads heavy sell pressure.

Price coming into Ground after Sharp Rally 🔻
post-image
CryptoSat
Good Morning Everyone, $JCT Trading signal for you . Have a Safe Ride 🥰
JCT-3.26%
Load More

Join 40 M users in our growing community

⚡️ Join 40 M users in the crypto craze discussion

💬 Engage with your favorite top creators

👍 See what interests you

Trending Topics

USCPIDataIncoming

22.8k Views1.73k Discussing

The U.S. October CPI report will be released on November 10 at 8:30 a.m. ET. September CPI came in at 3.7% year over year, and markets will be watching closely for signs that inflation is cooling, especially in core CPI. A softer-than-expected reading could strengthen rate-cut expectations, while hotter inflation may pressure risk assets through higher Treasury yields and a stronger dollar. How do you think this CPI print will move $BTC, U.S. stocks and gold?

BTCFlashCrash

22.73k Views66.05k Discussing

USAIStocksHitHard

31.41k Views3.75k Discussing

View More