Square
Following
Hot
News
Notifications
Profile
Share your thoughts
placeholder
Article
The 14th season of Legend of the Ten Thousand Demons Illustrated Record is finally here
It took quite a while for this season to arrive
After watching a few episodes, I realized the quality has gone up another notch
Now, as the leading Hongguo comic drama,
its quality can truly rival that of traditional top-tier comic dramas
But compared with traditional top-tier series like Ling Cage and The Outcast,
it still lacks a distinctive soul and charm of its own
post-image
Compared with the dot-com bubble, the Nasdaq has only climbed 2.2x during this AI boom, versus 4.2x over the same period in 1999. This time around, things are much less frenzied, and the valuation gap is actually much smaller. So don’t force the bubble narrative—slower gains don’t mean there’s no upside. Can $BTC hit $120,000? We’ll know by the end of the month. If you’re watching, follow along.
post-image
NAS100-0.07%
BTC-0.67%
Trenches
ZIG
Z
bade
b
ZIG
0x8c...1145
Market Cap
$.
Change
.
24h Vol
$.
Holders
.
BTC
B
bade
b
BTC
C5xp...pump
Market Cap
$.
Change
.
24h Vol
$.
Holders
.
Diamond
D
bade
b
Diamond
5VCE...pump
Market Cap
$.
Change
.
24h Vol
$.
Holders
.
STONK
S
bade
b
STONK
6GmA...UNgx
Market Cap
$.
Change
.
24h Vol
$.
Holders
.
DOGE
D
bade
b
DOGE
DoGE...fm7R
Market Cap
$.
Change
.
24h Vol
$.
Holders
.
$BIRB Down 21% in one day—those who chased at 0.1235 must be turning green now, right? Current price: 0.0953; 24h low: 0.0930; trading volume: 124M. This is a high-volume decline—not a shakeout, but a panic sell-off.
Let’s be blunt about the technicals: 0.0930 is the last line of defense today and the only support worth watching in the short term. Price has been hammered down from 0.1235 with almost no meaningful rebound along the way—a classic high-volume breakdown pattern. At 0.0953, it’s only 2% above the low, effectively “grinding right on support.” From here, there are only two paths: eit
BIRB-16.68%
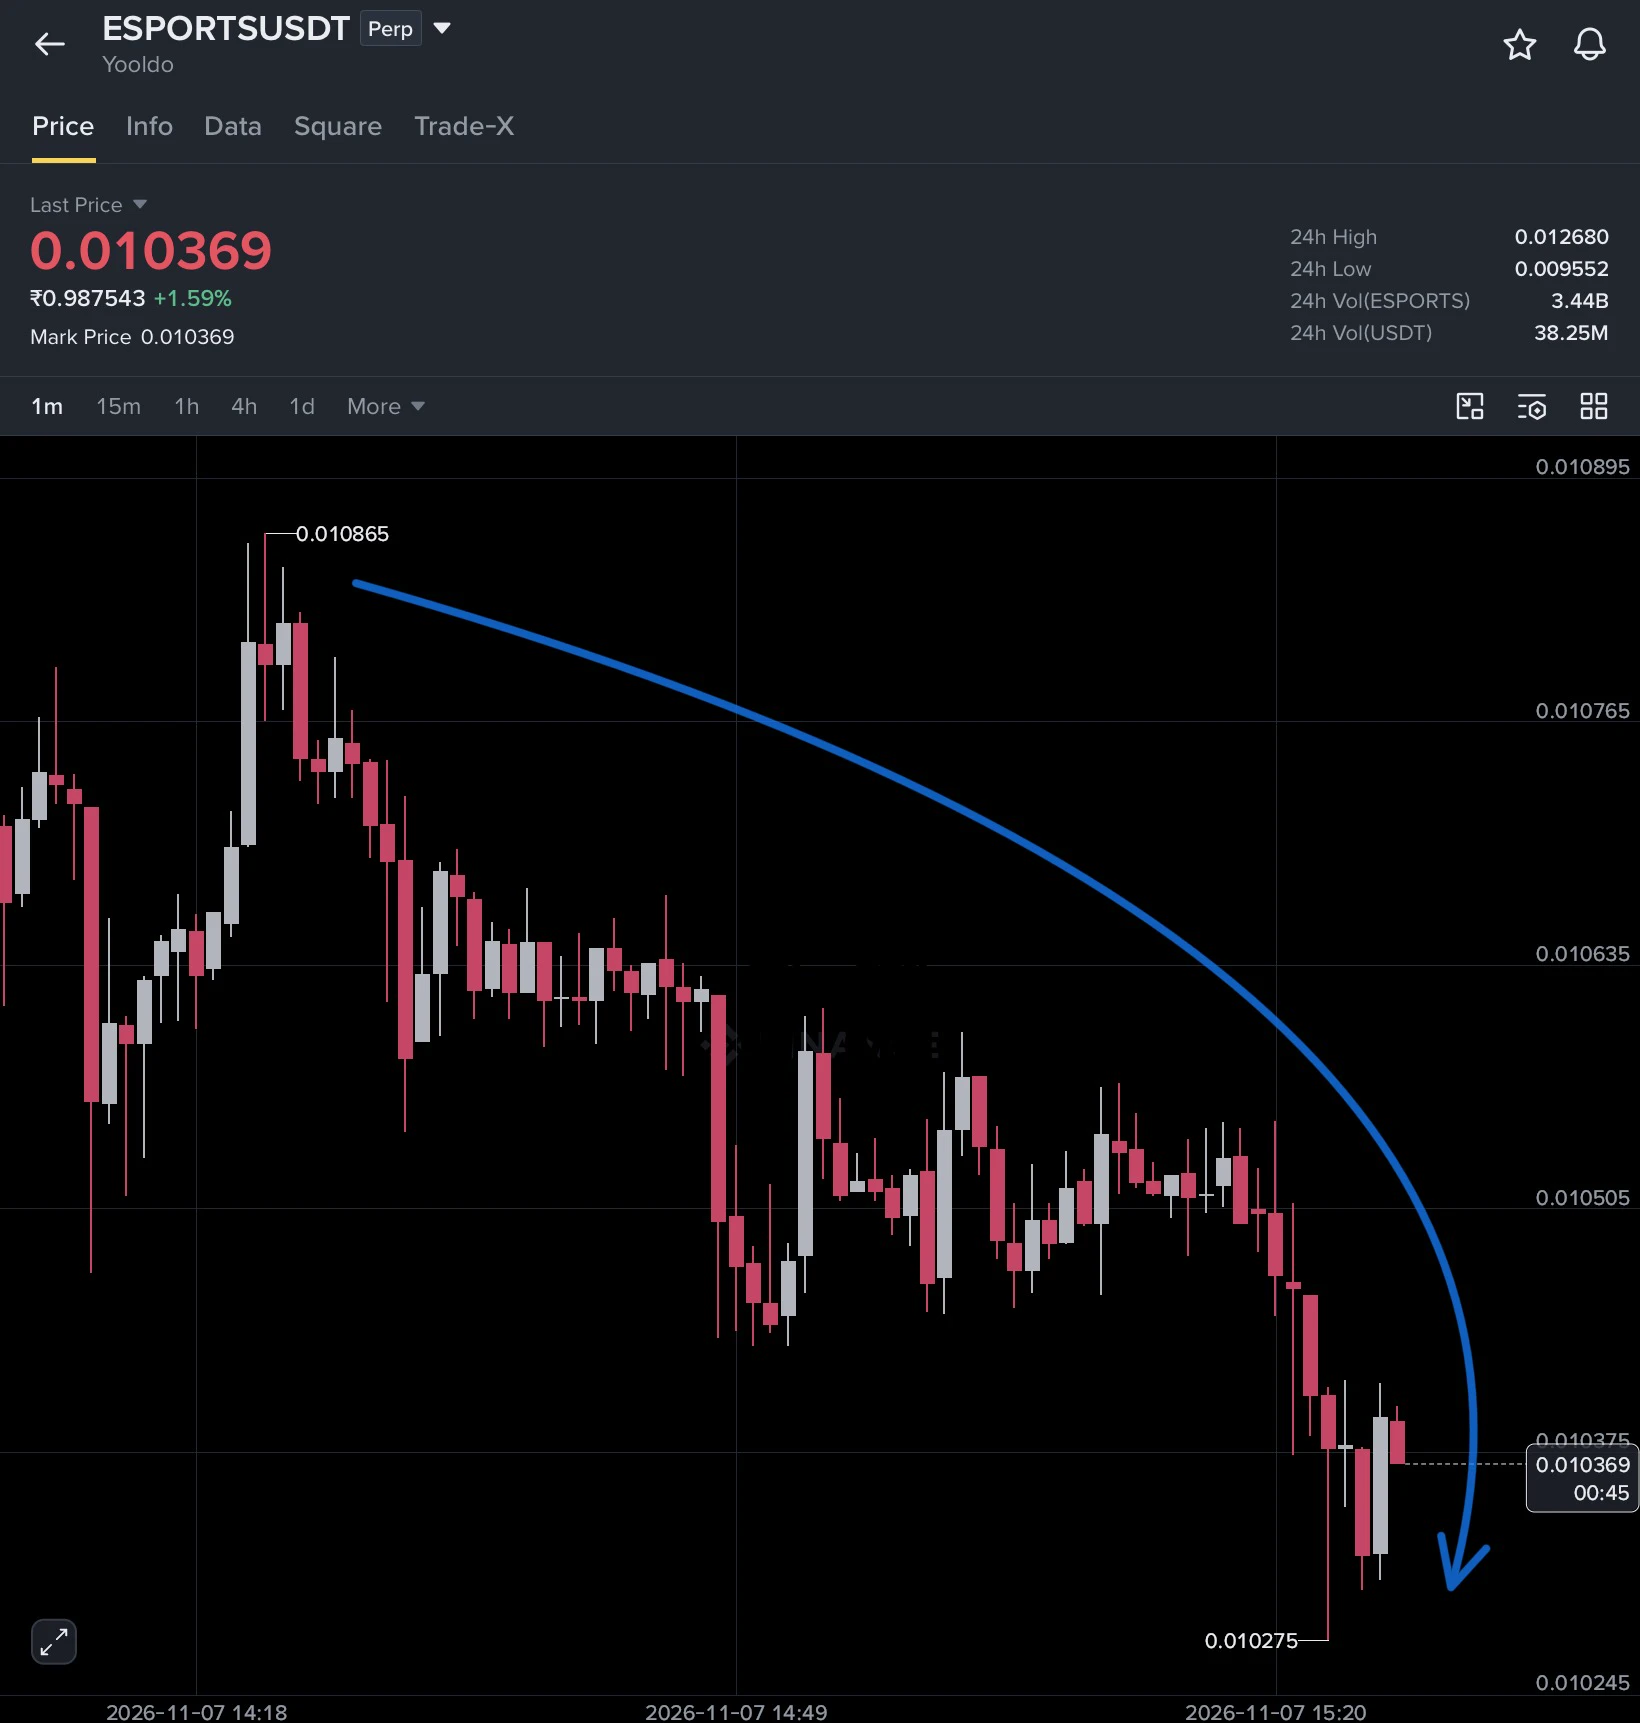
$ESPORTS First Target 🎯
post-image
CryptoSat
Esports Trading Signal

Don't miss big profits
ESPORTS-4.77%
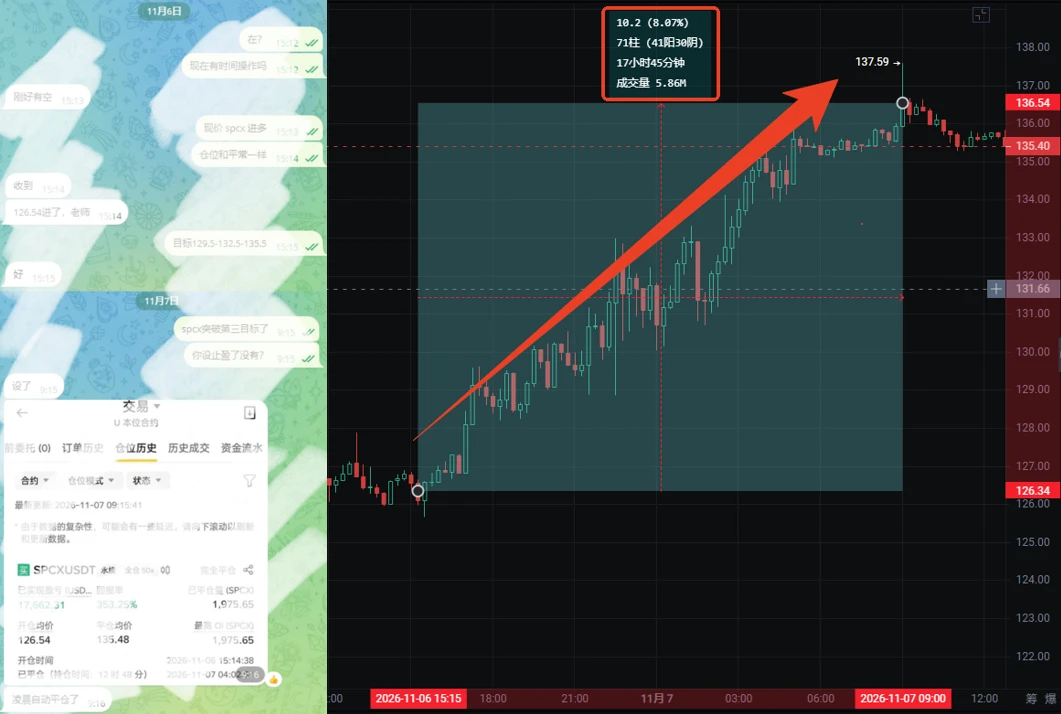
Musk serves up a late-night feast! $SPCX A blistering 8% rally in 17 hours—is 137 just the appetizer?

Musk laid it all out at the Baron Capital Conference on Friday: SpaceX’s Q4 revenue surged approximately 70% quarter over quarter, putting its annualized revenue on track for $100 billion, while its reliance on government contracts fell below 10%. Spurred by this, SPCX shot up from around 126, surging +8.07% in 17 hours and 45 minutes to a high of 137.59, with volume rising to 5.86M.

Meanwhile, Aave V4 has officially accepted SPCXc as collateral for borrowing USDC, opening the door to on-cha
post-image
SPCX+0.20%
$BTC ‌
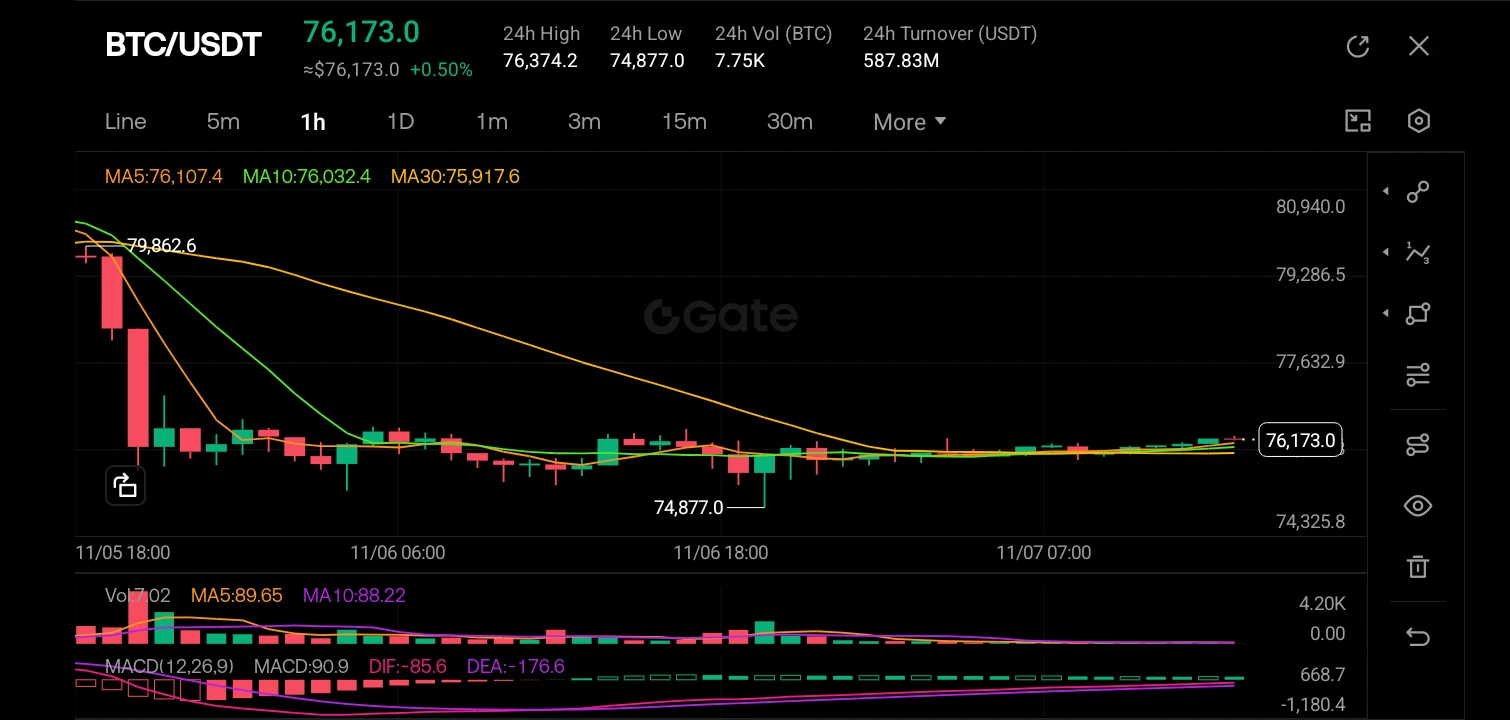
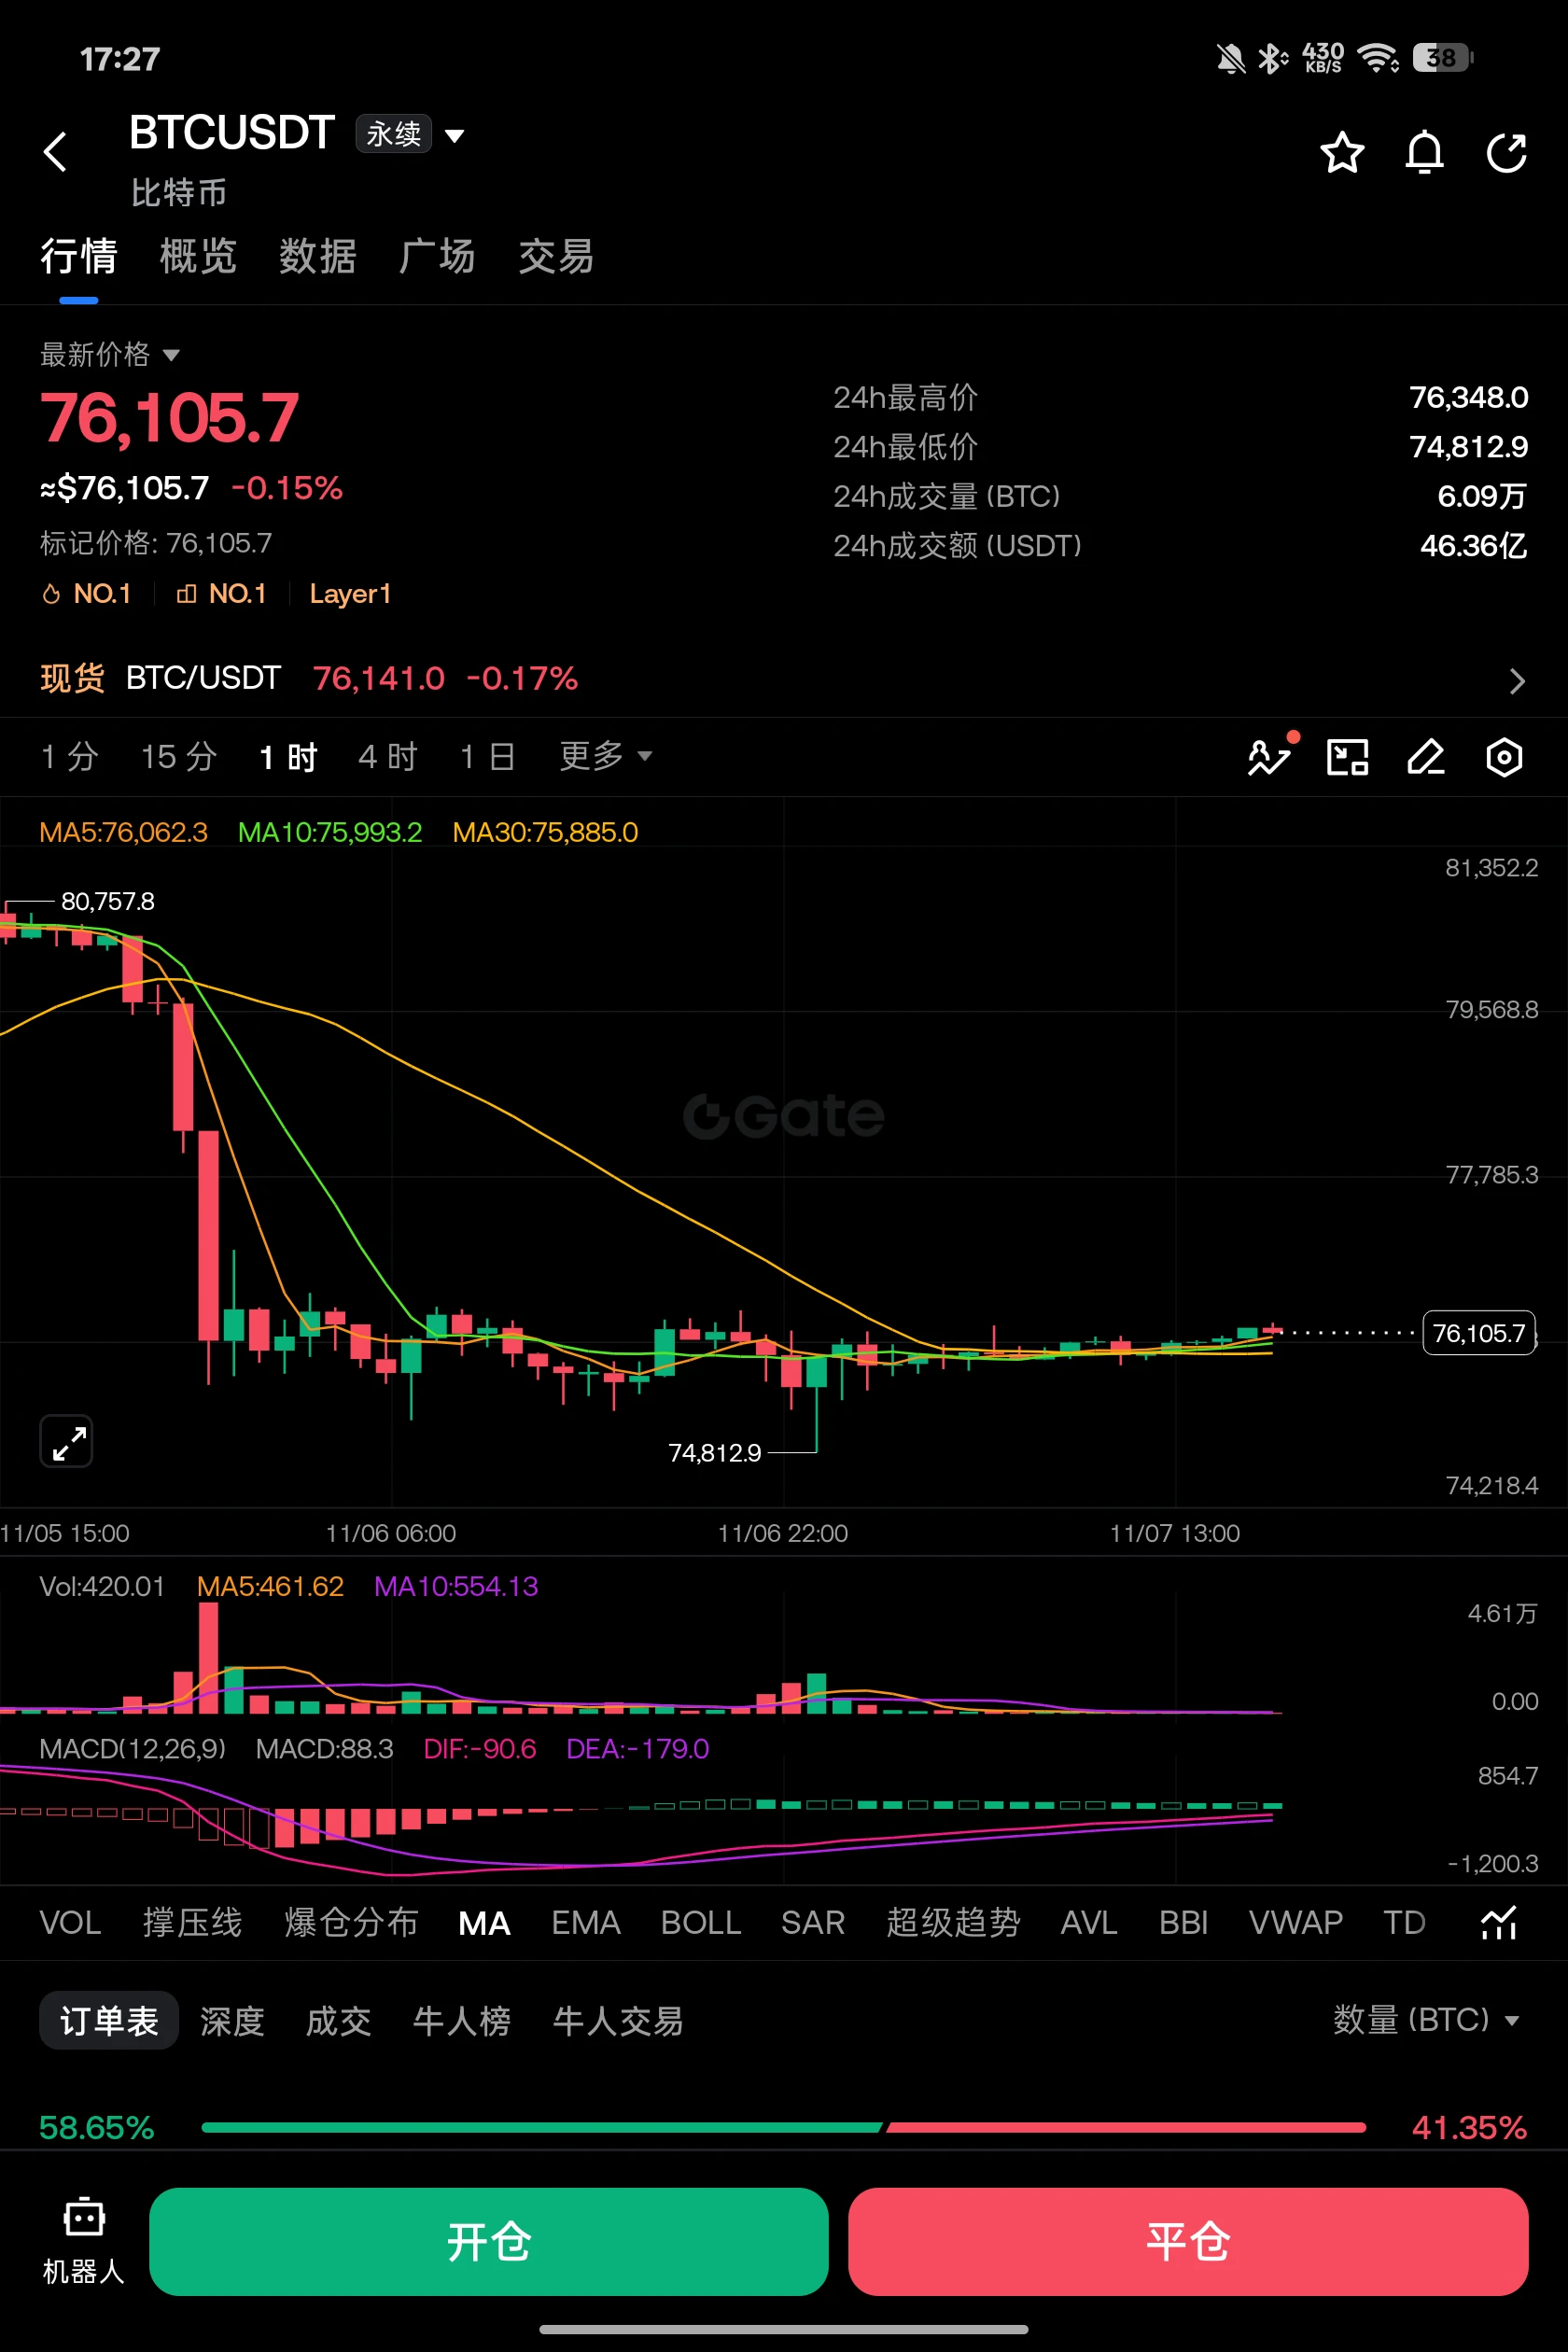
Price action is currently consolidating in a tight range between 74,877 and 76,374 following a sharp bearish impulse from the 79,862 level. The price is trading above the short-term moving averages (MA5 at 76,107 and MA10 at 76,032), indicating a temporary bullish relief bounce, though the MA30 at 75,917 acts as immediate dynamic support. Volume appears relatively flat, suggesting indecision, while the MACD shows a bullish crossover below the zero line, hinting at fading bearish momentum.

Candlestick Pattern.

The chart exhibits a series of small-bodied doji and spinning top candles n
post-image
BTC-0.67%
  • 2
I really can't think of how to refute this argument😂
post-image
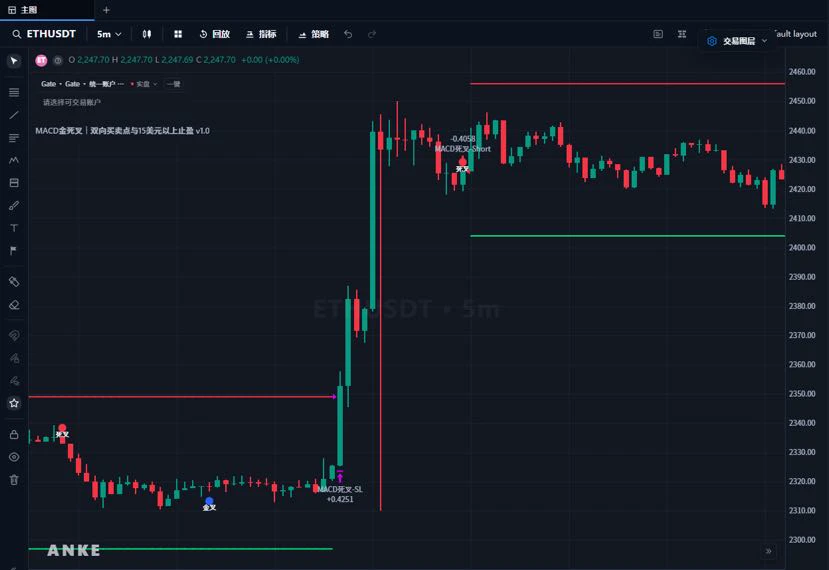
💡 You can try developing your own trading strategy even if you can't code!

You only need to describe your trading idea in one sentence, for example:

“When the MACD makes a bullish crossover and the price rises above the moving average, signal a long; when it makes a bearish crossover, signal a short.”

AI can help generate the corresponding indicator and standalone strategy code.

Make the complex coding process more intuitive, so traders can focus more of their energy on strategy logic and market research.

Your trading idea can start with a single sentence.
post-image
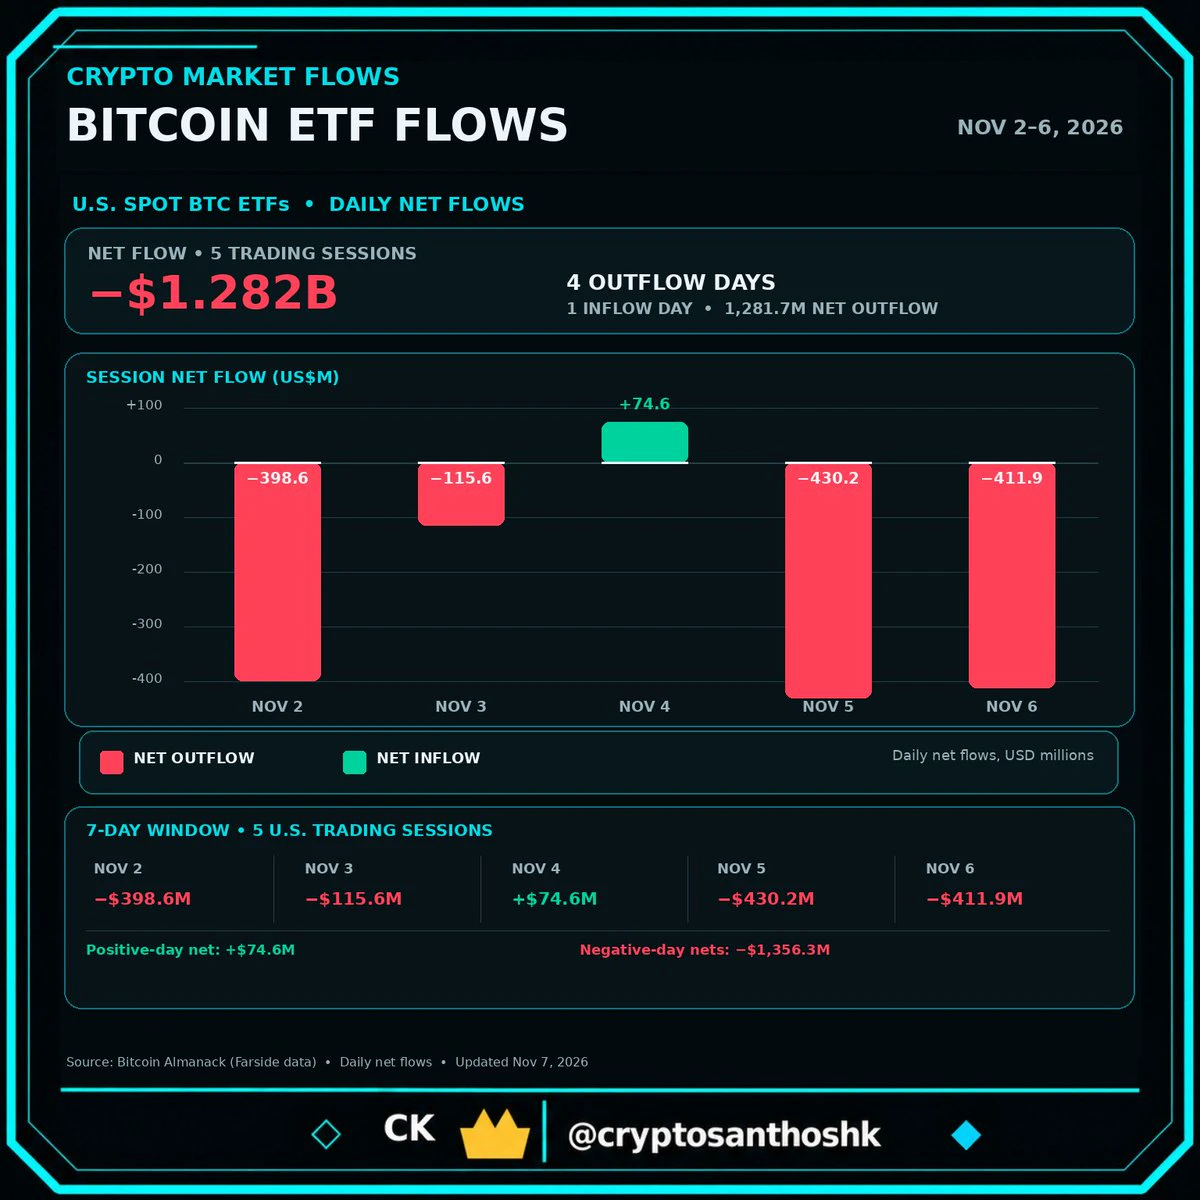
Approx $1.28 billion dollars Bitcoin ETF outflows happened this week.
Huge market sell off. Countries like Japan selling their bitcoin.
What's happening?
post-image
BTC-0.31%
  • 1
The market is fluctuating slightly, and the strategy is entering with a pending order#美股AI板块遭遇重挫
post-image
TheGreatWayIsFormless,YetIAm
Ethereum Bitcoin Strategy #US AI stocks sector suffers a major setback
The final rule allowing alternative investments such as crypto assets to be included in 401(k) retir
live-cover
LIVE1,457
#ShareWeekly #BTC #WCTCS9

Bitcoin approaching the $80,000 level creates an interesting situation for the crypto market. This is not just another psychological price milestone. It could become an important turning point for market sentiment, especially if a large number of leveraged short positions are forced to close.

The reported $1.45 billion in potential short liquidations deserves attention, but I believe traders should understand how a short squeeze actually develops before assuming that BTC will automatically experience a massive rally.

Why Is $80,000 So Important?

The $80,000 level
BTC-0.65%
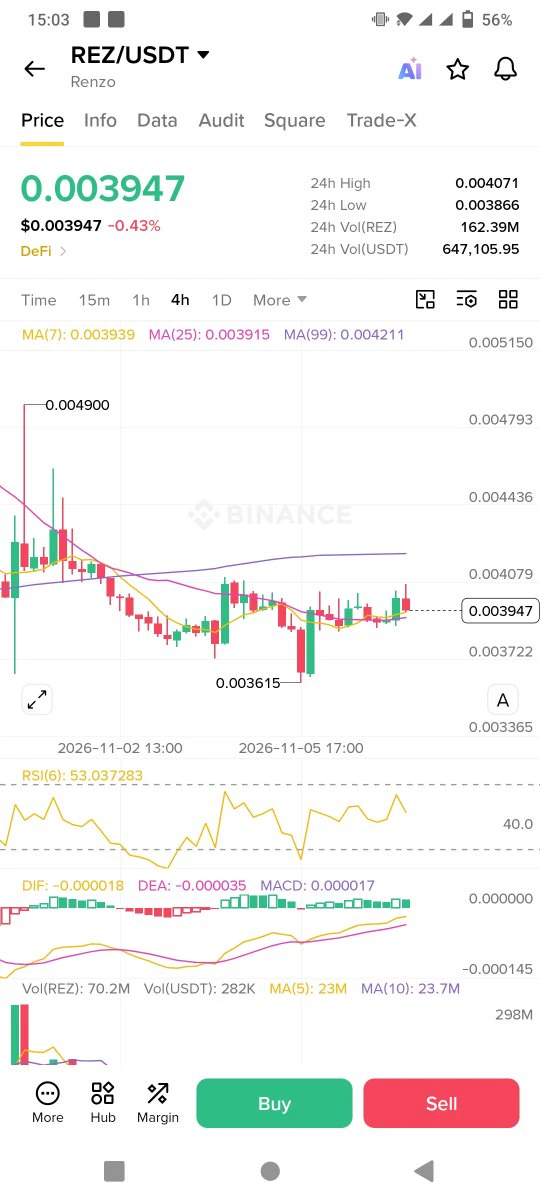
$rez 2nd leg pump coming 🚀🚀
Top gainer soon 🔥
post-image
REZ+8.16%
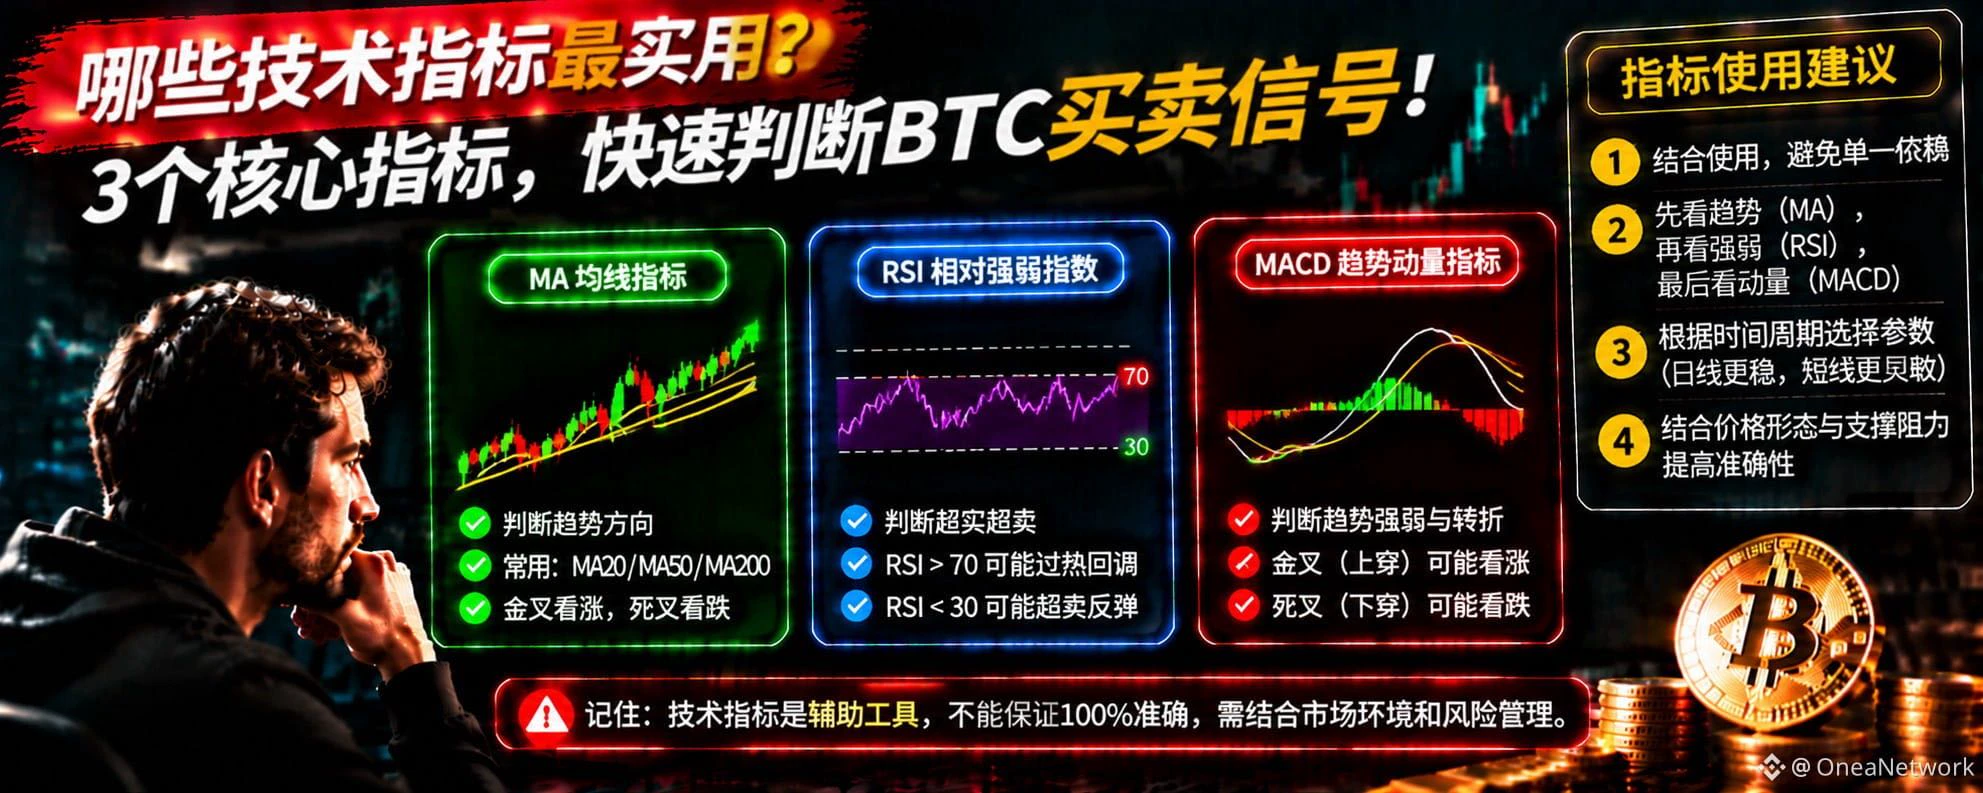
Which technical indicators are most useful? 3 core indicators to quickly identify BTC buy and sell signals
In cryptocurrency trading, many beginners like to add all kinds of technical indicators to their candlestick charts. They don't want to miss a single one: RSI, MACD, moving averages, Bollinger Bands. But do more indicators really make it easier to earn money?
In fact, the most important thing in technical analysis is not how many indicators you use, but understanding what problem each indicator can solve.
The first is the moving average (MA). It mainly helps identify market trends. For ex
post-image
BTC-0.67%
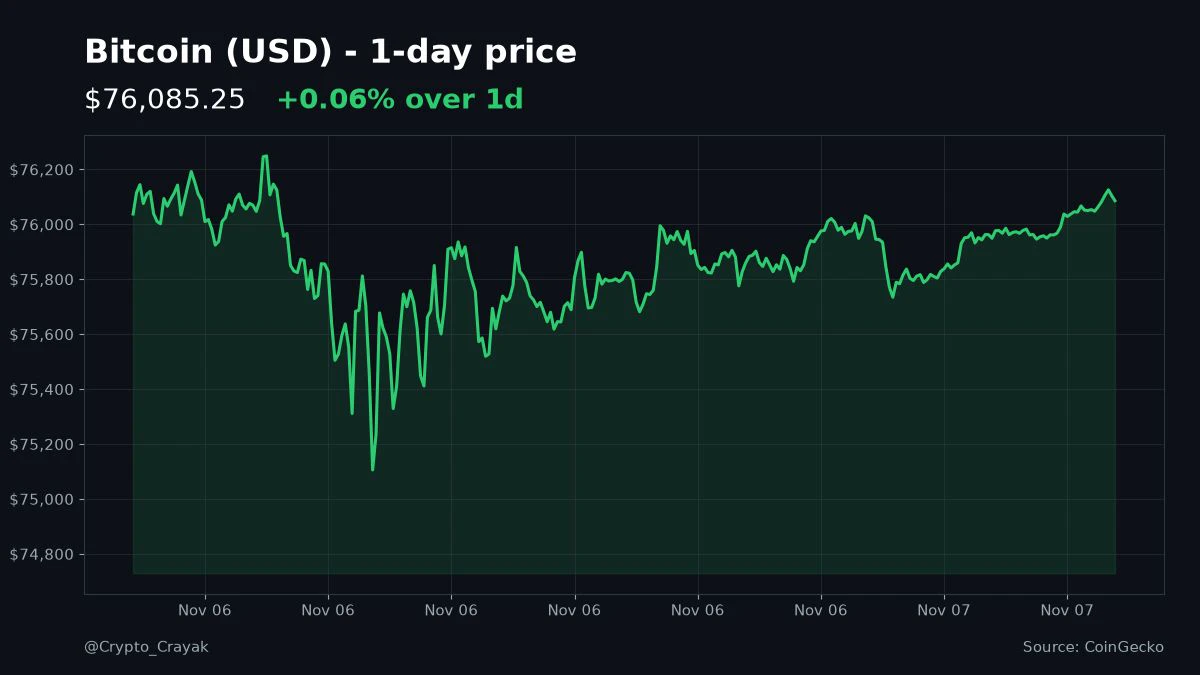
Up way too early and Bitcoin's still glued near $76K. Barely moved overnight after dipping to about $75K. I should be sleeping, not refreshing this. Anyone else up watching nothing happen? #Bitcoin
post-image
BTC-0.67%
Can some people become addicted to cosmetic surgery?
Why insist on getting surgery when they’re already so good-looking?
The final rule allowing alternative investments such as crypto assets to be included in 401(k) retir
live-cover
LIVE1,454
Review and Learning Notes
Today is the final day for the 5-day moving average, and it currently looks set to close with a long bearish candle.
The larger trend remains bearish. There are two key zones: 2290–300 and 2350–2380, both facing significant resistance. You can open a starter position in the first zone; a break above the second resistance level would invalidate this bullish setup.
Conversely, if the price retests lower levels, BTC below 80k remains in a bearish trend. Only a breakout and sustained hold above that level would signal a potential reversal.
Note: This is just my personal f
post-image
$ONE has surged from around $0.00103 to $0.00194 on this 4H chart, with $0.0020 now the key test.

I’m watching $0.00175–$0.00180 for support. Holding this zone could support another push, while losing it could bring $0.00160 into focus.

My view: strong momentum, but I’d wait for a stable retest before chasing these candles.

#ONE #Crypto #Gate!
post-image
ONE-1.19%
#BTCETFOutflowsContinue
Bitcoin (BTC) Market Analysis – November 7, 2026

Bearish short-term sentiment

Bitcoin has experienced significant volatility following the latest U.S. stock market sell-off. After falling toward $75,000, BTC showed signs of recovery and recently traded around $76,000. Fortune +2

What is putting pressure on Bitcoin?

* Technology stock sell-off: Heavy losses in AI and semiconductor stocks have weakened overall investor confidence.

* Interest rate expectations: Strong U.S. employment data has increased concerns that interest rates could remain higher for longer.

* M
GER40-2.00%
  • 4
Load More

Join 40 M users in our growing community

⚡️ Join 40 M users in the crypto craze discussion

💬 Engage with your favorite top creators

👍 See what interests you

Trending Topics

USAIStocksHitHard

17.41k Views3.65k Discussing

U.S. stocks sold off sharply on Thursday, November 5 (UTC). The Nasdaq closed down around 5.5%, entering correction territory, while the Philadelphia Semiconductor Index plunged roughly 12%, with chip stocks including $NVDA and $AMD posting steep losses. Beyond profit-taking, investors are growing concerned about the pace of AI data center construction, capital spending, and future returns on investment. The key question now is whether the AI sector’s lofty growth expectations need to be repriced. Where do you think the next opportunities will emerge: chip stocks, tech giants, or other sectors?

USNonfarmPayrolls

26.04k Views4.28k Discussing

StakeOnLaunchpoolToShare450KVLX

4.29k Views786 Discussing

View More