Square
Following
Hot
News
Profile
Share your thoughts
placeholder
Article
📘 What is AI computing power? Understand it in just one minute!
Simply put, AI computing power is the computational capacity needed for artificial intelligence to perform computing tasks.
For example:
🔹 AI needs computing power to learn from large amounts of data.
🔹 AI needs computing power to generate images and videos.
🔹 AI assistants also need computing power to answer questions and perform tasks.
Infrastructure such as GPUs, servers, networks, and data centers collectively support the operation of many AI applications.
Understanding AI computing power is an important step in learning a
post-image
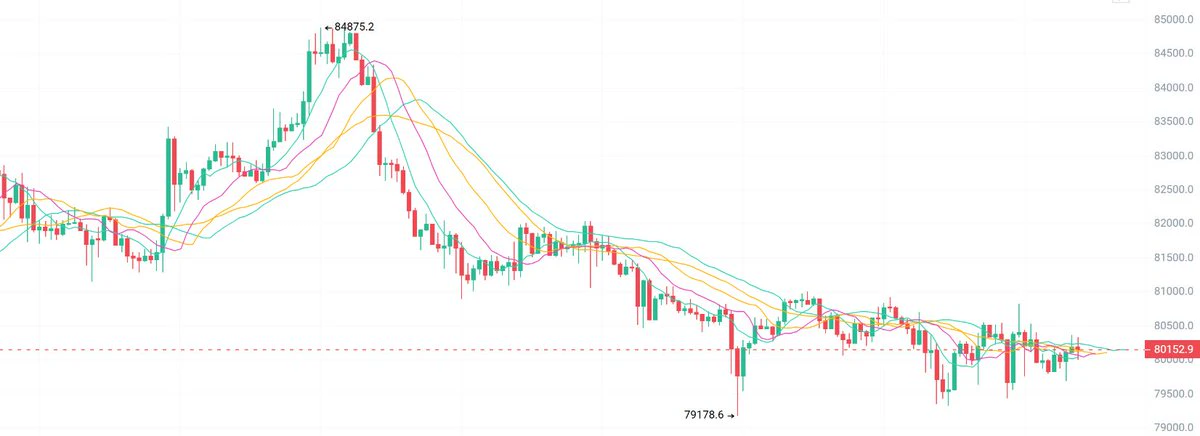
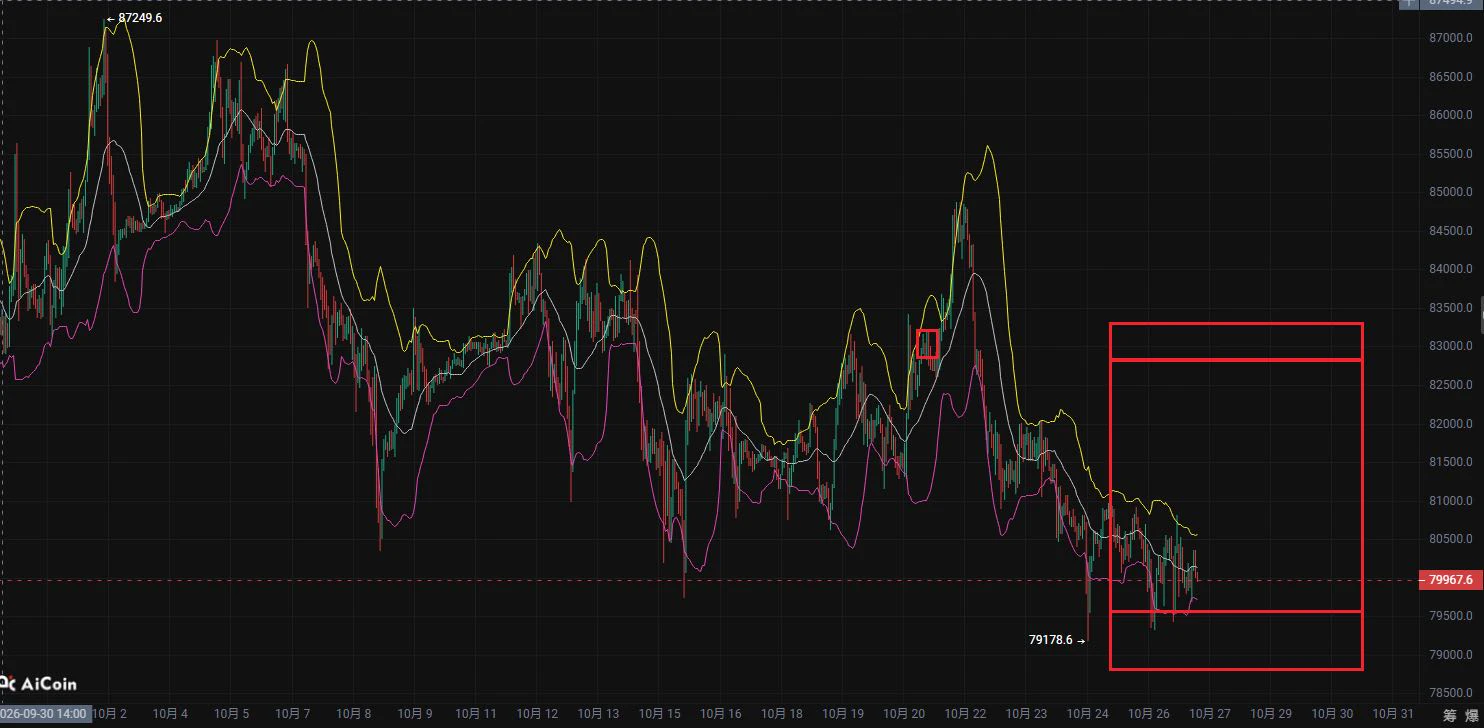
On 10.27, BTC is near 80500—open a small short position, targeting 79500/79200.
For those looking to go long, wait for stability near 79200 before entering. Stop-loss at 78800, targets 80000/80500.
On the 1H chart, price has fallen from 84875, bottomed at 79178, and then moved sideways. Overall, the trend remains weak.
80000 is the current battleground between bulls and bears. For a rebound, watch resistance at 80500/81000 first.
With 9 years of trading experience, Master Ye doesn’t try to call the bottom—he waits for the right levels.
The opportunity is right in front of you. If you’re willin
post-image
BTC-0.67%
Trenches
STONK
S
bade
b
STONK
6GmA...UNgx
Market Cap
$.
Change
.
24h Vol
$.
Holders
.
CNPY
C
bade
b
CNPY
0xc6...ddd2
Market Cap
$.
Change
.
24h Vol
$.
Holders
.
ZIG
Z
bade
b
ZIG
0x8c...1145
Market Cap
$.
Change
.
24h Vol
$.
Holders
.
Q
Q
bade
b
Q
0xc0...0589
Market Cap
$.
Change
.
24h Vol
$.
Holders
.
LAUNCH
L
bade
b
LAUNCH
AhBi...Qj6C
Market Cap
$.
Change
.
24h Vol
$.
Holders
.
new update
live-cover
LIVE1,730
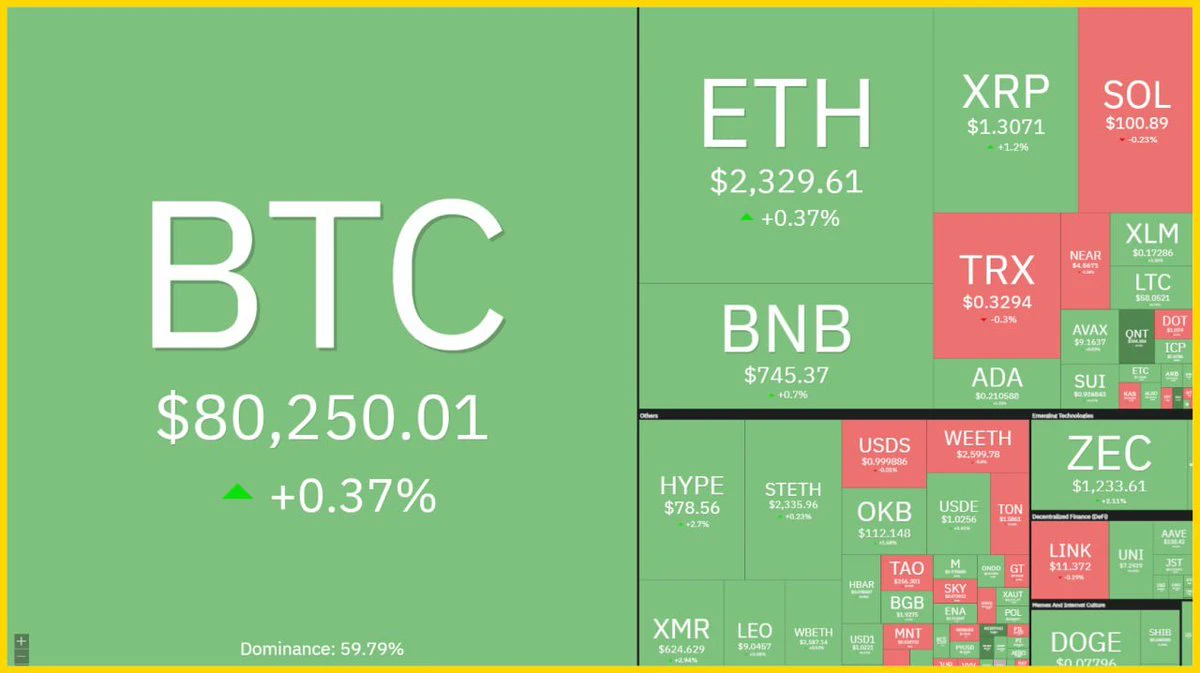
MARKET OVERVIEW: OIL REMAINS ELEVATED, BITCOIN MOVES SIDEWAYS, ALTCOINS UNDER PRESSURE
Oil remains elevated amid concerns that conflict could resume. U.S.-Iran talks have made no breakthrough, as the two sides remain at odds over reopening the Strait of Hormuz, lifting the blockade, and nuclear commitments.
Anthropic has filed for an IPO, sending a positive signal for AI stocks. First-half revenue reached $16.3B, Q2 operating profit was nearly $1B , and free cash flow was positive. However, a $2,000B valuation is still considered very high.
U.S. stocks closed higher, led by chipmakers and AI s
post-image
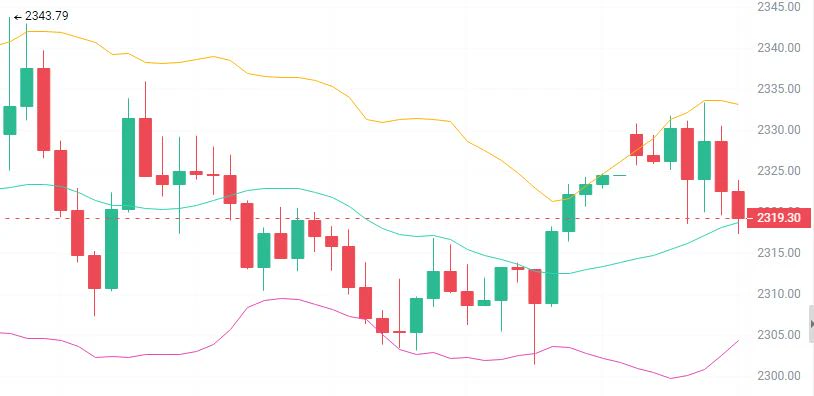
Early-morning ETH outlook
Trade:
Short around 2330-2350
First target: 2310-2290
Second target: 2270-2220
Set a stop-loss
ETH is broadly in a choppy downtrend. The current price is neither here nor there, and indicators have just shown a weak recovery, so do not chase shorts. Patiently wait for the price to rebound into the overhead resistance zone (near the upper band or previous high), then enter with a small position after a clear sign of stalling and a bearish candle close. Target the lower band and previous low support. Set protection above the key previous high; exit decisively if it brea
post-image
ETH-1.23%
A brief analysis of BTC’s short-term trend based on Dow Theory, Chan Theory, Elliott Wave Theory, volume-price relationships, order flow, and price action (strategy recommendations)
Comprehensive assessment
Dow Theory confirms that the 79,275 panic low broke the downtrend structure
Chan Theory first buy confirmed + break-low reversal structure
Elliott Wave Theory: Y' wave ended; new impulsive wave ① underway
Volume-price relationship: 20.3 billion record volume + 1.245 billion Delta = sellers completely flushed out
Order flow: +1.245 billion is the strongest accumulation signal of the year
Pri
BTC-0.67%
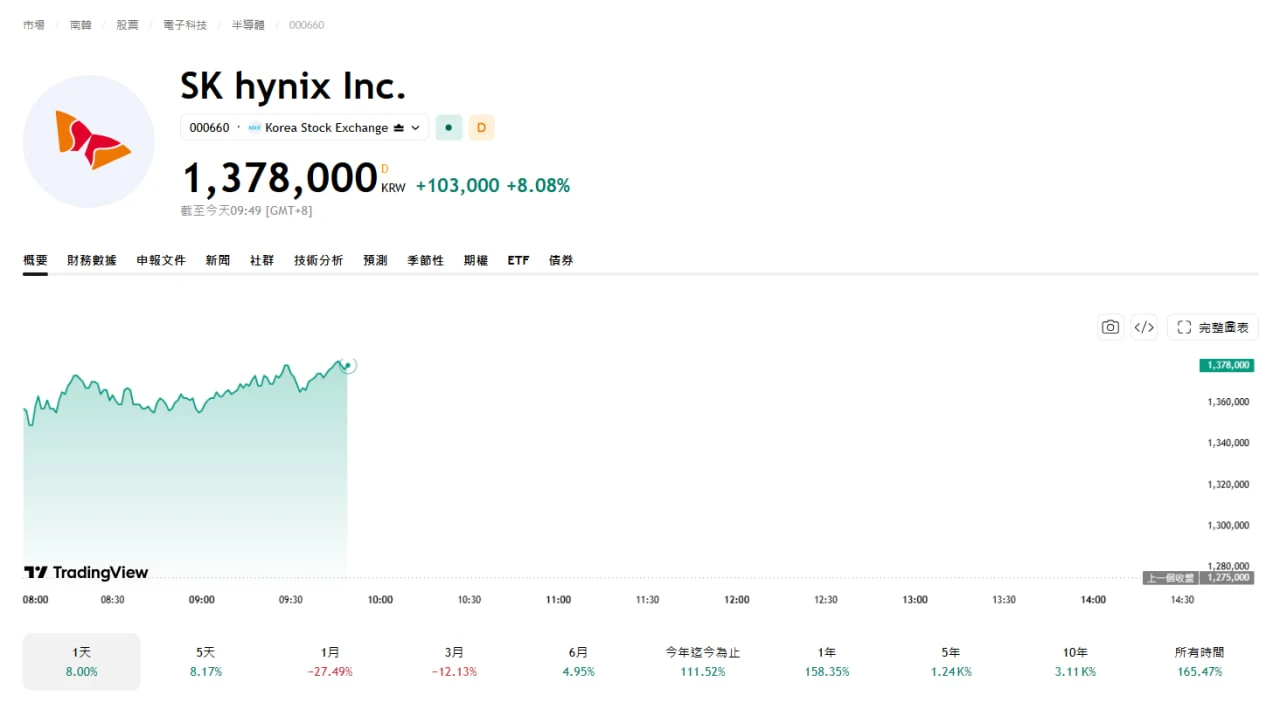
Watching $SKHYNIX soar all the way up, as if it had forgotten what gravity is. It feels like the RSI must be begging for mercy right now, but nobody seems to be listening. Take profit: 993.51Stop loss: 1,078.31Popular coins: $BULLA : Current price 0.1539 - 24-hour gain: +69.05%$BTC : Current price 80,260.1 - 24-hour gain: +0.37%
post-image
SKHYNIX+1.41%
BULLA+10.92%
BTC-0.67%
🔮 Crypto, stocks, gold, macro trends, prediction markets...
Whatever your area of expertise, you're welcome to join Gate Live, consistently create high-quality content, grow your influence, and earn steady income!
🎁 New streamers can earn up to $100 in rewards
💰 Earn up to 40% in livestream mining rebates
🔥 0% commission on subscription revenue
👥 Build your own community and cultivate a core following
Connect with tens of millions of users in your niche and let more people discover your expert content!
👉 Go live now: https://www.gate.com/live
post-image
GLDX-0.40%
PAXG+0.37%
  • 10
  • 5
🗓️ Earnings season coincides with a week of macro events—there’s a lot to watch this week!
This week’s curated Gate Live streams will help you stay on top of the market’s key developments👇
🏦 What signals will the Fed decision send?
📊 Can tech giants deliver strong results in AI and cloud?
🔍 With macro data rolling out one after another, which will find direction first: BTC, U.S. stocks, or gold?
💡 Open the Gate APP and search for “Gate Live Chinese” to reserve a spot for the streams you’re interested in and get a reminder as soon as they start!
One-click access: https://www.gate.com/live
GateLiveChinese
🗓️ Earnings season coincides with a week of macro events—there’s a lot to watch this week!
This week’s curated Gate Live streams will help you stay on top of the market’s key developments👇
🏦 What signals will the Fed decision send?
📊 Can tech giants deliver strong results in AI and cloud?
🔍 With macro data rolling out one after another, which will find direction first: BTC, U.S. stocks, or gold?
💡 Open the Gate APP and search for “Gate Live Chinese” to reserve a spot for the streams you’re interested in and get a reminder as soon as they start!
One-click access: https://www.gate.com/live
repost-content-media
BTC-0.67%
  • 2
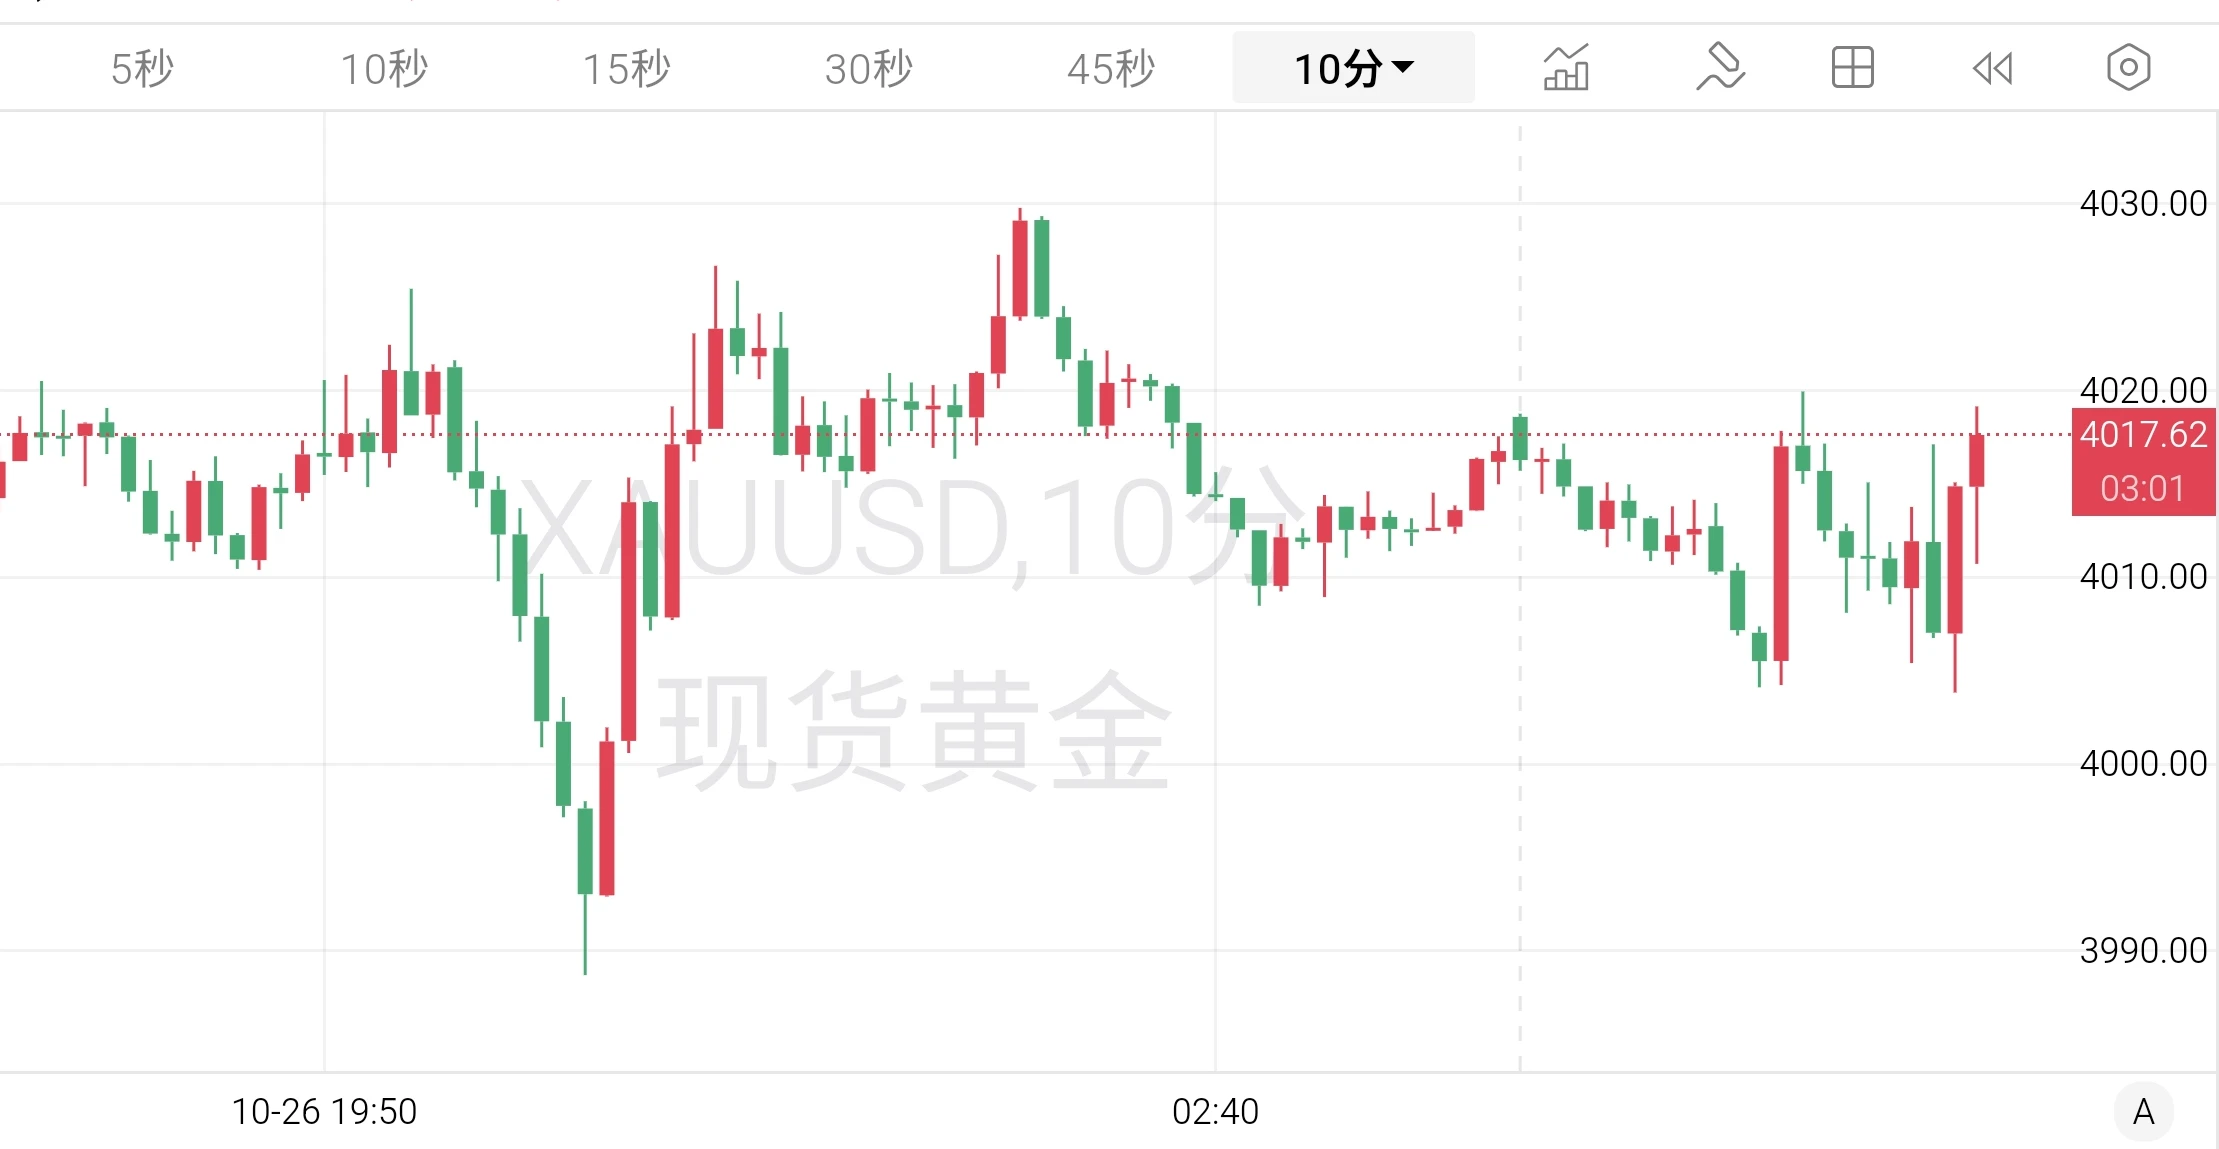
10.27 Gold Technical Analysis
Gold’s daily candlestick chart shows a small bullish candle as a transitional correction, with limited contraction in range. It is moving sideways below the broken low of 4060, while the daily moving averages are bearishly aligned and exerting pressure. There is still room for further short-term downside, and the market is currently building momentum. After yesterday’s consolidation, further declines are expected today. The short-term strategy remains to favor selling rallies.
The 4-hour chart is moving within a descending channel. Yesterday’s rebound from the low
post-image
XAU+0.38%
I thought $BMT was about to make a real breakout, but those moving averages keep knocking it back down. Take profit: 0.02740 Stop loss: 0.03020 Other coins: $DOOD : Current price 0.002301 - 24-hour change: +63.42%$SOL : Current price 100.53 - 24-hour change: -0.82%
post-image
BMT+5.93%
DOOD+29.29%
SOL-0.77%
If you’re trading futures this week, I’d advise taking a break first😂Longs and shorts have been swept four times in three days; this market is brutal.
Spot is a different story—you can accumulate slowly. ETF outflows are happening faster than I expected, which has actually created a window to pick up coins.
The macro picture is a mess: inflation is picking up, the Fed is turning hawkish, and the midterm elections are looming… Funds are broadly pulling back and waiting on the sidelines. Last week, only $BTC and $XRP still saw net ETF inflows, while BTC was practically being propped up single
post-image
BTC-0.67%
XRP-1.15%
SOL-0.77%
10.27 Bitcoin Morning Outlook (Public Version)
Long Position Strategy$BTC
  Entry range: around 790-796
  Stop-loss: 788 (if the price breaks below this level, exit; if a bearish trend forms, execute planB⬇️)
Take-profit tiers
  First target: 808
  Range target: 812
Trend target: around 820
Long-term target: above 828
Trading factors: The Bollinger Bands are slightly downward overall, indicating narrow-range consolidation after the decline. MACD remains below the 0 axis. In terms of market depth, large buy orders exceed sell orders, and retail traders chasing long posi
post-image
BTC-0.65%
ETH-1.23%
ZEC+1.29%
Join Gate's Creator Program and win!!!
Post regularly (good content) and you may get selected
for full details see below
Ends October 31
Register Now:https://www.gate.com/campaigns/6692
Campaign Details:
#Gate广场万圣节 #BitcoinFallsBelow80K
Bitcoin at $80,036, Falling Highs, a Cost-Basis Test and a Macro Week That Decides the Next Move
Bitcoin is trading at about $80,036, just above the $80,000 line, after a session range of $79,338 to $80,673. That is a 1.7% swing around the level the whole market is watching. The $80,000 mark is more than a round number. After BTC slipped below it and printed $79,338 today, the market is testing whether buyers can defend this zone or whether another wave of selling pushes price toward lower support. The real question is not whether Bitcoin can touch $80,000, bu
Falcon_Official
#Gate广场万圣节 #BitcoinFallsBelow80K
Bitcoin is back under $80,000, trading near $79,673 after its weakest level since September 18. Round numbers attract headlines, so I looked at the structure underneath it. The chart reads like a small building: a floor that has been tested, a ceiling that keeps rejecting price, and a trapdoor a few percent below.
$80,000 and the cost-basis band
Bitcoin had closed above $80,000 every day since September 18, so the break carries more weight than a round number. The level is also where several groups bought. Glassnode estimates the average price paid by companies holding Bitcoin on their balance sheets at about $80,000, which puts the average corporate treasury position at a loss below it. Glassnode also described a cost-basis band between $80,000 and $81,500. By my math, $79,673 sits about 0.4% below $80,000 and about 2.2% below the top of that band.
The floor has been tested before. The same $79,800 to $80,000 zone stopped the decline on October 15, which makes Saturday the second test in ten days. Today is arguably a third look at the same area, and each test tends to weaken a floor.
The ceiling: $82,000 to $83,350
Overhead, several levels stack up. Bitcoin was rejected near $85,000 on October 21 and has dropped back under its 200-period exponential moving average on the 4-hour chart, now at $82,024. The 50-day average sits at $81,798 and the 20-day at $82,539, which means many recent buyers are underwater and short-term sellers have the advantage. Traders also pointed to resistance between $82,400 and $83,350. From $79,673, $82,024 is about 2.9% higher and $82,539 about 3.6% higher.
The structure is a descending staircase. Bitcoin has made lower highs since its $87,197 peak on October 2, with the $84,840 rejection extending that sequence, and it closed below its 50-day average for the first time since August. By my math, price is about 8.6% below the October 2 peak. Add the lows: $79,842 on October 15, then $79,146 on October 24, a lower low. Lower highs plus lower lows is the textbook definition of a downtrend.
The trapdoor: $77,500 to $78,400
If $80,000 gives way, the chart offers a few catch points. Glassnode's True Market Mean places the next major support at $77,600, roughly 3% below, and BeInCrypto flagged $77,876 as the next downside level, with a support zone between about $76,700 and $72,500 below that. Another reading puts support near $78,422. By my math, $78,400 is 1.6% below, $77,600 is 2.6% below and $75,000 is 5.9% below. Mid-September's consolidation near $78,000 before the run to $87,000 adds weight to that area.
Momentum
The 4-hour RSI sits at 33.21, showing that sellers have controlled most candles since Wednesday without yet reaching the near-30 readings that preceded the October 9 rebound to $84,000. A daily RSI near 43 points to weak but not extreme momentum. In plain words, the drop has room to run before it looks stretched.
Why it fell when yields did not
This is the useful puzzle. The 10-year Treasury yield fell to 4.96% on October 22 from 5.31% earlier in the month, and lower yields usually support Bitcoin. So rates are not the main driver this time. The drivers were flows, leverage and geopolitics. Spot Bitcoin ETFs lost about $773 million on Thursday and Friday after taking in more than $1 billion earlier in the week, more than $200 million of positions were liquidated in a single hour on Saturday, with $191.33 million of them longs, and more than $810 million was liquidated across 24 hours, including about $689 million in longs. Oil adds another layer, with Brent near $115 after a 6% weekly gain.
Distance from the highs
Bitcoin is about 36.8% below its all-time high of $126,080 by my arithmetic, which keeps the long-term picture a recovery story and not a new-high story.
The Fed meets October 27 and 28, and U.S. midterm elections follow on November 3. The decision is widely expected to be a hold, so tone matters more than the rate.
Risk and reward
A long from $79,673 with a stop under $78,400 risks about 1.6%. A target at $82,024 offers about 2.9%, a ratio near 1.8 to 1, while $84,840 offers about 6.5%, a ratio near 4 to 1. The second ratio only pays if the floor holds on a closing basis and the ceiling breaks.
Three scenarios
Floor holds: BTC closes back above $80,200 and $81,500, then challenges $82,024 to $82,539.
Range: price chops between $78,400 and $81,500 while the Fed and earnings dominate.
Trapdoor: a daily close below $79,000 opens $78,400, then $77,600 to $77,876, and a break there points toward $75,000.
ETF flows each morning, liquidation spikes near round numbers, the 4-hour 200 EMA near $82,024 and whether corporate-treasury selling appears. A reclaim of the 50-day average would be the first real sign of repair.
I would keep leverage low into the Fed decision, treat a daily close under $79,000 as the line that opens the trapdoor, and wait for a close above $82,539 before calling the downtrend over.
A floor that has been tested three times is not a wall, it is a negotiation. Sooner or later the buyers or the sellers stop showing up, and the useful habit is to decide in advance which one you will believe. #WCTCS9
repost-content-media
BTC-0.67%
$SKHYNIX It rose from 886 to 1029, but I’m actually not looking to chase longs.
It’s not that I think it’s about to drop. There’s just one data point in this rally that really concerns me:
The price rose nearly $150, yet funds saw a net outflow of $186 million over 15 days.
That’s a bit contradictory.
If this were driven by genuine new capital, funds should ideally be flowing back in as the price keeps making new highs. Instead, we’re seeing a divergence: “strong price, weak flows.”
So I won’t bet on it continuing higher near 1029.
1044.92 is the previous high. I’ll only consider chasing if i
post-image
SKHYNIX+1.41%
  • 4
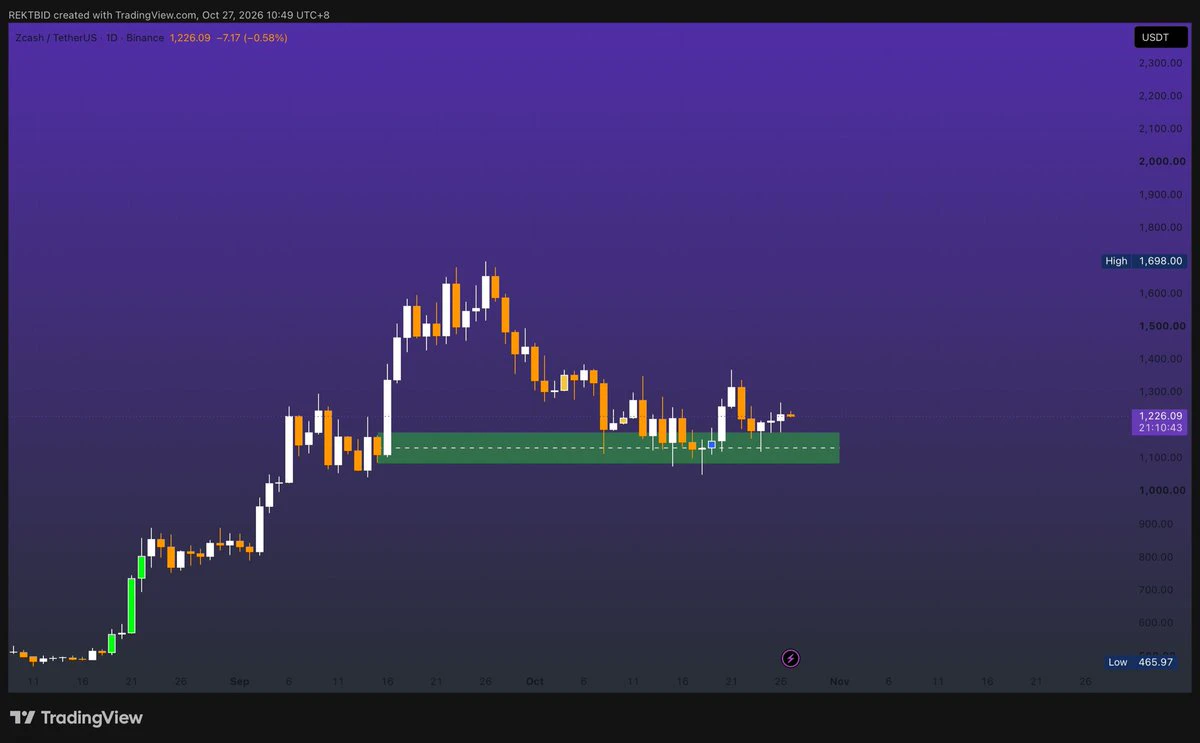
The only support for $ZEC
post-image
ZEC+1.16%
The AI giants are about to deliver again! Microsoft, Google, Amazon: Who's minting money, and who's burning it?
In the third-quarter earnings season for US stocks, the real main event isn't whose PowerPoint looks prettiest, but whether AI can actually make money.
Microsoft, Google, Amazon, and other tech giants are about to report results, and the market's attention is once again fixed on their AI businesses. Over the past two years, any company with even a little connection to artificial intelligence seemed to get an automatic boost to its valuation. The problem is that GPUs cost money, data
MU+2.97%
  • 12
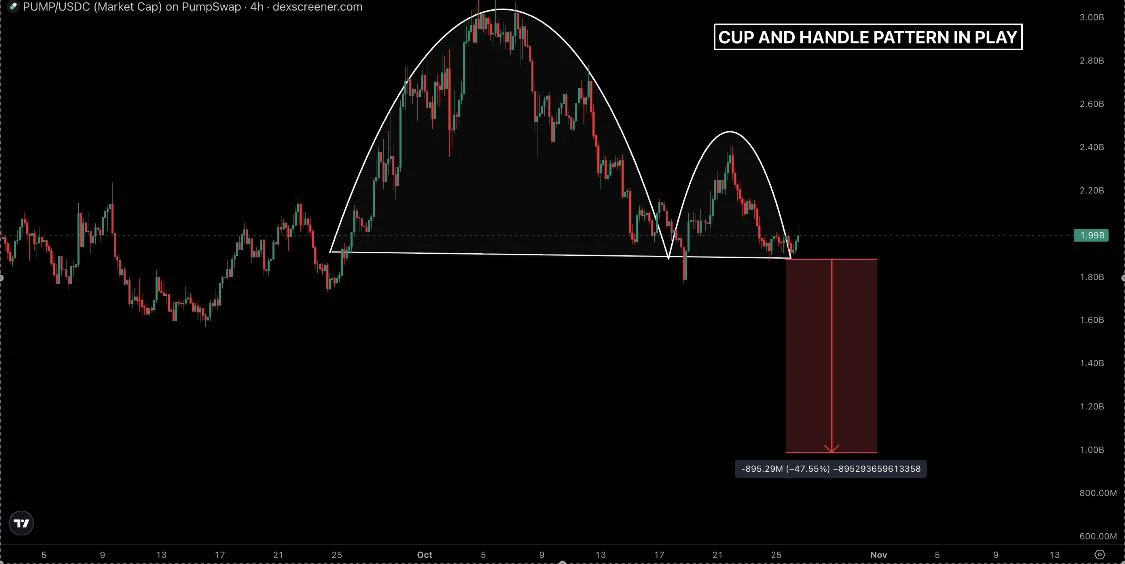
PUMP.FUN went from a 3B market cap to drawing a whole exit liquidity tutorial on the chart
Cup and handle or just another trap for the trenches?
$PUMP holders better pray this one breaks up, not down
post-image
PUMP-1.06%
Load More

Join 40 M users in our growing community

⚡️ Join 40 M users in the crypto craze discussion

💬 Engage with your favorite top creators

👍 See what interests you

Trending Topics

USEarningsSeason

155.28k Views2.36k Discussing

The U.S. Q3 earnings season is in full swing, with major tech companies including Tesla and Meta reporting results. Market focus is shifting beyond revenue and profit toward AI spending, capital expenditure, margins and forward guidance. Which company’s earnings are you watching most closely?

KeyMacroWeekAhead

7.24k Views969 Discussing

BTCBattlesFor80000

117.13k Views25.15k Discussing

View More