Square
Following
Hot
News
Profile
Share your thoughts
placeholder
Article
$DNA Listings Bring Attention. Demand Must Prove Itself.
NeoSoul’s exchange listings are driving visibility, but lasting momentum depends on sustained buying pressure.
With $70.53M in 24H volume against $1.95M in liquidity, volatility and profit-taking remain important risks.
Watch $0.255 support and $0.261–$0.263 resistance. A breakout needs sustained volume and a confirmed hold above resistance.
Is $DNA building sustainable demand, or is listing hype driving the rally?
#DNA #NeoSoul #CryptoAnalysis
post-image
DNA-3.59%
So this is the legendary setup: AI comes up with the strategy, writes the code, helps get it running, gives you the backtest, and says it can make money...
Damn, it's the whole package...
post-image
Trenches
AGT
A
bade
b
AGT
0x5d...e274
Market Cap
$.
Change
.
24h Vol
$.
Holders
.
CNPY
C
bade
b
CNPY
0xc6...ddd2
Market Cap
$.
Change
.
24h Vol
$.
Holders
.
FOLIO
F
bade
b
FOLIO
0x5f...e411
Market Cap
$.
Change
.
24h Vol
$.
Holders
.
Q
Q
bade
b
Q
0xc0...0589
Market Cap
$.
Change
.
24h Vol
$.
Holders
.
FTR
F
bade
b
FTR
DFMt...pump
Market Cap
$.
Change
.
24h Vol
$.
Holders
.
$SOL Bulls, is $108 the next target?
SOL is currently trading near $103.96, making a slight recovery after bouncing from the $102.50–$103.00 support zone. Buyers are trying to regain momentum on the 1-hour chart, with $105.28 as the next key resistance! Long strategy entry: $103.00–$104.00 TP1: $105.30 | TP2: $106.50 | TP3: $108.00 Stop-loss: $102.20
post-image
SOL+0.66%
giant humanoids are coming
this is the Neo1 from NeodraDynamics, built for dangerous jobs like nuclear facility maintenance and deep-sea operations
→ 4 meters tall and weighs 1.2 tons
→ can carry 500 kilos
→ operates in temperatures from −50°C to 250°C and depths of up to 10,000 meters
Neo1 could also support with disaster zone cleanup, heavy industry and mining, and emergency rescue
ngl, if I was in trouble and saw Neo1, I wouldn't think it was there to help me 🤣
$TIA suffered a major setback, but some interesting moves are emerging around $0.65. Sellers pushed the price sharply lower, but buyers are starting to defend this support level.
I plan to go long $TIA here, expecting the price to rebound to around $0.713. The recent bounce looks promising, but I’d like to see buyers hold above $0.664 before momentum picks up. Entry: $0.664–$0.668 Target: $0.680 / $0.700 / $0.713 Stop-loss: $0.6416
After a major sell-off, this is still a high-risk bounce trade. If $0.6478 gives way, the bullish setup will weaken significantly. Can $TIA reclaim $0.71, or wil
post-image
TIA-0.25%
$ATOM Bulls are fighting back: Cosmos is attempting a recovery after bouncing from the $1.68–$1.69 support zone. Buyers are starting to enter, and if bullish momentum continues, the price could rise further to $1.74–$1.776. Long trade plan: Entry: $1.701–$1.708 Take-profit 1: $1.725 Take-profit 2: $1.750 Take-profit 3: $1.776 Stop-loss: $1.674 The 1-hour chart still needs to confirm whether the reversal can hold. Watch the area around $1.72 closely and manage risk. Buy and trade $WAL
post-image
ATOM-0.63%
WAL-6.88%
Aptos processed 273.41M transactions in the past 30 days, 4.87x Ethereum's 56.17M. It also topped Coinbase's Base network, which handled 261.84M over the same period.
@Aptos
APT-3.10%
ETH+0.43%
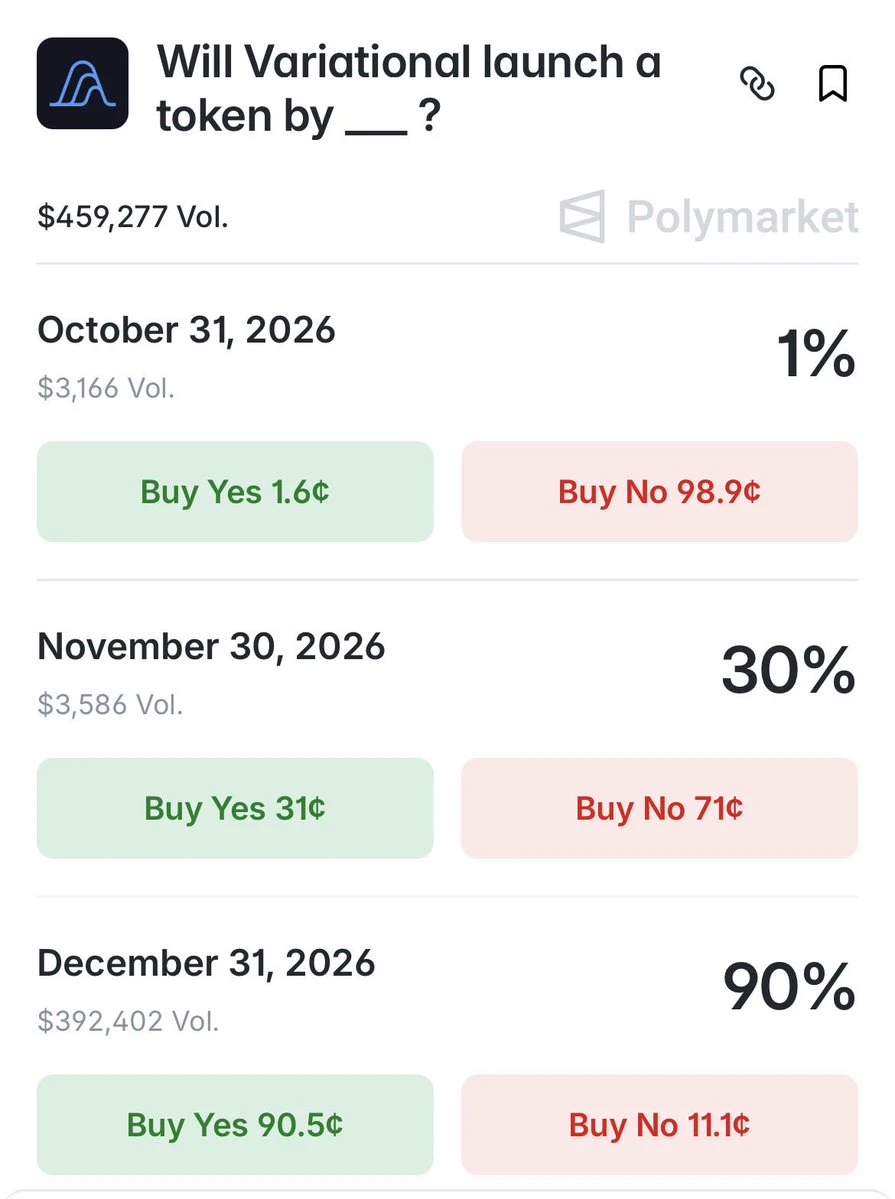
Not sure how people got to the conclusion that rising odds on this polymarket bet equals TGE in December
Leaving aside the fact that there is only $500k traded so far, the rising odds are just an indicator that the vast majority of people is convinced that TGE will be executed by the end of the year
It clearly states in the rules “by” and not “in”
My bet is late November, I’m actually considering the 30% odds might be worth a go
post-image
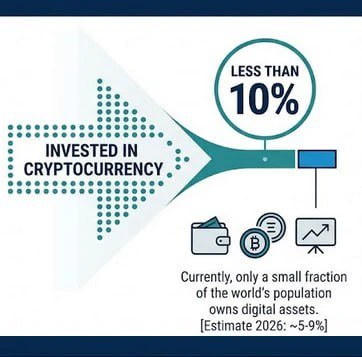
FUN FACT: Less than 10% of the global population is invested in cryptocurrency.
post-image
Layout: Bitcoin, Ethereum, Dogecoin
live-cover
LIVE880
  • 4
Why hasn't my buy order been filled at the price I posted
Can any expert shed some light on this
Guy's $ICNT
bullish target is $0.2400, with further upside expected after a strong breakout. Trading strategy: Long entry range: $0.2200–$0.2240 Target 1: $0.2300 Target 2: $0.2400 Target 3: $0.2550 Stop-loss: $0.2120 After breaking through the $0.2000 resistance zone, ICNT has shown strong bullish momentum. If buyers can maintain support near $0.2200, the price may move toward the next resistance level. A break below support could trigger a short-term pullback. $BTWGTC
post-image
ICNT+27.21%
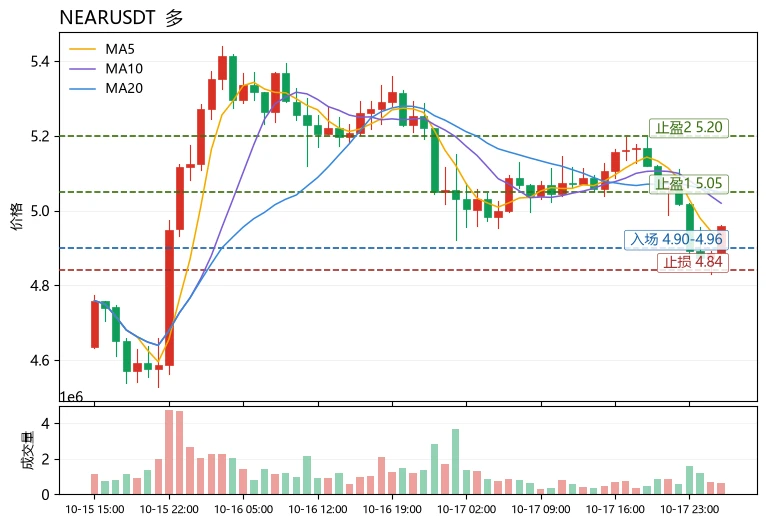
$NEAR Short-term outlook: Bullish, but this is a weak rebound rather than a trend reversal; the key is to use the moving-average structure to judge whether the trend is healthy. MA5=4.9252 is still below MA20=5.0484, the bearish moving-average alignment remains intact, RSI=41.7 is in the neutral-to-weak range, and the MACD histogram=-0.01993 remains negative, indicating that mid-term momentum has not turned bullish yet. A reusable approach is to first determine direction from the moving-average alignment, then assess the risk-reward ratio based on the price’s position relative to the Bollinge
post-image
NEAR-0.69%
ALT+12.48%
WLD+0.09%
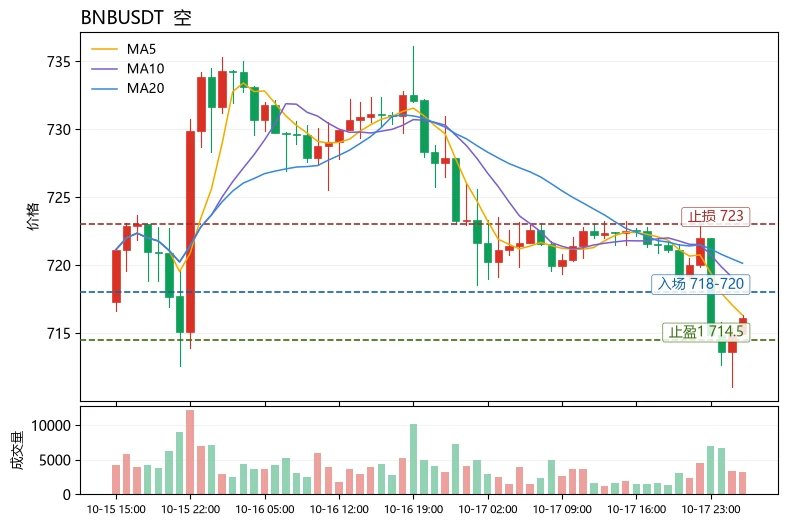
Many people treat “low volatility” as a sign of safety, when the opposite is true—low volatility often means positions are quietly building up, and if the market picks the wrong direction, there is even less room for error. $BNB is currently in this state: the current price is 716.92, MA5=715.19 is below MA20=719.882, RSI is just 39.7, the MACD histogram remains bearish at -0.3469, the Bollinger Bands have narrowed to [714.063, 725.702], the amplitude across 30 candles is about 2.79%, and the funding rate is 0.0000%, indicating neither longs nor shorts are willing to pay. The Fear and Greed I
BNB-0.37%
PUMP+3.08%
The Fear & Greed Index remains in the greed zone at 55, but $BNB is currently at 716.14, down slightly by 0.54% over 24h. MA5=716.316 has crossed below MA20=720.143, RSI is only 36.9 and nearing the weak zone, the MACD histogram remains bearish at -0.4738, and the price is near the lower Bollinger Band at 714.526. The funding rate of 0.0000% indicates that long leverage has been largely cleared out. With overall market sentiment warm while leading coins weaken, this is a typical high-level sector rotation—capital is flowing out of major assets and into high-volatility catch-up plays like $EPIC
post-image
HYPE+0.16%
$ZEREBRO Down 23.53% in a day, from 0.0361 straight to 0.0270—this isn’t a pullback; it’s a guillotine. 24h trading volume hit 59.2M on the sell-off, signaling panic-driven exits. But note: the price is already near the 24h low of 0.0270, and short-term oversold divergence signals are starting to emerge. Technically, 0.0270 is the last line of defense; a break below points to 0.0240. Only if it holds here and volume contracts does it qualify for a weak rebound. Trading plan: don’t short at the current price. Wait for 0.0270–0.0275 to test a small long position, with a firm stop at 0.0265. Firs
ZEREBRO-20.70%
$SUI shows signs of a potential bullish rebound
After an extended downtrend, buyers are trying to regain control near the bottom. If momentum continues and key resistance levels are broken, SUI may begin a stronger recovery. My upside targets: TP1: $1.04TP2: $1.09TP3: $1.15Stop-loss: 0.90
The first major test is to reclaim $1.00 and hold above it. If it breaks through successfully, the price could move toward $1.20, ultimately reaching $1.50. Before expecting a bigger move, I’ll first watch for confirmation. $SUI
post-image
SUI-2.23%
BTC MARKET UPDATES
live-cover
LIVE1,407
$BTC How are liquidations looking now? Where will things go next? The liquidation chart suggests that all downside liquidation pressure has been absorbed. Therefore, the uptrend may continue. All liquidation pressure is currently concentrated above the spot price, so I expect the price to move up first. Breaking $85k would be a perfectly normal move. In addition, as upward momentum strengthens, liquidation pressure will increase further and propel the market higher through a snowball effect. I believe the direction is up! Do your own research (DYOR)!
post-image
BTC+0.08%
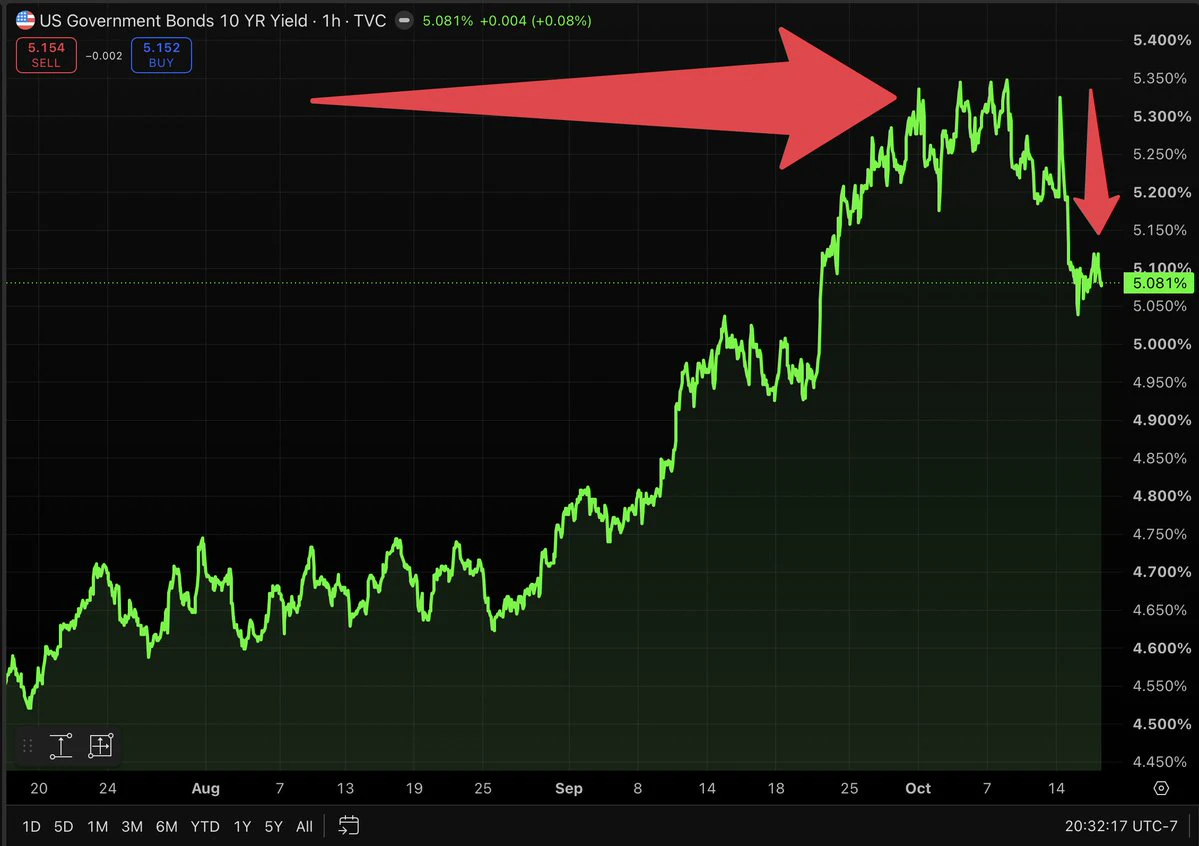
Retail investor: Make it make sense. Inflation came in HOT & bond yields went DOWN??
Me: Yep. 10 year went from about 5.35% to 5.08% in like 24 hours
Retail investor: but hot inflation should mean higher rates
Me: That’s the logic. The market doesn’t always follow logic in the short run
Retail investor: so why’d it happen
Me: People got scared of stocks & ran to bonds. When everybody buys bonds, bond prices go up... & when bond prices go up, yields go down. They move opposite
Retail investor: so it’s just fear
Me: Mostly. Money rotating out of stocks into “safety”
Retail investor: is that bad?
post-image
Load More

Join 40 M users in our growing community

⚡️ Join 40 M users in the crypto craze discussion

💬 Engage with your favorite top creators

👍 See what interests you

Trending Topics

USSeptemberPPIBeatsExpectations

91.35k Views1.93k Discussing

US September PPI came in at 6.3% YoY, well above the 5.3% market expectation, pointing to renewed producer-side inflation pressure. Weekly jobless claims were 199K, broadly in line with forecasts. Could hotter inflation further reduce room for rate cuts, and what does it mean for $BTC, US stocks, and gold?

GateWCTCS9GlobalTradingCompetition

37.87k Views6.67k Discussing

GateBTCAndETHFuturesVolumeRanksTop3

53.8k Views1.81k Discussing

View More