Square
Following
Hot
News
Notifications
Profile
Share your thoughts
placeholder
Article
What Is the Long-Short Ratio? Why Can Prices Still Rise When Shorts Seem to Have the Upper Hand?

In the cryptocurrency market, many traders pay attention to the long-short ratio. When data shows a higher proportion of shorts, some believe prices should continue to fall; when the proportion of longs is higher, others think an uptrend is more likely to continue.

But markets do not simply decide prices by taking a vote. The long-short ratio reflects the distribution of positions or accounts under a particular methodology, not a direct answer about future prices.

First, what exactly is the long
post-image
MARKET UPDATES ABOUT EVERY COIN....
live-cover
LIVE1,976
Trenches
mihao
m
bade
b
mihao
4Cxj...pump
Market Cap
$.
Change
.
24h Vol
$.
Holders
.
AGT
A
bade
b
AGT
0x5d...e274
Market Cap
$.
Change
.
24h Vol
$.
Holders
.
FOOD
F
bade
b
FOOD
FTu5...pump
Market Cap
$.
Change
.
24h Vol
$.
Holders
.
IDOL
I
bade
b
IDOL
0x3b...ab07
Market Cap
$.
Change
.
24h Vol
$.
Holders
.
AI
A
bade
b
AI
2T56...pump
Market Cap
$.
Change
.
24h Vol
$.
Holders
.
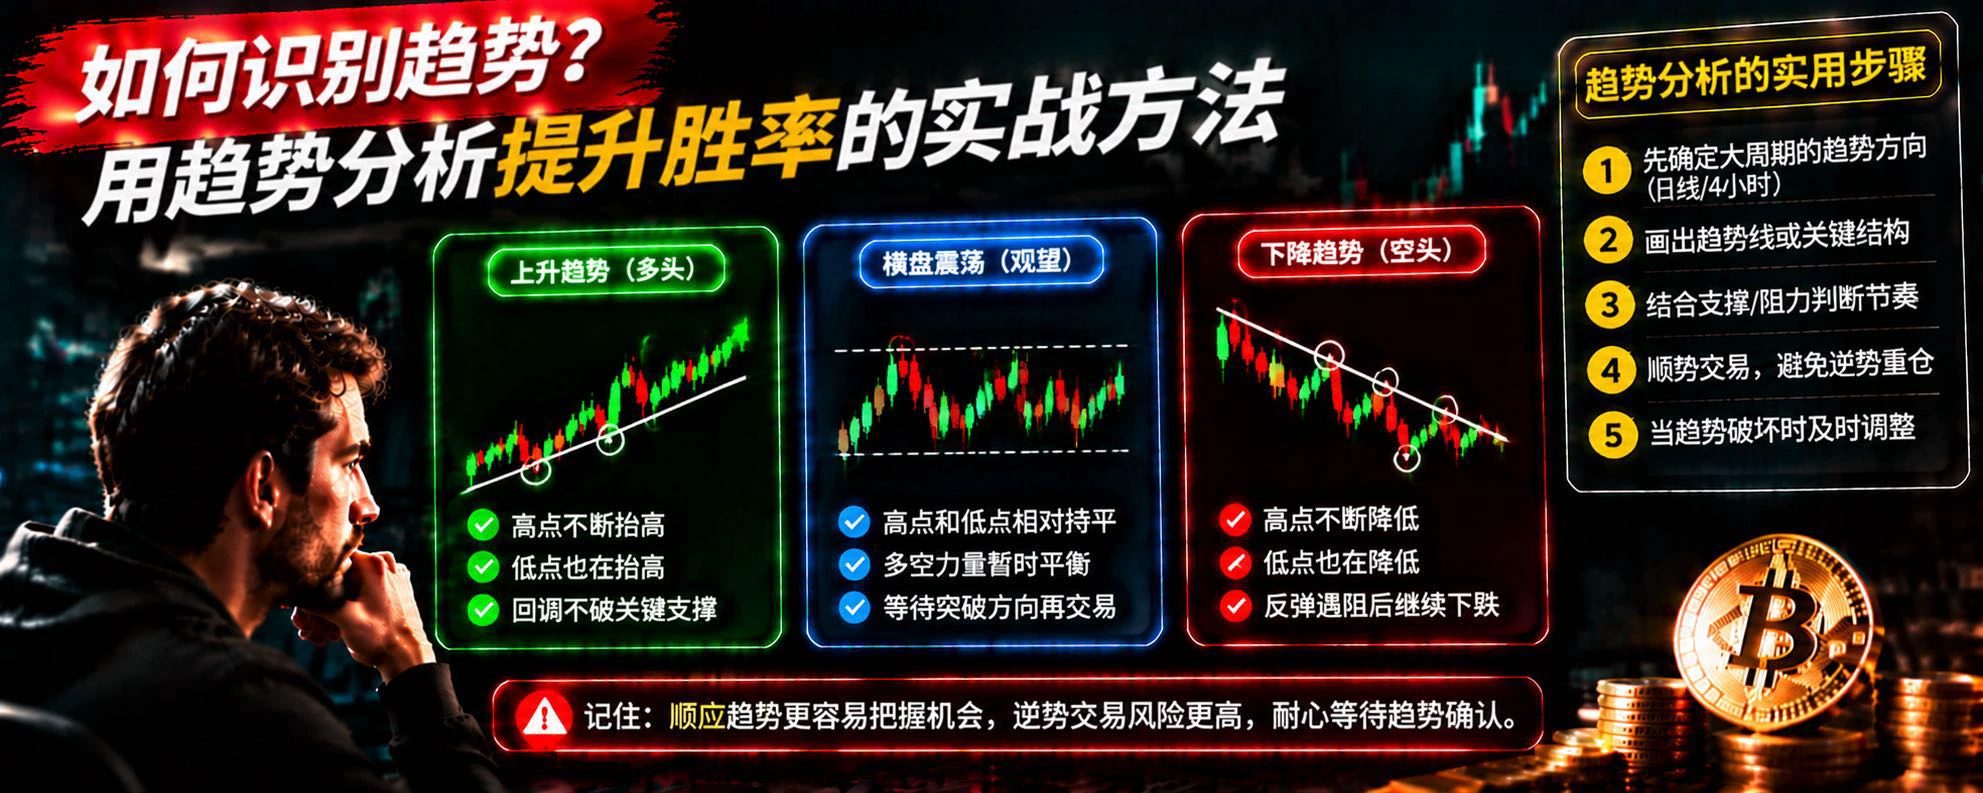
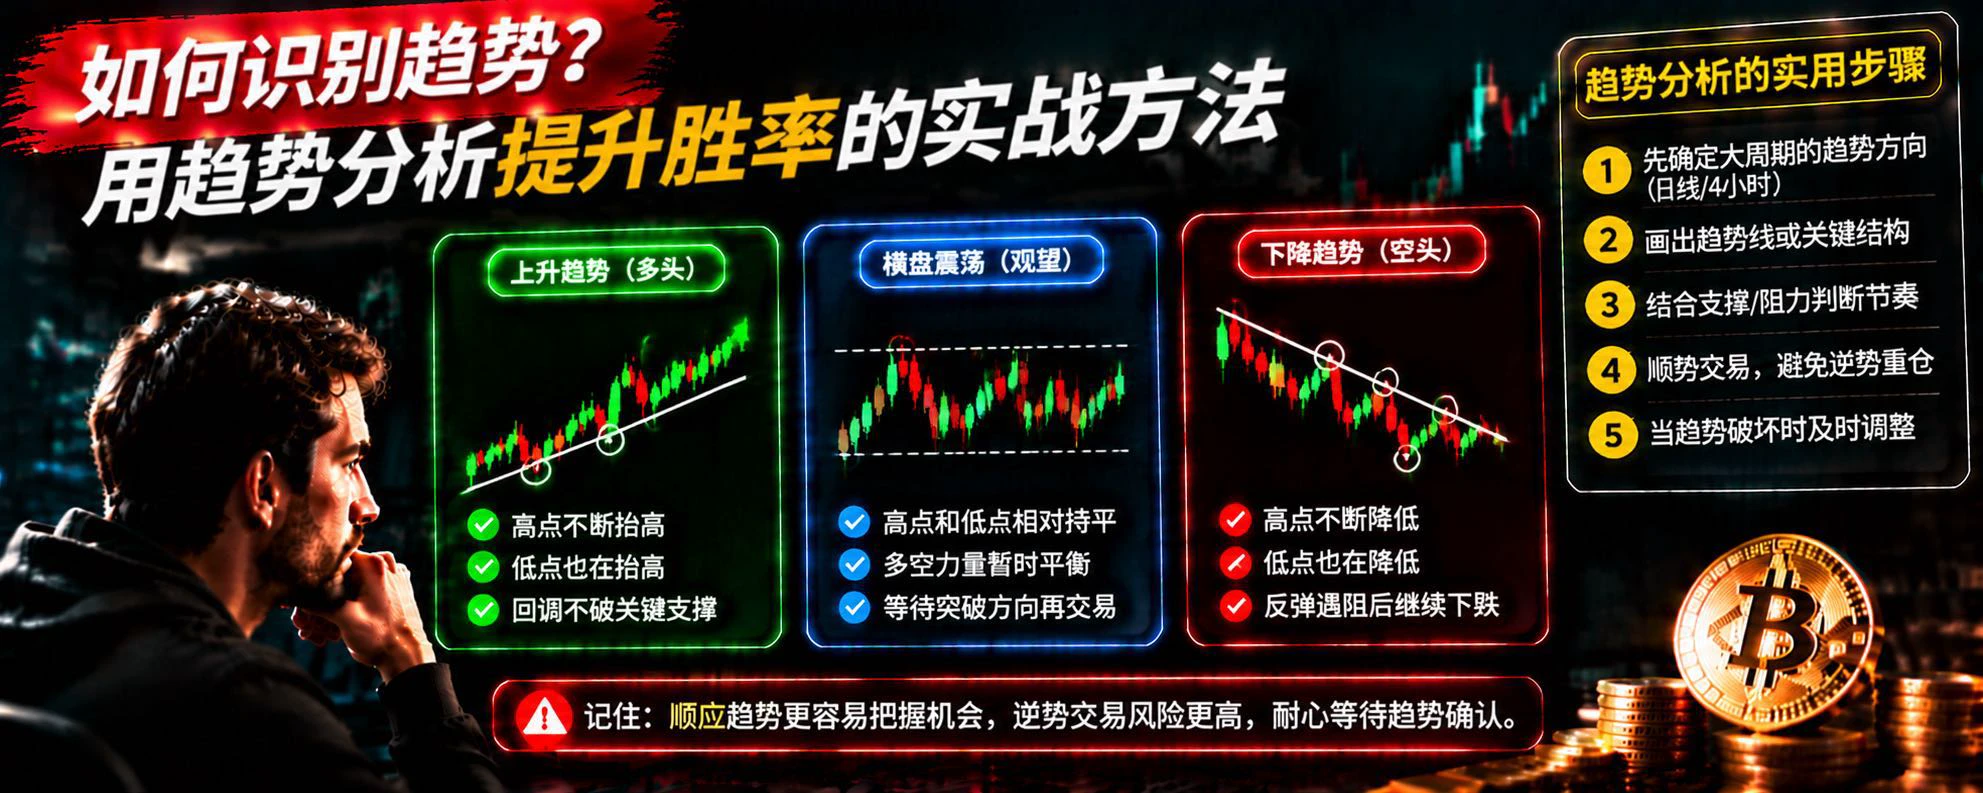
How to Identify Market Trends? Improve Your BTC Trading Win Rate with Trend Analysis

In cryptocurrency trading, many people search every day for the best entry and exit points, but overlook a more fundamental question: What trend is the market in right now?

If you haven't clearly identified the market's direction, even using a lot of technical indicators may still lead to repeated bad decisions.

First, learn to identify the three basic market states.

First, an uptrend. Prices continue to form higher highs and higher lows, indicating that buyers have the upper hand. In this situation, focus
post-image
BTC-0.67%
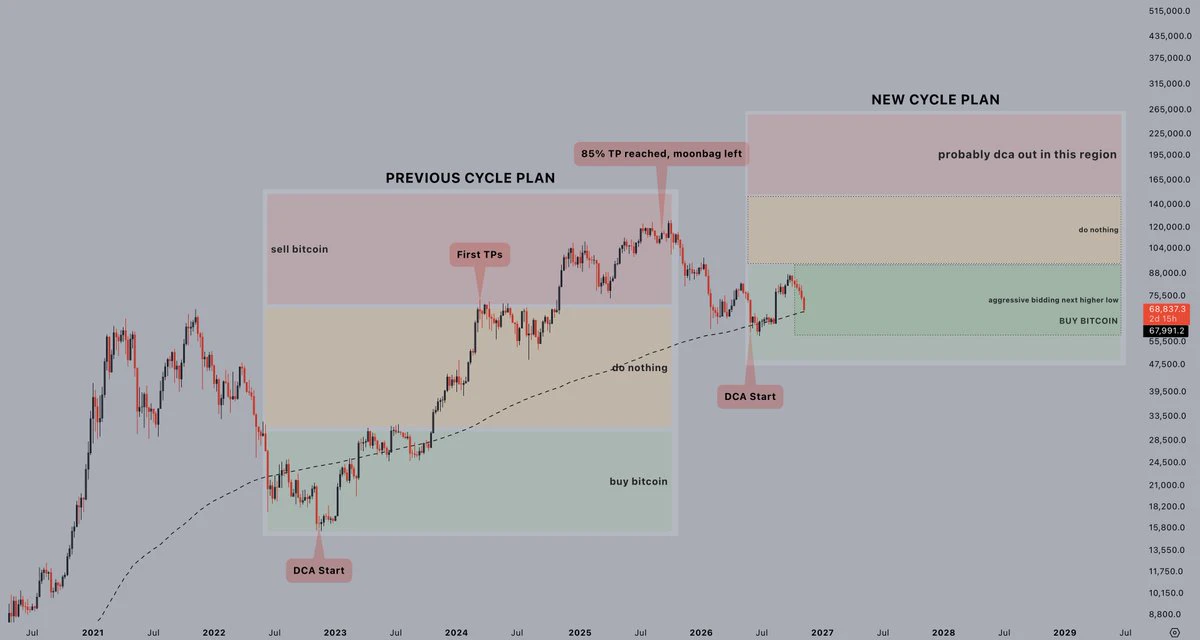
I planned for this scenario.
Doesn't mean I'm not uncomfortable - but the plan allows me to stay level headed, even when it gets hard.
Time to pay attention.
$BTC
post-image
BTC-0.67%
What Is the Funding Rate? Why Can Holding Perpetual Contracts Also Incur Ongoing Additional Costs?

In the cryptocurrency market, some traders get the direction right but find that their final returns are lower than expected. Besides fees and slippage, there is another easily overlooked factor: the funding rate.

The funding rate is a mechanism in perpetual contract markets that helps keep contract prices linked to spot market prices. It can affect holding costs and whether traders are willing to hold a position in a particular direction over the long term.

First, what exactly is the funding
post-image
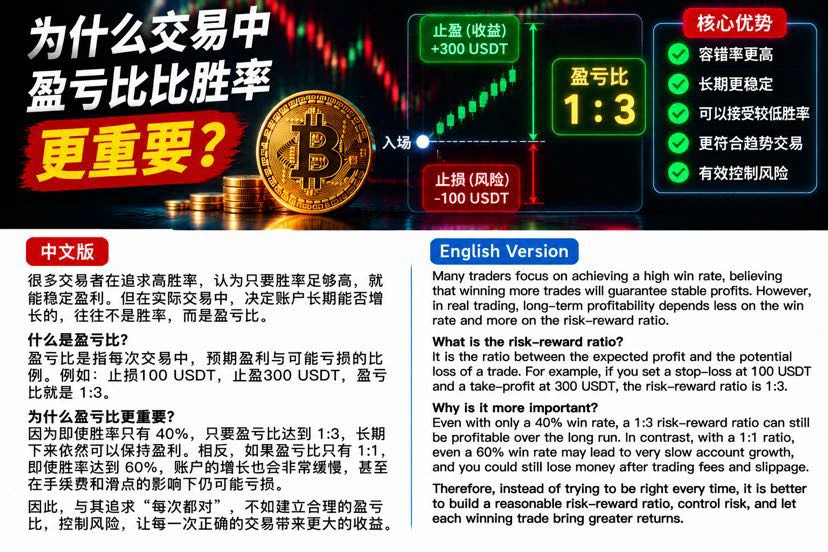
Many traders are especially concerned about their win rate after entering the market. They hope to win 7 or 8 out of every 10 trades, and even believe that only a high win rate can deliver consistent profits.

But in reality, what determines whether an account can grow over the long term is often not just the win rate, but also a frequently overlooked metric: the risk-reward ratio.

What is the risk-reward ratio?

Simply put, the risk-reward ratio is the proportion between the expected profit and potential loss on a trade.

For example, if a trade has a stop-loss of 100 USDT and a take-profit
post-image
Why Can the Order Book Look Deep, Yet Liquidity Suddenly Disappear When You Place an Order?

In crypto markets, you may sometimes see a large number of buy orders stacked in the order book and assume there is strong support below. But when prices start falling rapidly, those buy orders can quickly dwindle, and a market that looked stable can suddenly become fragile.

Why does this happen?

First, orders can be canceled at any time.

The order book shows currently visible limit orders, not completed trades. Traders can modify or cancel orders as market conditions change. So large orders only in
post-image
📊 Crypto Daily | Evening of Nov 13: $70,000 support lost! Iran strikes US military facilities, 180,000 liquidated, $1.631 billion wiped out—the Fear and Greed Index falls to 20

Guys, it was hovering around 71,000 this morning, then plunged below $70,000 tonight: $BTC fell as much as 5.4% intraday, bottoming near 67,585, and has now recovered to around 69,400, down nearly 3% on the day. This wasn't a technical pullback—the news directly sent prices tumbling: Iran struck US military facilities in the Middle East, stoking safe-haven sentiment and sending risk assets across the board lower; on t
post-image
BTC-0.67%
NVDA-4.49%
IBIT+0.00%
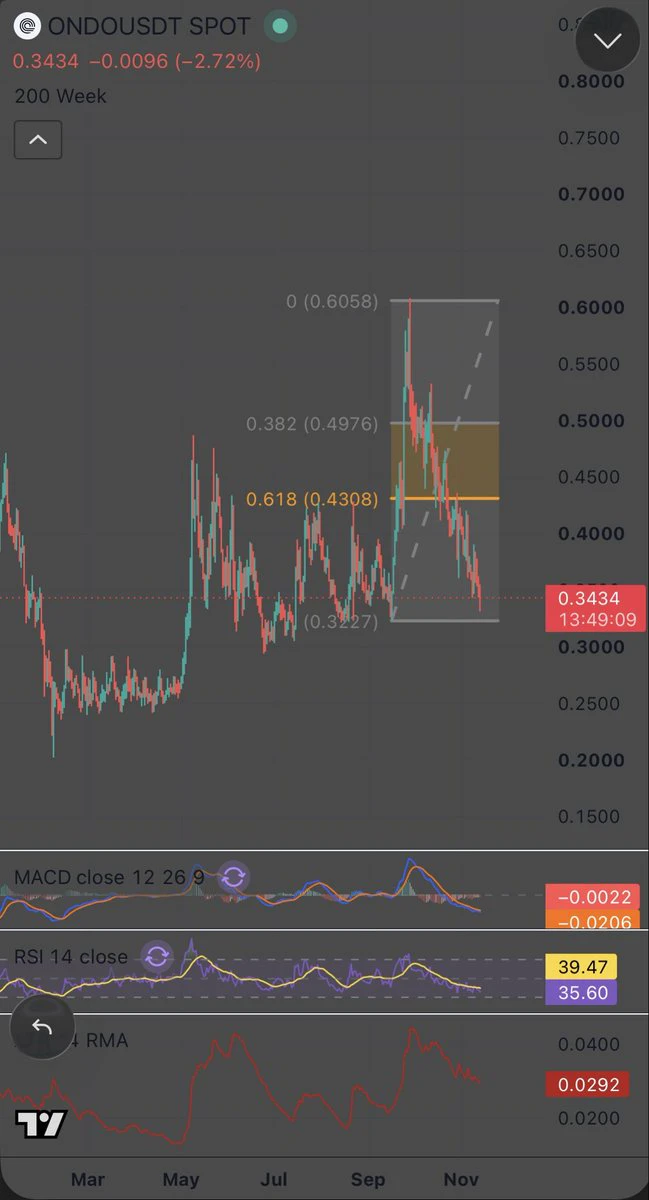
You bought $ONDO on the September breakout.
Two months later, it has handed back almost the entire move.
The rally ran from $0.3227 to $0.6058.
Today it trades at $0.3434.
That is roughly 93% of the move retraced, and most holders now think the chart is broken.
It is not broken yet. It is sitting on the one level that decides it.
Here is the daily map.
The level to defend:
$0.3227
That is the September low and the full retracement. It sits right on the $0.30 to $0.43 range ONDO chopped inside from June to September.
The level to reclaim:
$0.4308
That is the 0.618 fib, and it lines up with the
post-image
ONDO-0.29%
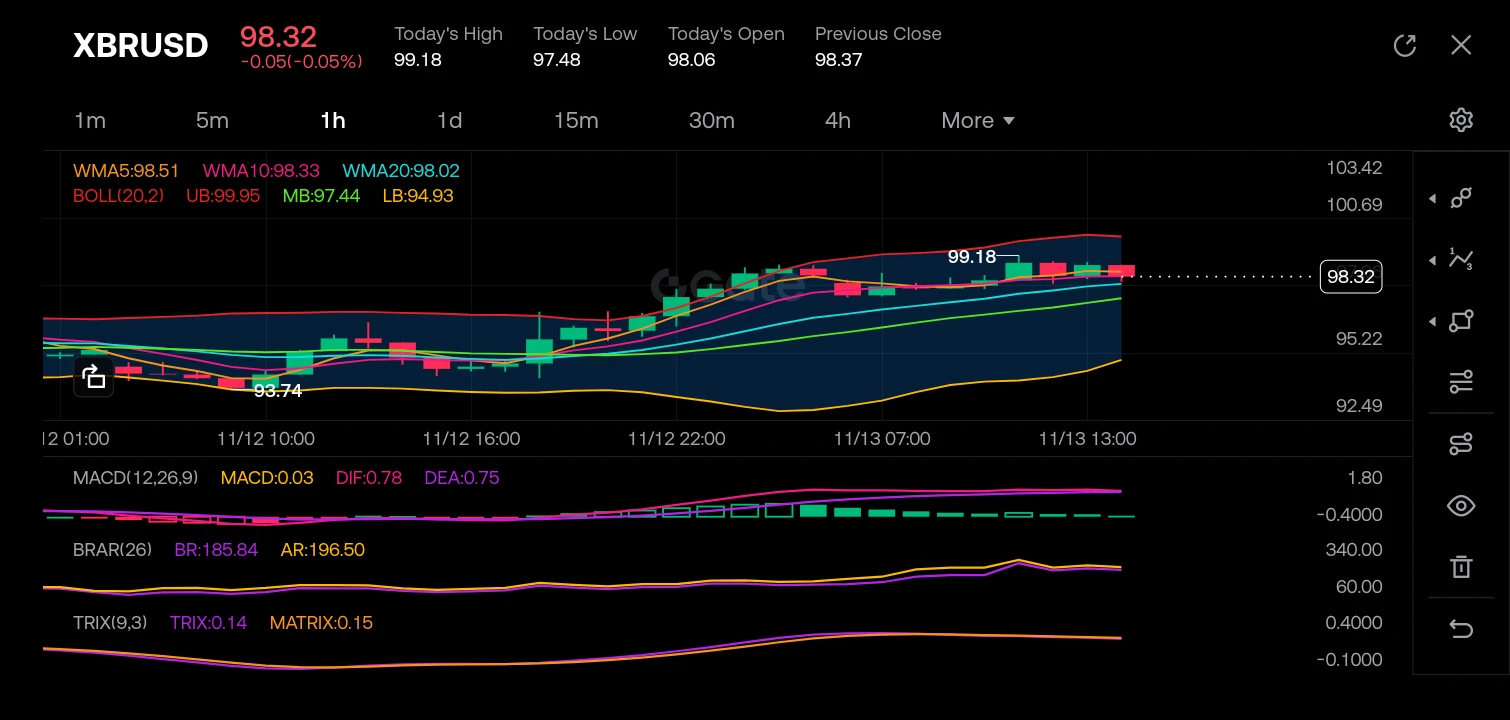
$XBRUSD
Looking at the XBRUSD (Brent Crude) 1-hour chart, the market structure has clearly shifted from a bearish downtrend to a bullish reversal structure. Price successfully bottomed out at 93.74 and has since established a series of higher highs and higher lows. The K-line analysis shows strong bullish momentum, with the price action currently riding above the WMA5 (98.51), WMA10 (98.33), and WMA20 (98.02), while the Bollinger Bands have expanded upward, confirming the volatility and trend direction. The MACD is well into positive territory (DIF 0.78, DEA 0.75), though the histogram is fla
post-image
XBRUSD+0.00%
  • 1
  • 2
Tonight, first watch how far ETH can rebound.

Based on Gate futures market data at 18:40 on November 13, ETH rebounded from around 1895 to around 1950, showing some short-term recovery, while major resistance remains overhead.

Focus on 1963–1966 above. If the rebound struggles to hold above this range, watch for a potential pullback, with 1940 and around 1930 as the first downside levels. If ETH stabilizes on a retest of 1939–1941, it may continue its short-term rebound; if 1927 breaks, be prepared for another test of 1916–1895.

First watch how price reacts at key levels, and consider enter
post-image
ETH-1.23%
Forever isn’t long enough with you 📷
post-image
CRYPTO MARKET UPDATES
live-cover
LIVE1,884
$SOPH The bullish signal has been triggered. Enter a long position decisively at the current price of $0.001705. The token distribution at this price level looks favorable, and short-term momentum is building. The +27.82% gain is just the beginning. Go long $SOPH 👇
Risk warning: The above is solely a personal opinion and does not constitute investment advice. Contract trading involves extremely high risk. Please manage your position size carefully.
post-image
SOPH-3.83%
Set copy-trading parameters to default
Don't adjust the lot size per order, or unrealized losses won't keep up
post-image
  • 1
🏦 $QNT wants banks to sell payments as their own product

Quant is making a major push to get banks offering payments under their own brand.

As proof, it points to its selection for The Clearing House tokenized deposit network.

Banks running their own payment products on Quant tech could be a huge shift.

Is $QNT the quiet giant of bank tokenization? 👇
post-image
QNT+4.79%
$AGT The uptrend is over. Let it fall to $0.03! Watch for short entry opportunities around $0.06 to $0.063.
post-image
AGT-26.77%
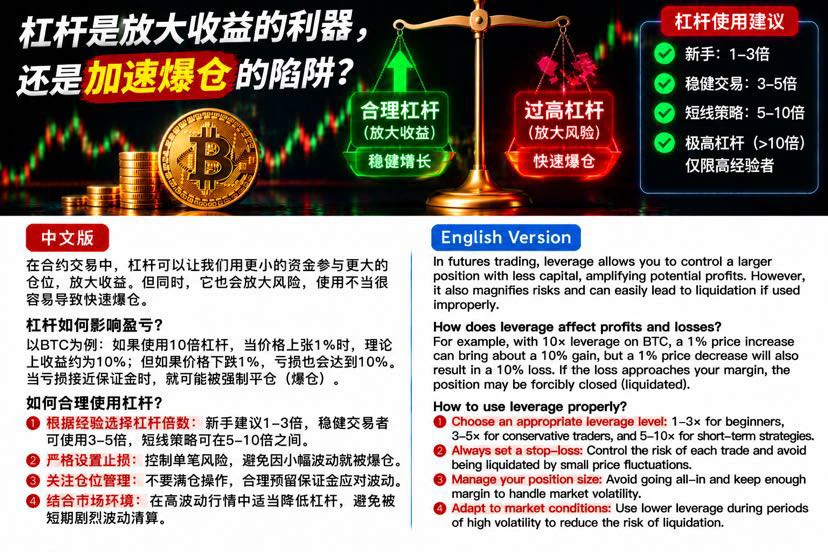
In cryptocurrency contract trading, leverage has always been one of the most exciting tools—and one of the most costly.

Many people think that using 10x leverage means they can earn a 10% return if BTC rises by just 1%. But they often overlook another fact: if the price moves 1% in the opposite direction, their losses are amplified just as much.

So how should leverage really be understood?

First, leverage amplifies your position, not your trading ability. Even if you correctly predict the market direction, an unreasonable entry point could still lead to severe losses due to short-term volat
post-image
BTC-0.65%
How to Identify Market Trends? Improve Your BTC Trading Win Rate with Trend Analysis

In cryptocurrency trading, many people look for the best entry and exit points every day, but overlook a more fundamental question: What trend is the market currently in?

If you haven't clearly identified the market's direction, even using more technical indicators may still lead to repeated bad decisions.

First, learn to identify the three basic market conditions.

First, an uptrend. Prices continue to form higher highs and higher lows, indicating that buyers have the upper hand. In this situation, focus o
post-image
BTC-0.67%
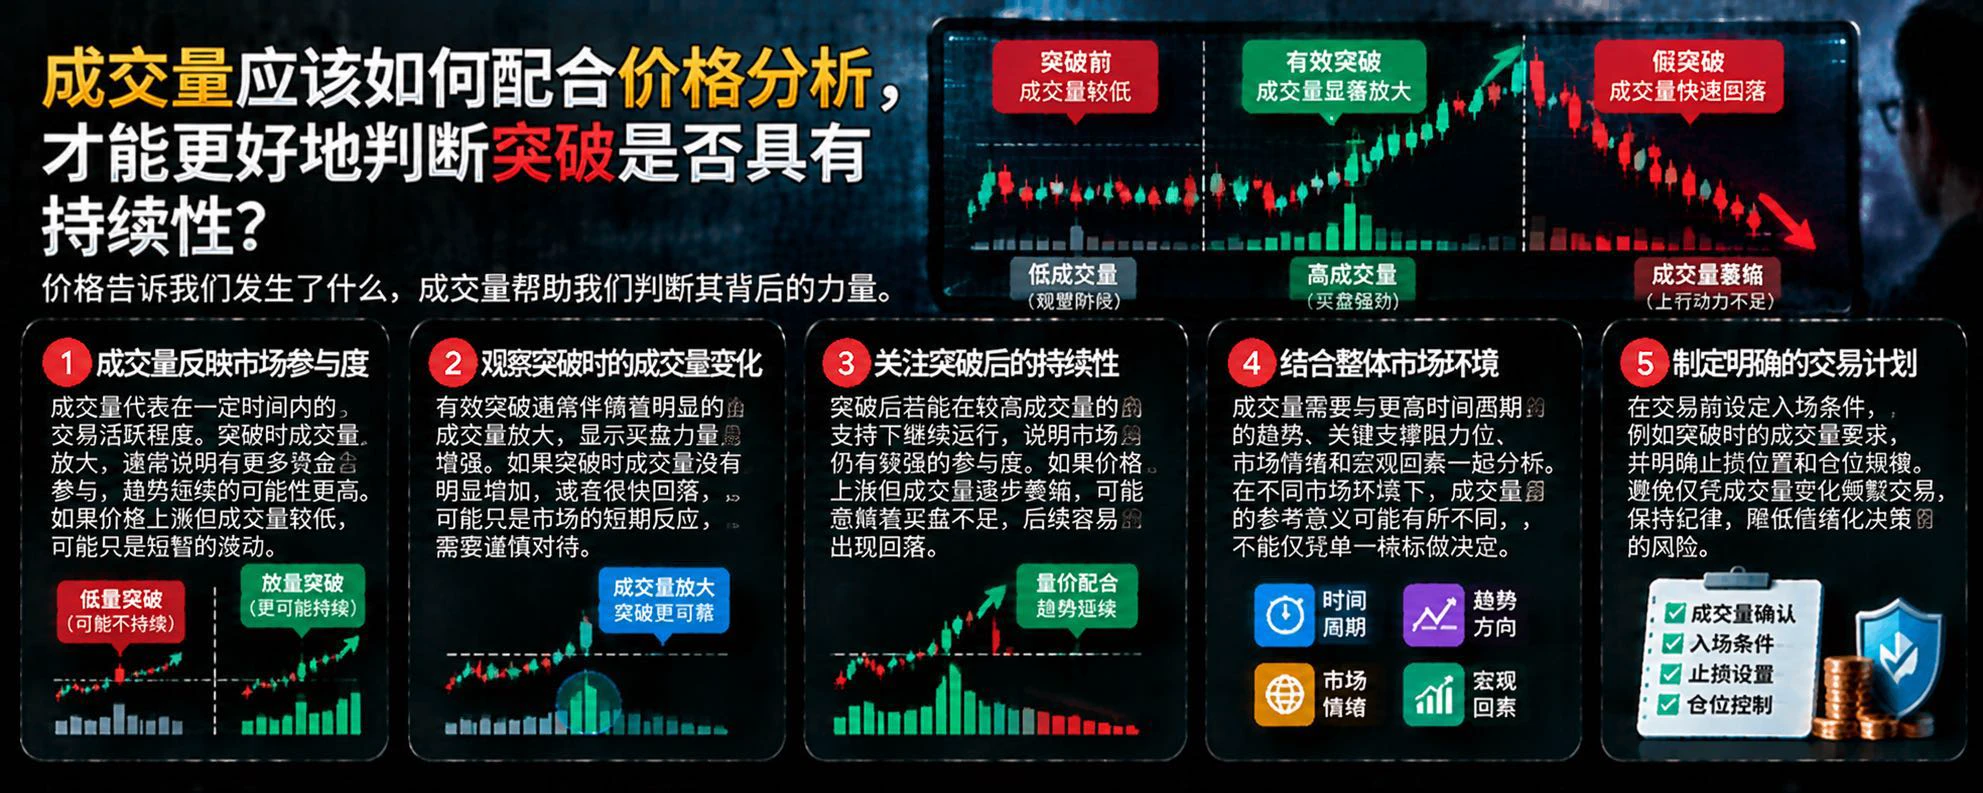
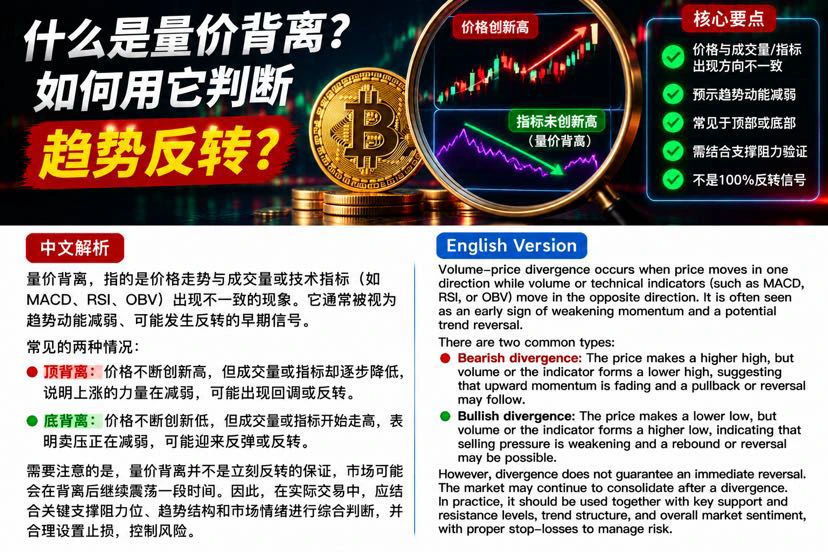
Many traders analyzing BTC price action tend to focus only on price movements while overlooking the information conveyed by trading volume and technical indicators. In fact, sometimes the price may still appear to be rising while the market’s underlying upward momentum has already begun to weaken. This phenomenon is called volume-price divergence.

So, how should you read volume-price divergence?

First, bearish divergence at the top. When the BTC price keeps making new highs but trading volume gradually declines, or indicators such as RSI and MACD fail to make new highs in tandem, it may mean
post-image
BTC-0.67%
Load More

Join 40 M users in our growing community

⚡️ Join 40 M users in the crypto craze discussion

💬 Engage with your favorite top creators

👍 See what interests you

Trending Topics

JensenHuangResigns

516.7K Views8.1K Discussing

Jensen Huang has resigned as NVIDIA CEO and stepped down from the board. CFO Colette Kress will serve as interim CEO while NVIDIA considers internal and external successors. $NVDA fell more than 10% in premarket trading following the announcement. With one of AI’s most influential leaders stepping aside, markets are now reassessing NVIDIA’s leadership stability, AI strategy, and long-term valuation.

GateIPOAccessAnthropic

280.8K Views2.6K Discussing

Dr.HanOxfordUnionSpeech

144.6K Views473 Discussing

View More