
Futures
Access hundreds of perpetual contracts
CFD
Gold
One platform for global traditional assets
Event Contracts
New
Predict price moves and seize opportunities
Options
Hot
Trade European-style vanilla options
Unified Account
Maximize your capital efficiency
Demo Trading
Introduction to Futures Trading
Learn the basics of futures trading
Futures Events
Join events to earn rewards
Demo Trading
Use virtual funds to practice risk-free trading
CFD
Stock CFD derivatives
US Stocks
Access real US stocks and ETFs
HK Stocks
Trade quality Hong Kong-listed stocks
Korean Stocks
SK Hynix
Real Korean stocks and top assets
JP Stocks
Top Japanese stocks, all in one place
TW Stocks
Gate TW Stocks
Real Taiwan stocks and top assets
Stock Futures
High leverage, 24/7 trading
Stock Options
New
Popular stock options, flexible leverage
Stocks Activities
Trade popular stocks and unlock generous airdrops
Tokenized Stocks
Backed by real stock assets
IPO Access
Unlock full access to global stock IPOs
Launch
CandyDrop
Collect candies to earn airdrops
Launchpool
Quick staking, earn potential new tokens
HODLer Airdrop
Hold GT and get massive airdrops for free
Pre-IPOs
Unlock full access to global stock IPOs
Futures Points
Earn futures points and claim airdrop rewards


Promotions
Others
Help Center
Find FAQs and help guides
Partners
Grow with the champions
Proof of Reserves
Gate promises 100% proof of reserves
Proof of Security (PoSEC)
Full cold storage for user funds
Gate Guard
Account Protection Plan
Gate Vault
Keep your assets secure
Licenses
Regulatory licenses, registrations, and approvals

Dark Clouds Over Bitcoin: What History, Flows and the Fed Really Say
Here is the uncomfortable answer nobody wants to hear. It is not coming. It already came.
Monday, 9 November 2026 — Morning Outlook
Bitcoin made its all-time high of $126,080 on 6 October 2025. By 30 June 2026 it had fallen to $58,559 — a peak-to-trough collapse of 53.1% in 267 days. It recovered to around $85,000 in September, and this morning it trades near $75,700, still 40% below its all-time high, after one of the ugliest weeks of the year. 😢
So the debate worth having is not whether a bear market is inevitable. The debate is whether the bear market that already happened is finished or whether it has one final leg left in it.
Why the short term still looks dark
Let us be honest about the evidence in front of us. This is not fear, uncertainty and doubt. These are numbers.
$BTC
First, the institutional bid has reversed. US spot Bitcoin ETFs lost about $1.28 billion between 2 and 6 November, their weakest week since June. One day alone, 6 November, saw $411.9 million walk out the door. The funds are now net negative for 2026 as a whole. The same ETF demand that carried Bitcoin to $126,000 is, right now, a source of selling pressure.
Second, the macro backdrop has turned hostile. October's jobs report came in at 165,000 new jobs against expectations of roughly 65,000. Within hours, markets were pricing a 77–80% chance of a Federal Reserve rate hike in December. Read that again. Not a cut delayed — a hike. Bitcoin has never built a sustainable rally while the Fed was tightening into it, and the next tests come fast: October CPI on Tuesday 10 November, producer prices on 13 November, and the Fed decision itself on 8–9 December.
Third, the chart is damaged. Bitcoin sits below its 20-day moving average ($79,340) and its 50-day moving average ($81,876). Daily RSI is near 39 — weak, but not yet at the washed-out levels that usually mark a final capitulation. More than $1.2 billion in leveraged positions were liquidated in a single 24-hour stretch last week, most of them longs. Bulls are still trying to catch this knife, and the market is still punishing them for it.
That is the bearish case, and in the short term, it is the correct case.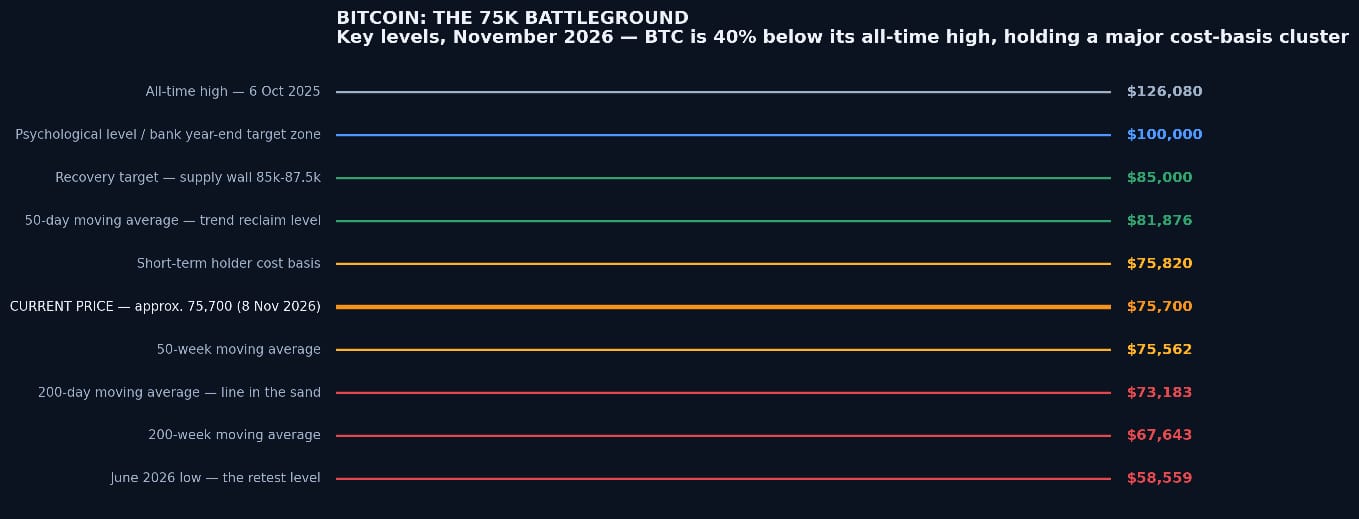
The $75,000 line is not random
Pay close attention to where the price is sitting, because this level is crowded with meaning.
Bitcoin is holding, for a fifth straight day, a tight cluster made up of the 50-week moving average ($75,562), the short-term holder cost basis ($75,820) and the average acquisition price of the largest corporate holder ($75,451). In plain English: a huge amount of Bitcoin changed hands, or was last bought, right here. Holders defend their cost basis. That is why $75,000 keeps holding.
Below it sits the real line in the sand: the 200-day moving average at $73,183. Bitcoin is only about 3.5% above it.
The scenario map from here is simple:
What history says — and where it argues with itself
Bitcoin's full bear markets were brutal: minus 84.7% in 2013–15, minus 84.2% in 2017–18, and minus 77.6% in 2021–22. They took 410, 363 and 376 days respectively to go from peak to bottom — an average of about 384 days.
Now apply that history to today, and it gives you two opposite answers.
The timing argument says the bottom should already be in. We are 399 days past the October 2025 peak. That is longer than the average bear market took to bottom. In both 2018 and 2022, by day 399 the worst was already over. Cycle analysts who projected a low in late October 2026, based on exactly this 384-day average, are — so far — roughly on schedule.
The depth argument says it cannot be over. Every previous bear market fell at least 77%. This one has fallen 53%. If Bitcoin repeated even the mildest historical pattern, the price would be somewhere between $29,000 and $44,000, not $75,000.
Both arguments cannot be fully right. The bridge between them is the trend nobody can ignore: Bitcoin's bear markets keep getting shallower — 94%, 87%, 84%, 78%, and now 53%. Each cycle, the asset is larger, more liquid, and held by longer-horizon buyers. A 53% bear market for a multi-trillion-dollar asset may simply be what a modern Bitcoin bear market looks like. Or the shallowness means the final flush has not happened yet. Honest analysis holds both possibilities open — and prices them.
The quiet evidence that this is not 2022
While the price action screams fear, the on-chain and sentiment data are telling a calmer story.
The Fear and Greed Index sits at 25–28 — extreme fear — but the futures market shows low leverage, which means this fear is psychological, not forced selling. The MVRV ratio is 1.41 and the MVRV Z-score is 0.70–0.78, deep in what has historically been accumulation territory, not euphoria. The Mayer Multiple is 1.04, almost exactly neutral. The average holder is sitting on a modest profit, not a life-changing one, and there is no sign of the mass profit-taking that marks real cycle tops.
Spot trading activity, meanwhile, has stayed above its August trough — participation has not collapsed the way it did in the dead months of previous winters. And while ETF holders sold last week, long-horizon buyers kept buying: corporate treasuries added more than 15,000 BTC in October alone, and at least one central bank publicly announced a new allocation to Bitcoin funds last week.
Fear at the top looks like greed's mirror image. Fear at these levels, with these on-chain readings, has historically been closer to opportunity than to the end of the world. That is a statement about zones, not timing — extreme fear can always get more extreme before it turns.
What the forecasters are saying
The big institutional targets are still bullish — but read the fine print, because every one of them is conditional on ETF flows returning:
Against that, the cycle specialists are cautious: one widely followed macro analyst warns that if technology stocks retest their summer lows, Bitcoin will too, with $58,000 in his deeper scenario. Fidelity's global macro director spent most of 2026 calling it a consolidation year, then flipped in September to calling a double bottom near $58,000–$60,000 with a $100,000 target — a thesis that lives or dies on whether that June low holds.
Translation: the bulls need flows. The bears need one support break. Right now, the bears have momentum and the bulls have a level.
My probability-weighted outlook
For the next two to six weeks, into the December Fed decision:
For the medium term, the next three to six months, my honest assessment is this: the probability of a new low below $57,800 is roughly 25–30%. The probability of at least one visit to the $65,000–$69,000 zone is closer to 45–50%. The probability of Bitcoin trading back above $100,000 by mid-2027 is around 35–40%, and it depends almost entirely on two variables: ETF flows and the Fed.
The bottom line for this morning
Short term: bearish, and there is no point pretending otherwise. The trend is down, the flows are out, and the central bank is threatening to hike. Trade this market as guilty until proven innocent.
But calling a brand-new, full-scale crypto winter from here is bad maths. A 53% drawdown and 399 days of bear market have already happened. Bitcoin is sitting exactly on the cost basis of its most committed holders, sentiment is at extreme fear, on-chain valuation is in the accumulation zone, and the historical clock says bottoms form around now — not that they are guaranteed to.
The level that decides everything this week is $73,000 on a weekly close. Above it, this is a deep correction inside a longer cycle. Below it, and below $67,600 after that, the conversation changes completely.
Watch the CPI print on Tuesday. Watch whether ETF flows stop bleeding. And watch $75,000 — because as long as it holds, the bears have a forecast. The moment it breaks, they have a trend.
Disclaimer: This article is market commentary for information only and is not financial advice. Probabilities are the author's estimates based on data available on 8–9 November 2026 and will change as new data arrives.
#Bitcoin outlook#
#BTC