Share your thoughts
placeholder
Article
Quickly enter a short trade on $FF
, selling at: 0.15500 or 0.15800 First target 0.14500 Second target 0.14000 Third target 0.13500 Final target 0.13000++ Stop-loss: above 0.16800 Sell here to enter 👇$FF
post-image
FF+31.45%
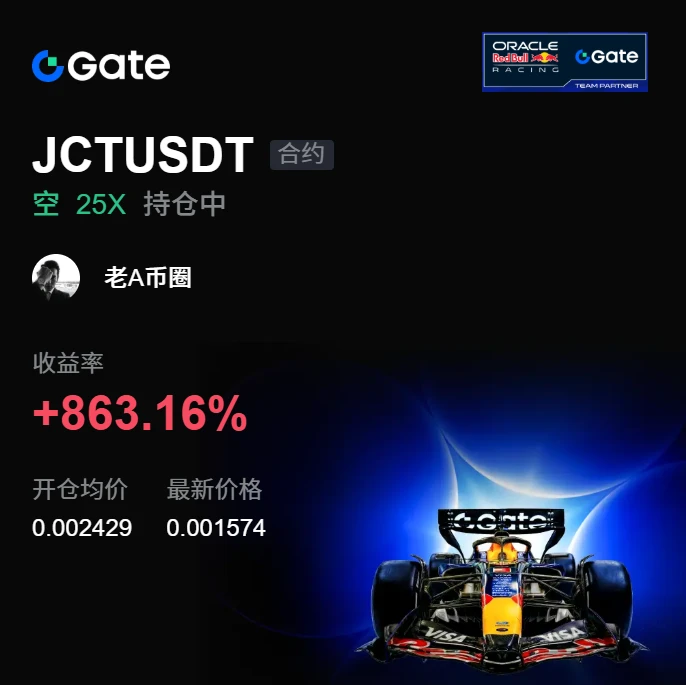
Some trades are just like this: the more you stare at them, the less they move; the moment you turn away, they take off. When I checked the chart after lunch, $JCT was moving sideways at a high level, with insufficient buying support and shrinking volume. Any pressure from above sent it back down. I warned not to enter; the rebound was simply an opportunity to open short positions.
0.002429 to 0.001572, short +863.16%. Feels good.
The market is waited out, and profits are held onto.
Even if you only make one point, as long as you can take it away, it is yours; no matter how much floating prof
post-image
JCT-4.55%
ADA-0.88%
SOL-0.88%
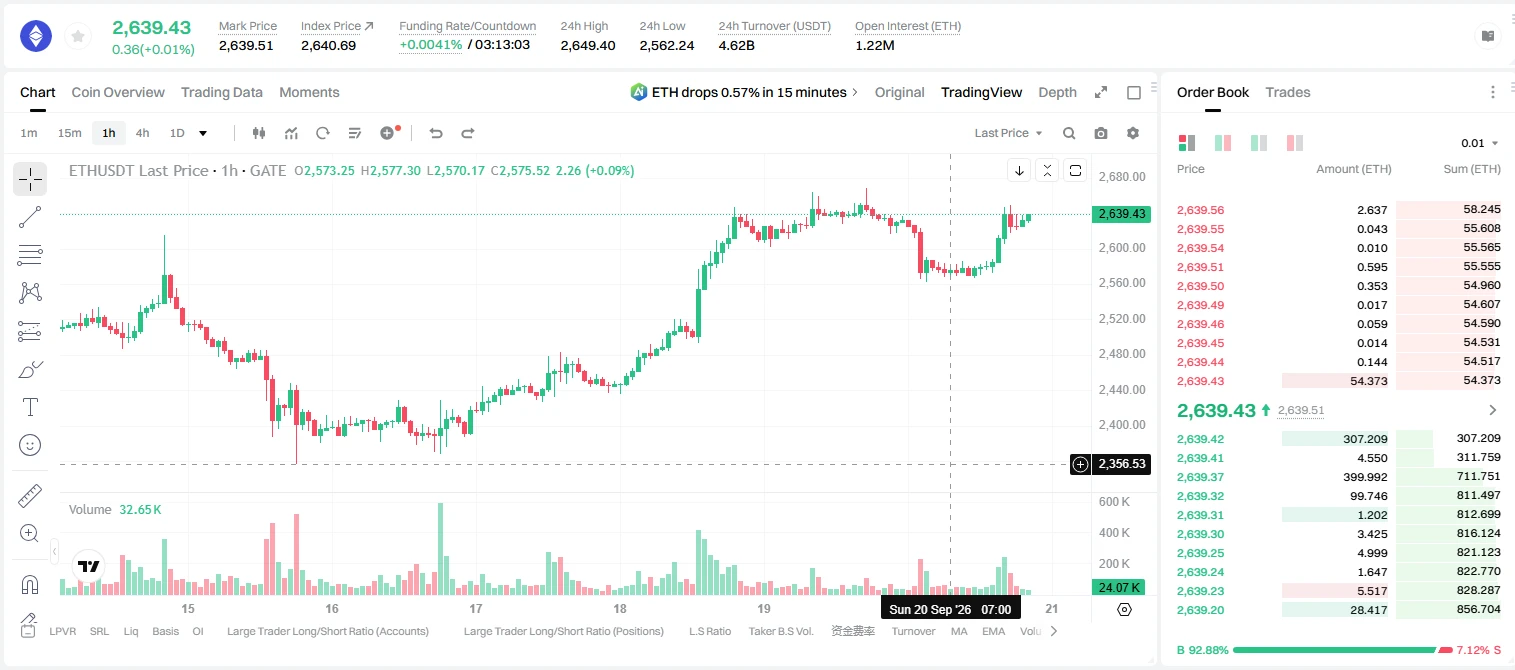
Everyone is about to miss the ETH move that is already in motion.

$ETH /USDT - LONG

Trade Plan:
Entry: 2633.1 – 2642.5
SL: 2592.9
TP1: 2671.5
TP2: 2693.9
TP3: 2727.6

Why this setup?
Why now? The 1h price sits at 2637.8 inside a tight entry zone between 2633.1 and 2642.5, which means the market is coiling right at the trigger. The daily trend is bullish, giving the long direction a macro tailwind that most short-term traders are still ignoring. The 15m RSI at 62.49 shows room to run before overbought, while the 1h ATR of 18.701683 defines the volatility we must respect. Target one sits at
post-image
ETH-0.17%
Everyone is watching SYMBOL but nobody is preparing for the drop that is already forming.

$SNDK /USDT - SHORT

Trade Plan:
Entry: 1771.53 – 1774.85
SL: 1793.93
TP1: 1757.64
TP2: 1747.27
TP3: 1731.71

Why this setup?
Why now? The daily trend is range, which means a breakout in either direction is overdue and the 4h bias has already turned SHORT with 77 percent confidence. The 1h ATR is 6.646909, so any pullback toward the entry zone of 1773.19 carries a realistic 6.6 point swing that can accelerate the move. The 15m RSI is at 57.27, which is not overbought yet but is already drifting from t
SNDK-0.64%
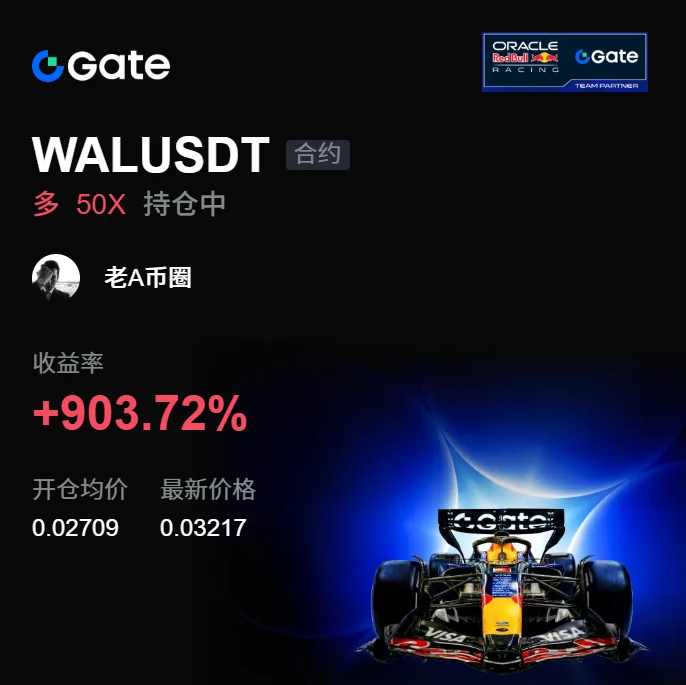
I had already finished complaining to my friends about this week’s market, but now I have to take it all back—it’s a little awkward. A few days ago in the afternoon, $WAL held firm after a pullback, buying pressure strengthened, and I signaled to go long, entering around 0.02709.
From 0.02709 to 0.03218, unrealized profit reached +901.94%. The timing was spot on, and this trade felt great.
Take 80% off the table first, move the stop-loss on the remaining 20% to the entry price. Don’t get greedy for the last bite; if it keeps surging, let the profits run.
Don’t get overconfident in profit or d
post-image
WAL-2.41%
XRP-1.17%
SOL-0.88%
Layout for Bitcoin, Ethereum, and Dogecoin
live-cover
LIVE1,611
One Friday rewrote the Bitcoin ETF flows for the entire week.
This week was packed with macro events, and the market had originally feared that funds would withdraw across the board. In the end, Friday's net inflows offset the outflows from earlier in the week, so the weekly data did not turn into all outflows. The Ethereum ETF's pattern was similar.
A single day's figures can change the weekly balance sheet, but they cannot change one fact: ETF flows are increasingly following the macro calendar. Interest rate decisions, inflation data, and Treasury yields matter more than any on-chain indica
post-image
ETH+7.79%
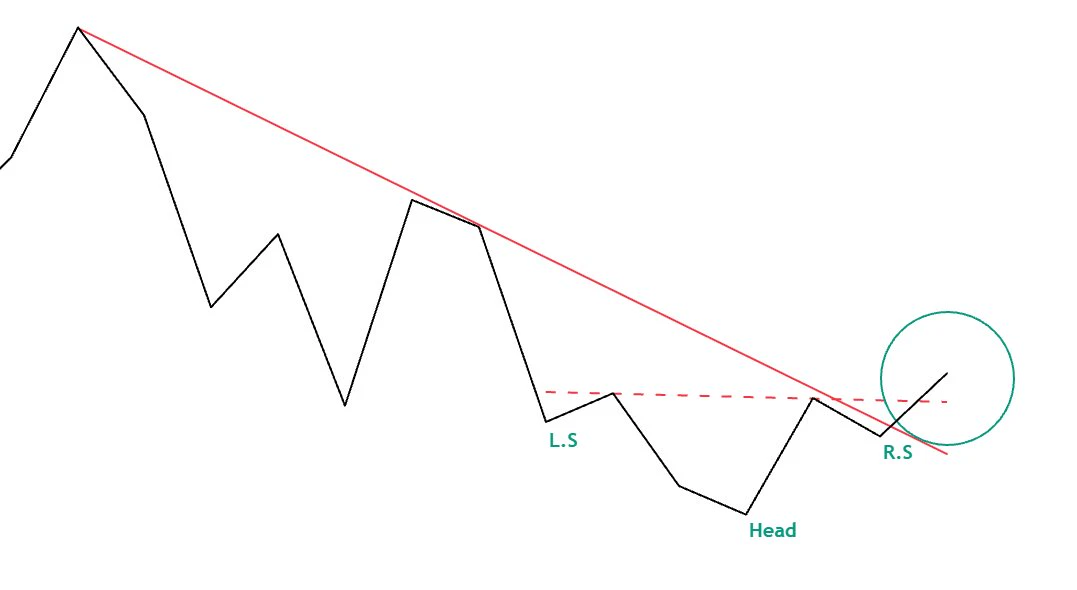
Chart of the day ❓
Which stock could this active inverse H+S setup belong to? I will share the correct answer
post-image
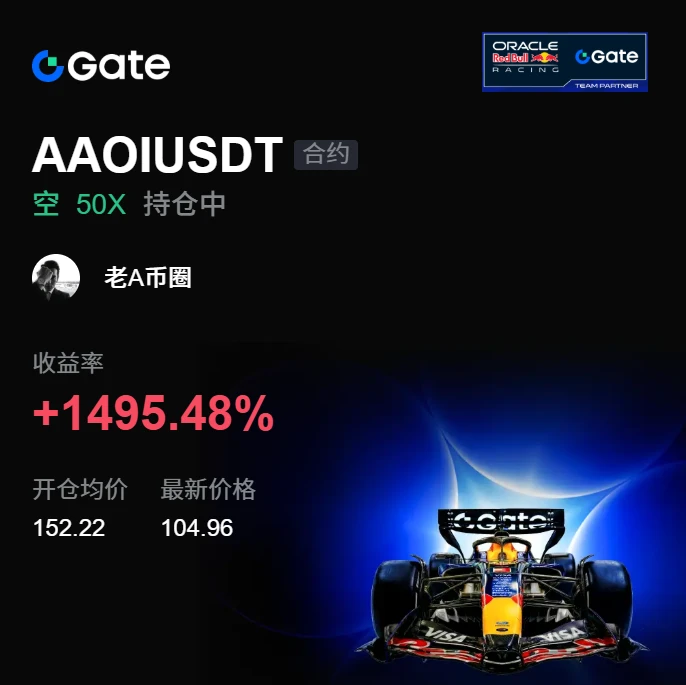
Honestly, I’m surprised this trade is still alive—I thought it was iffy myself. Luck played a big part. From 152.22 to 104.93, the short position delivered +1495.48% in realized gains. Nailed it.

During the repeated intraday swings, $AAOI weakened every time it pushed higher, with feeble rebounds, strong selling pressure, and clear resistance overhead. I warned at the time not to be fooled by minor rebounds—the bearish structure was still intact.

Managing risk upfront is called rationality; cutting losses only after taking a hit is called biting the bullet.

Being out of a position is no
post-image
AAOI-0.99%
BTC-0.23%
SOL-0.88%
I had already finished complaining to my friends about this week’s market, but now I have to take it all back. A bit awkward.
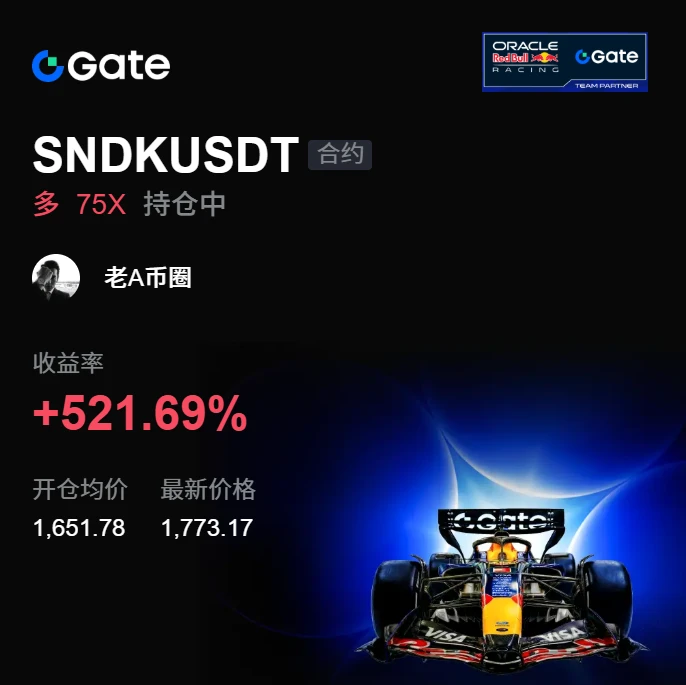
A few days ago, when the price pulled back that afternoon, I saw $SNDK hold steady and buying pressure strengthen, so I suggested entering a long position around 1651.78. From 1651.78 to 1773.12, +521.61%—those who got in should be waking up laughing.
Don’t let profits inflate your ego, and don’t despair over a drawdown. Managing risk in advance is called rationality; cutting losses only after losing is called cutting off an arm to save the body.
Take profit on 80% fir
post-image
SNDK-0.64%
BTC-0.23%
ZEC+0.38%
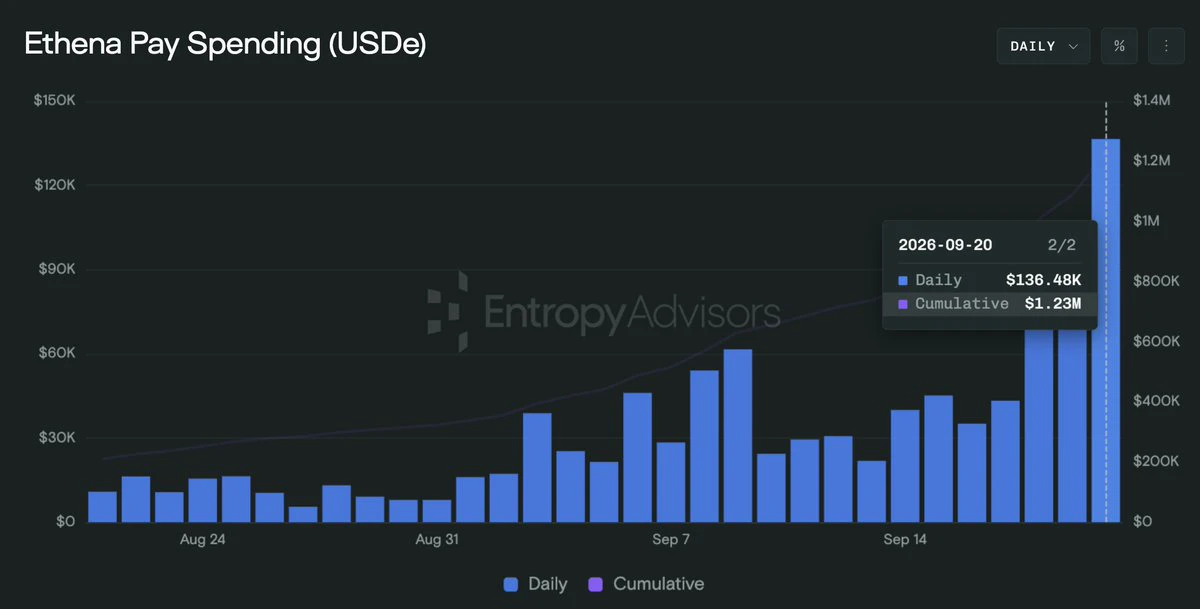
Weekend spending spree: Ethena Pay hit a new daily spending-volume high of $138K.
Cumulative spending volume has now reached $1.2M.
post-image
ENA+7.52%
UNI is about to break out while everyone is sleeping on the 4h setup.

$UNI /USDT - LONG

Trade Plan:
Entry: 8.730 – 8.814
SL: 8.369
TP1: 9.074
TP2: 9.275
TP3: 9.578

Why this setup?
Why now? The daily trend is bullish, the 1h RSI sits at 52.17 showing room to run, and the 1h ATR of 0.167828 confirms volatile expansion is already starting. The entry zone anchors at 8.772, with TP1 at 9.074 and TP2 at 9.275, while the invalidation level at 7.466 is the hard line that protects the entire structure. A breach of 7.466 would wipe out the setup, so every tick above 8.772 is a step toward the proj
UNI+2.05%
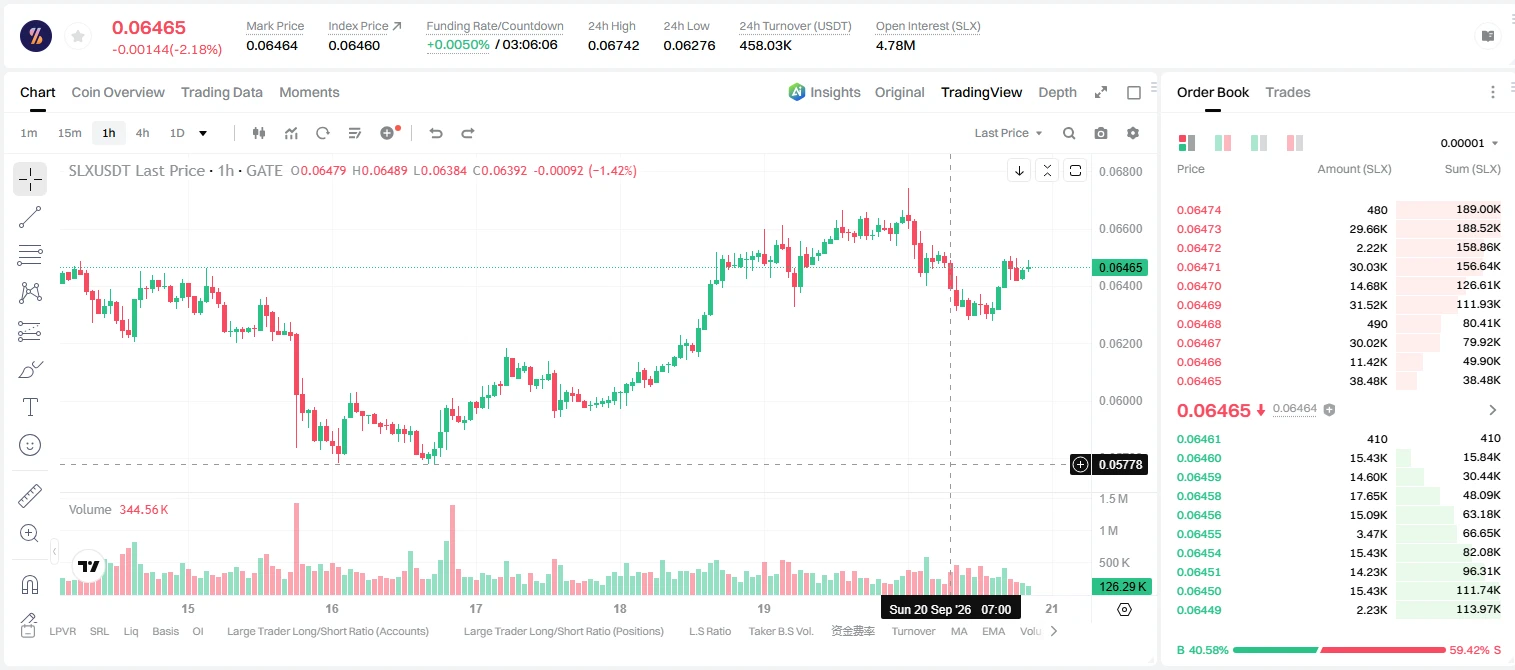
Everyone is about to get blindsided by $SLX /USDT

$SLX /USDT - SHORT

Trade Plan:
Entry: 0.06445 – 0.06483
SL: 0.06650
TP1: 0.06325
TP2: 0.06232
TP3: 0.06092

Why this setup?
Why now? The 1h price sits at 0.06464, the exact entry_ref for the SHORT bias, and the 1h ATR of 0.000774 shows enough volatility to push through the entry zone toward the first target. The 15m RSI at 60.25 means momentum is still leaning bullish, so a mean-reversion move down would be a sharp surprise. With the daily trend tagged as range, this setup is a range-bound fade rather than a breakout continuation, which ma
post-image
SLX-2.56%
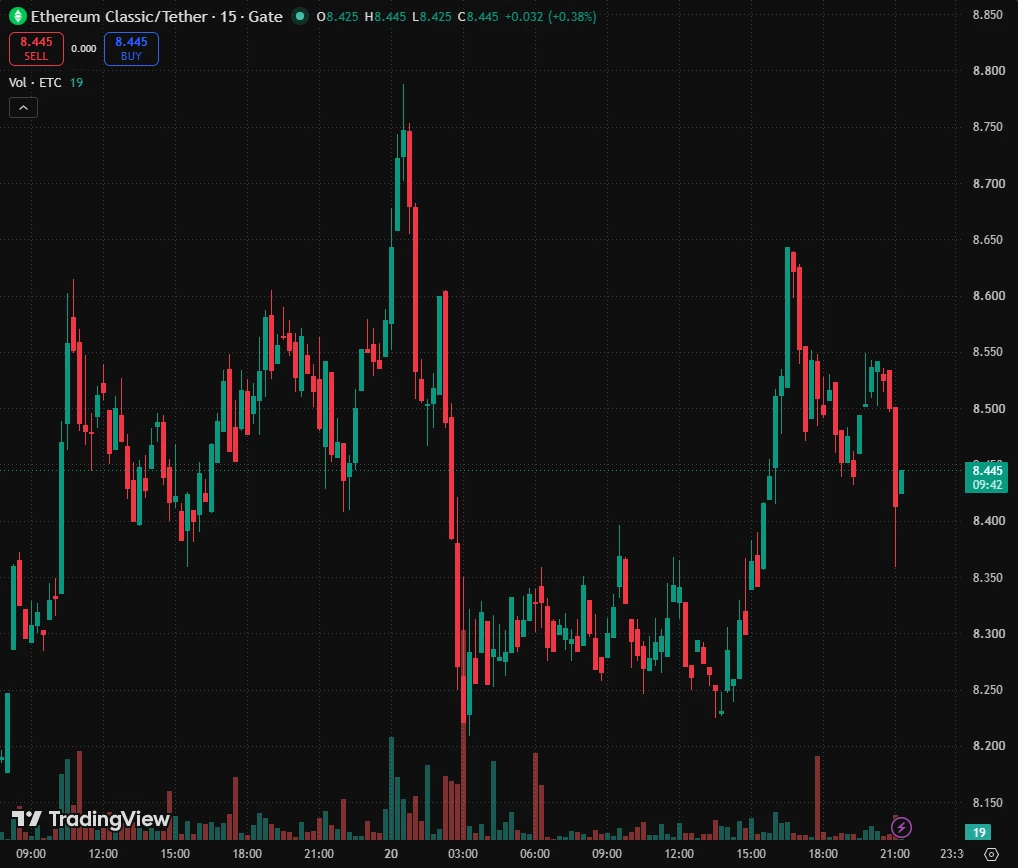
$ETC etcusdt short
INSTRUCTIONS TO READ AND TO FOLLOW:
Entry point: yellow
Stop loss: red
Take profit: green or blue
Leverage x 5-10-20 for crypto
Leverage x 20-50-100 for commodities, stocks, indices, and forex
Margin 1-5% max:
This limits your maximum loss to 5% and guarantees that you retain 95% of your portfolio in the event of a stop-loss.
ALWAYS PRACTICE RISK AND MONEY MANAGEMENT:
Invest a maximum of 5% on any trade or across all your trades.
Invest only what you can afford to lose, as no one is in control of the market.
I repeat: this limits your maximum loss to 5% and guarantees—or rat
post-image
ETC-0.82%
Insiders are calling this the most dangerous setup since ZEC bottomed.

$ZEC /USDT - LONG

Trade Plan:
Entry: 1519.15 – 1531.53
SL: 1465.90
TP1: 1569.92
TP2: 1599.64
TP3: 1644.21

Why this setup?
Why now? The daily trend is firmly bullish, and the 1h price has just reached 1525.34, creating a precise entry zone between 1519.15 and 1531.53. The 1h ATR of 24.7655 confirms we are in a high-volatility regime where a break either way will be explosive. The 15m RSI is sitting at 79.68, which is deeply overbought and signals that the current momentum is stretched to its limit. The plan targets TP1
ZEC+0.38%
  • 1
MARKET OVERVIEW
live-cover
LIVE12
Insiders are watching SYMBOL break the 1h ATR and fade the bounce

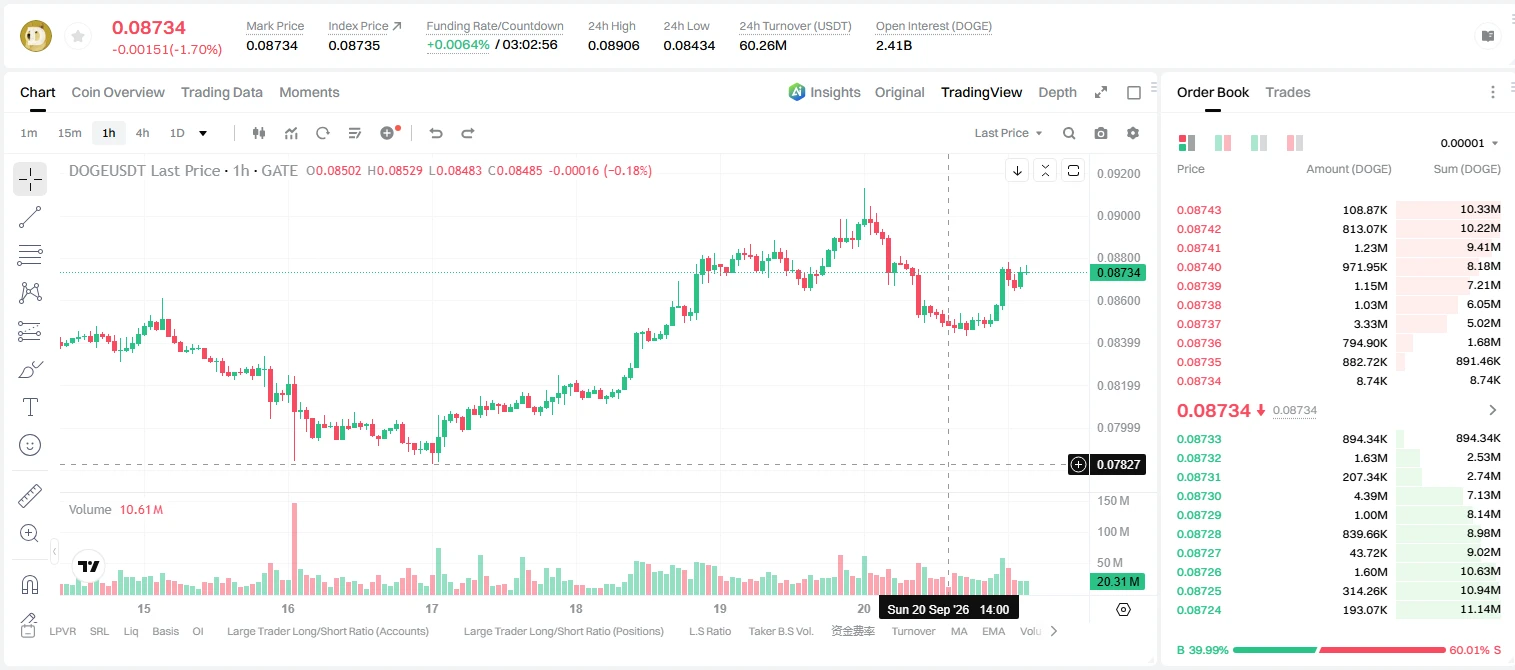
$DOGE /USDT - SHORT

Trade Plan:
Entry: 0.08706 – 0.08752
SL: 0.08950
TP1: 0.08563
TP2: 0.08452
TP3: 0.08286

Why this setup?
Why now? The daily trend is range, but the 1h price is holding at 0.08729 against a 15m RSI of 64.5, which means short sellers are defending the upper edge of the entry zone. The 1h ATR of 0.000922 shows enough volatility to push SYMBOL from the entry low of 0.08706 toward TP1 at 0.08563 and then TP2 at 0.08452. This trade uses the range structure to target the invalidation level of 0.08580 as the har
post-image
DOGE-1.37%
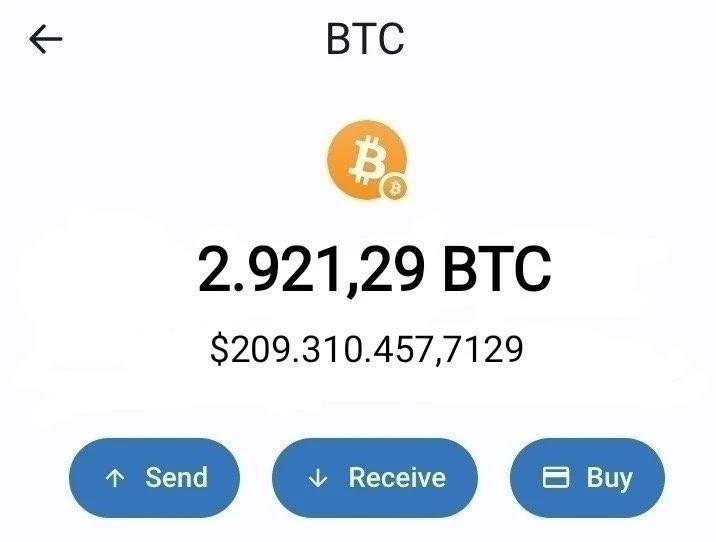
I'm giving away 0.1 BTC to one random person!
As promised, I'm sending 0. 1 BTC (~$8,000) to one lucky follower.
To participate, like, retweet, and comment 'Okay'.
* You will be disqualified if you are not a follower.
The winner will be announced within 24 hours!
Grab your chance!
post-image
BTC-0.22%
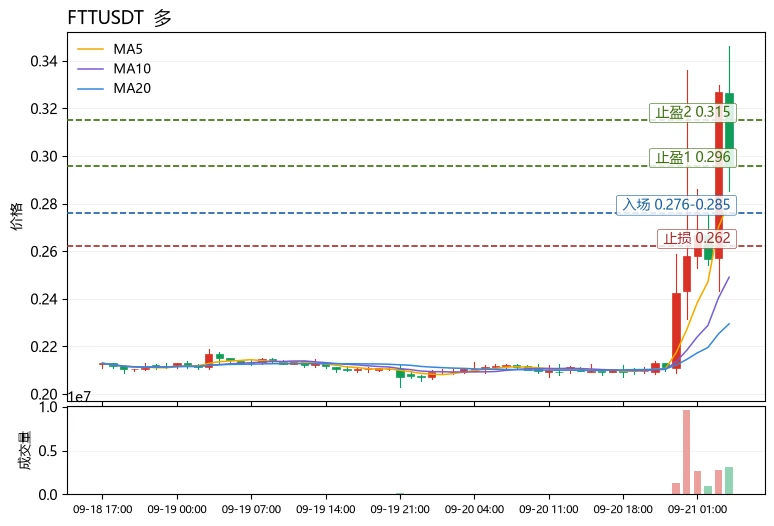
Many people rush to chase after seeing a 40% bullish candle, only to end up buying at the tip of a needle on the upper Bollinger Band. To judge whether this kind of sharp rise is worth following, I habitually first check whether the moving-average structure is healthy, rather than looking at the percentage gain.
Take $FTT as an example. The current price is 0.296, and MA5=0.2809 has clearly crossed above MA20=0.2295. The short- and medium-term moving averages are arranged bullishly, which is the first confirmation of a healthy trend; if the price pulls back to MA5 without breaking below it, i
post-image
FTT+31.43%
COTI-4.77%
ONE+0.09%
$SAGA The long setup looks ready; then make money with professormike...!!! It will bring us $SUI
in profits. Entry 0.03650 & 0.03700, stop-loss 0.03255, take-profit 0.04000–0.04500–0.04979, long $SAGA 👇SOLJumpsAbout10%
post-image
SAGA+49.14%
SUI+2.50%
Load More

Join 40 M users in our growing community

⚡️ Join 40 M users in the crypto craze discussion

💬 Engage with your favorite top creators

👍 See what interests you

Trending Topics

MSTRTopsNasdaq100

74.31k Views3.05k Discussing

Strategy (MSTR) has gained about 48% over the past month, making it the best-performing stock in the Nasdaq 100, while Bitcoin rose roughly 12% over the same period. The company holds 845,050 BTC with a cumulative cost basis of about $63.73B. MSTR is not a pure Bitcoin proxy — its price swings can be more extreme. Can this rally last?

Gate Tops 24H Net Inflows Among Exchanges

26.56k Views3.69k Discussing

BTCRetakes80K

57.42k Views60.74k Discussing

View More