The Net Realized Profit/Loss indicator for Bitcoin has been continuously weakening since the price dropped from its peak in late January, around the $90,000 mark. Along with the downward trend, realized losses across the market are growing, reflecting increased selling pressure.
As of February 6th, Net Realized P/L sharply fell to nearly -$330 million, marking one of the most intense capitulation phases in this period, when Bitcoin briefly plunged close to $63,000–$65,000.
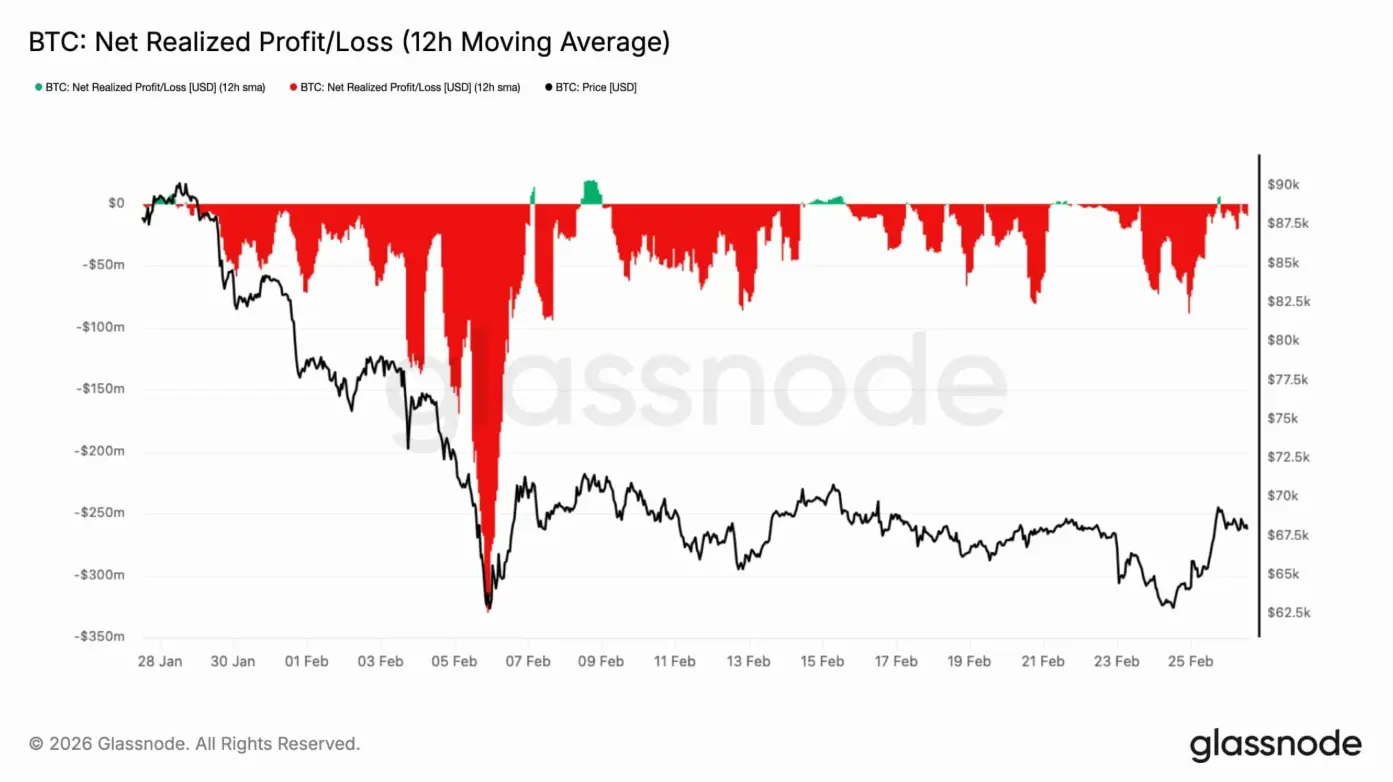 Source: Glassnode/ After the sharp drop, selling pressure gradually eased. Realized losses narrowed as prices stabilized and gradually recovered to the $68,000–$70,000 range. However, the indicator still leans negative, indicating most investors are still taking advantage of rebounds to exit positions rather than actively holding.
Interspersed within this bleak picture are scattered “spikes” in green, reflecting short-term profit-taking activity by traders. For example, on February 25th, realized profits exceeded $5 million per hour as BTC rapidly surged to $69,400.
Nevertheless, this profit-taking quickly halted the rally. Prices continued to be held below $70,000, reinforcing a stubborn resistance zone. As long as selling pressure remains strong and liquidity does not improve, the market is likely to stay “compressed” within the $63,000–$70,000 consolidation range.
URPD Data Shows Heavy Accumulation of BTC in the $60,000–$70,000 Range
Under ongoing profit-taking pressure keeping prices around $70,000, Bitcoin’s short-term momentum appears to have stalled. However, beneath the surface, a fundamental supply restructuring is underway, clearly reflected in the Entity-Adjusted URPD data. This indicator shows significant accumulation of Bitcoin in the $60,000–$70,000 range.
Initially, supply below $60,000 was quite dispersed, reflecting continuous capital rotation amid a strong market correction. But as prices moved into the mid-cycle correction zone, accumulation behavior accelerated, indicating a shift in investor sentiment.
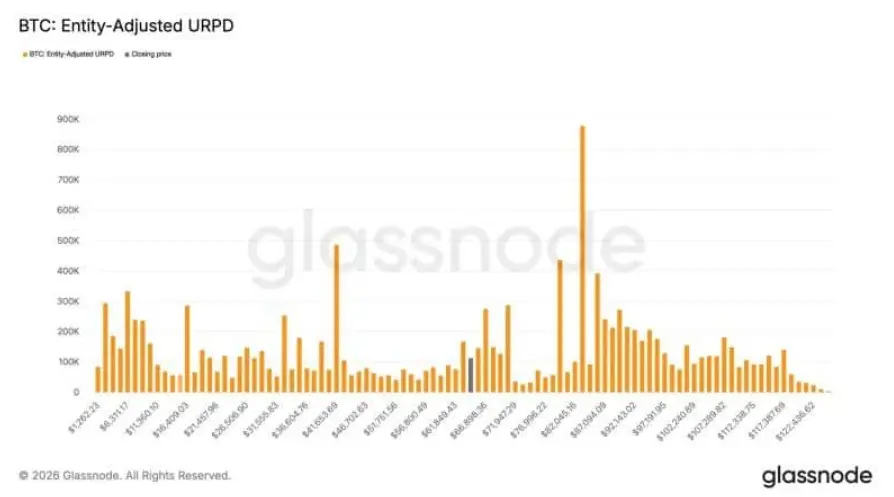 Source: Glassnode/ A notable highlight is around the $63,000–$64,000 zone, where Bitcoin holdings ballooned to nearly 850,000 BTC. This concentration likely reflects aggressive “bottom-fishing” activity, with market players absorbing supply during the decline. Over time, this area has developed into a key liquidity cluster.
Simultaneously, new supply layers have emerged in the $65,000–$69,000 range, with multiple accumulation bands exceeding 200,000 BTC. These clusters help reinforce the demand base gradually forming beneath the current price level.
Overall, the recent correction was not just a technical pullback but also a redistribution of supply into “stronger hands.” The accumulation of over 400,000 BTC in the $60,000–$70,000 zone is making this area an increasingly solid support structure for Bitcoin.
Coinbase Premium Turns Positive as US Demand for BTC Recovers
Finally, alongside the ongoing accumulation in the $60,000–$70,000 range, signs of demand recovery from the US market are emerging. Notably, the Coinbase Premium Gap has turned positive, reaching +14.7% on February 27th, ending nearly four months of negative readings.
Previously, this premium had fallen deep into negative territory, approaching -200 at times, amid weakening Bitcoin prices and a retreat to around $67,900. This trend reflected subdued spot buying activity in the US compared to global exchanges.
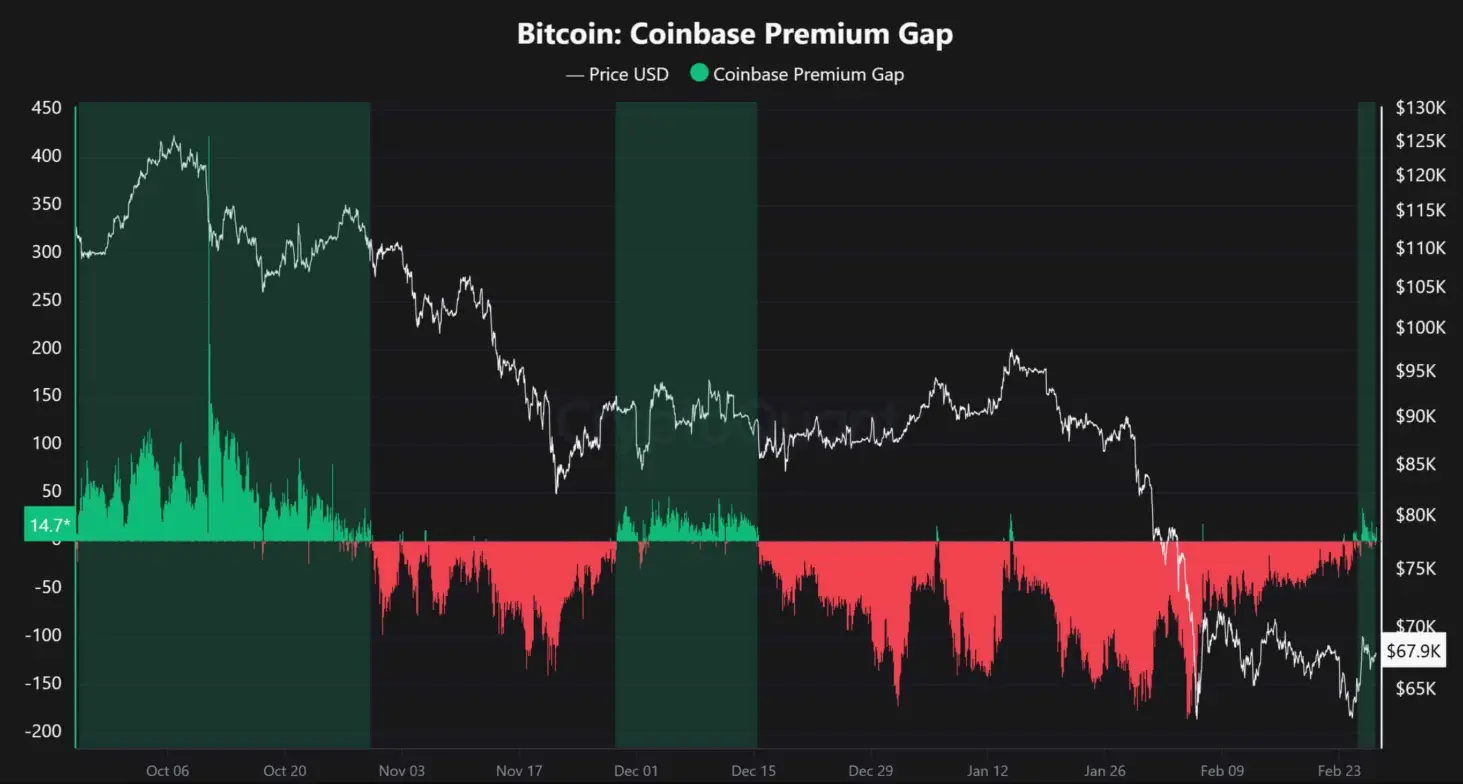 Source: CryptoQuant However, the recent positive shift may indicate changing sentiment: US buyers on Coinbase seem ready to accept higher prices. Historically, similar premium phases in October–November 2024 served as early signals, paving the way for a strong rally from below $100,000 to nearly $125,000.
Nevertheless, since late 2024, the market has also experienced several short-lived green “spikes” that quickly faded. To confirm a more sustainable trend, at least three to five consecutive sessions of positive premium are needed. Only then can this signal truly reflect a durable return of institutional capital, rather than a fleeting demand rebound.
SN_Nour


