AI stock trading is the use of machine learning, natural language processing, statistical models, and automated software to process stock market data and support investment research, signal generation, portfolio management, or order execution. For retail investors and traders exploring AI-powered stock trading tools, that can mean anything from screening stocks and identifying market trends to analyzing news and earnings reports, managing position sizes, and executing strategies under predefined conditions.
2026-07-29 05:52:05
AI stock trading bots are not inherently safe or unsafe. Their actual risk depends on model quality, data sources, execution permissions, risk controls, and the level of human oversight. A bot can improve data processing and execution efficiency, but it can also turn flawed signals, software errors, or poorly designed strategies into real orders at high speed.
2026-07-29 05:51:33
Pons on Robinhood Chain (Chain ID 4663) provides a token launch and trading interface: creation deploys a fixed-supply (1 billion) token and WETH Uniswap V3 pool in a single transaction, with no bonding curve and no post-launch pool migration. Liquidity locks automatically; when paired WETH in the pool reaches the default 4.2 ETH threshold, Graduation marks the status while trading continues in the same pool. Fees split per launch-time snapshot; protocol share may buy back PONS and send to a burn address.
2026-07-29 05:23:03
Pons charges a 1% Uniswap V3 pool fee on both token and WETH sides, plus a separate 0.0005 ETH launch fee at creation. Pool fees split at launch snapshot: Active factory (from block 8991118) uses 70% creator / 30% protocol; Legacy (from block 8600612) uses 90% / 10%. Protocol share can fund PONS buybacks sent to a burn address; burns adjust circulating-supply metrics but do not guarantee price increases.
2026-07-29 05:10:51
The core difference between Pons and bonding-curve launchpads is path structure: Pons deploys a fixed-supply token and WETH Uniswap V3 pool in one creation transaction—no bonding curve and no liquidity migration—while Graduation only marks when paired WETH hits a threshold (default 4.2 ETH). Typical bonding-curve launchpads trade on a curve first, then migrate liquidity to a DEX pool at graduation. Both are launch interfaces, but pricing origin, whether migration occurs, and what graduation means differ.
2026-07-29 04:19:51
On Pons, token launches follow Create → Trade → Graduate: Create deploys a fixed-supply (1e9) token and WETH Uniswap V3 pool in one transaction (1% pool fee, 0.0005 ETH launch fee, locked liquidity) with no bonding curve; Trade buys and sells in the same pool; Graduation marks when paired WETH hits the default 4.2 ETH threshold—trading stays in that pool. Launch protection applies for the first 2 blocks: creator-only initial buy in the launch block; per-wallet hold cap ≤5% and buy cap ≤5.5%.
2026-07-29 04:19:32
Trading VOOG with USDT on Gate Stocks follows a fixed path: confirm Stocks permissions and available USDT, search ticker VOOG, verify Vanguard S&P 500 Growth ETF, choose an order type, then review holdings and order history after the fill. The workflow handles execution checks; index boundaries and style exposure belong to ETF structure research and should be separated from VOO, VUG, and similar tickers.
2026-07-29 03:40:48
The core difference among VOOG, VOO, and VUG is the index each tracks: VOOG follows the S&P 500 Growth Index (large-cap growth slice), VOO follows the full S&P 500 (growth and value together), and VUG follows the CRSP US Large Cap Growth Index (broader U.S. large-cap growth, not a pure S&P 500 Growth slice). Comparison should align index boundaries first, then verify expense ratios and tickers—without ranking which product is better.
2026-07-29 03:18:42
VOOG (Vanguard S&P 500 Growth ETF) is an exchange-traded fund stock issued by Vanguard that tracks the S&P 500 Growth Index and, through full replication, holds exposure to the growth-style constituents of that index. According to Vanguard’s product-page disclosure, the expense ratio is about 0.07%. Understanding VOOG means separating its index boundary from the broad S&P 500 (VOO) and from broader U.S. growth exposure (VUG), then verifying ticker, order fields, and fee rules on Gate Stocks.
2026-07-29 03:12:39
Buying USDT (Tether) usually follows four paths: fiat Quick Buy, P2P (peer-to-peer) trading, swapping other crypto on the spot market, or depositing existing USDT from an external wallet. The core flow is account and identity verification, choosing payment and settlement method, confirming amount and network, then reviewing balance and order status after credit.
2026-07-29 00:50:12
U card costs usually combine top-up fees, FX conversion fees, withdrawal fees, payment-network charges, and exchange-rate spread. Whether a U card is inexpensive depends on top-up path, withdrawal frequency, cross-border payment patterns, and effective FX loss—not on any one headline rate alone.
2026-07-28 08:56:03
The Ichimoku Cloud indicator is a technical-analysis system that combines trend direction, momentum, dynamic support and resistance, and signal confirmation on one chart. Swing traders use its five lines and shaded cloud to assess whether a market is trending, consolidating, weakening, or potentially reversing.
2026-07-28 03:24:53
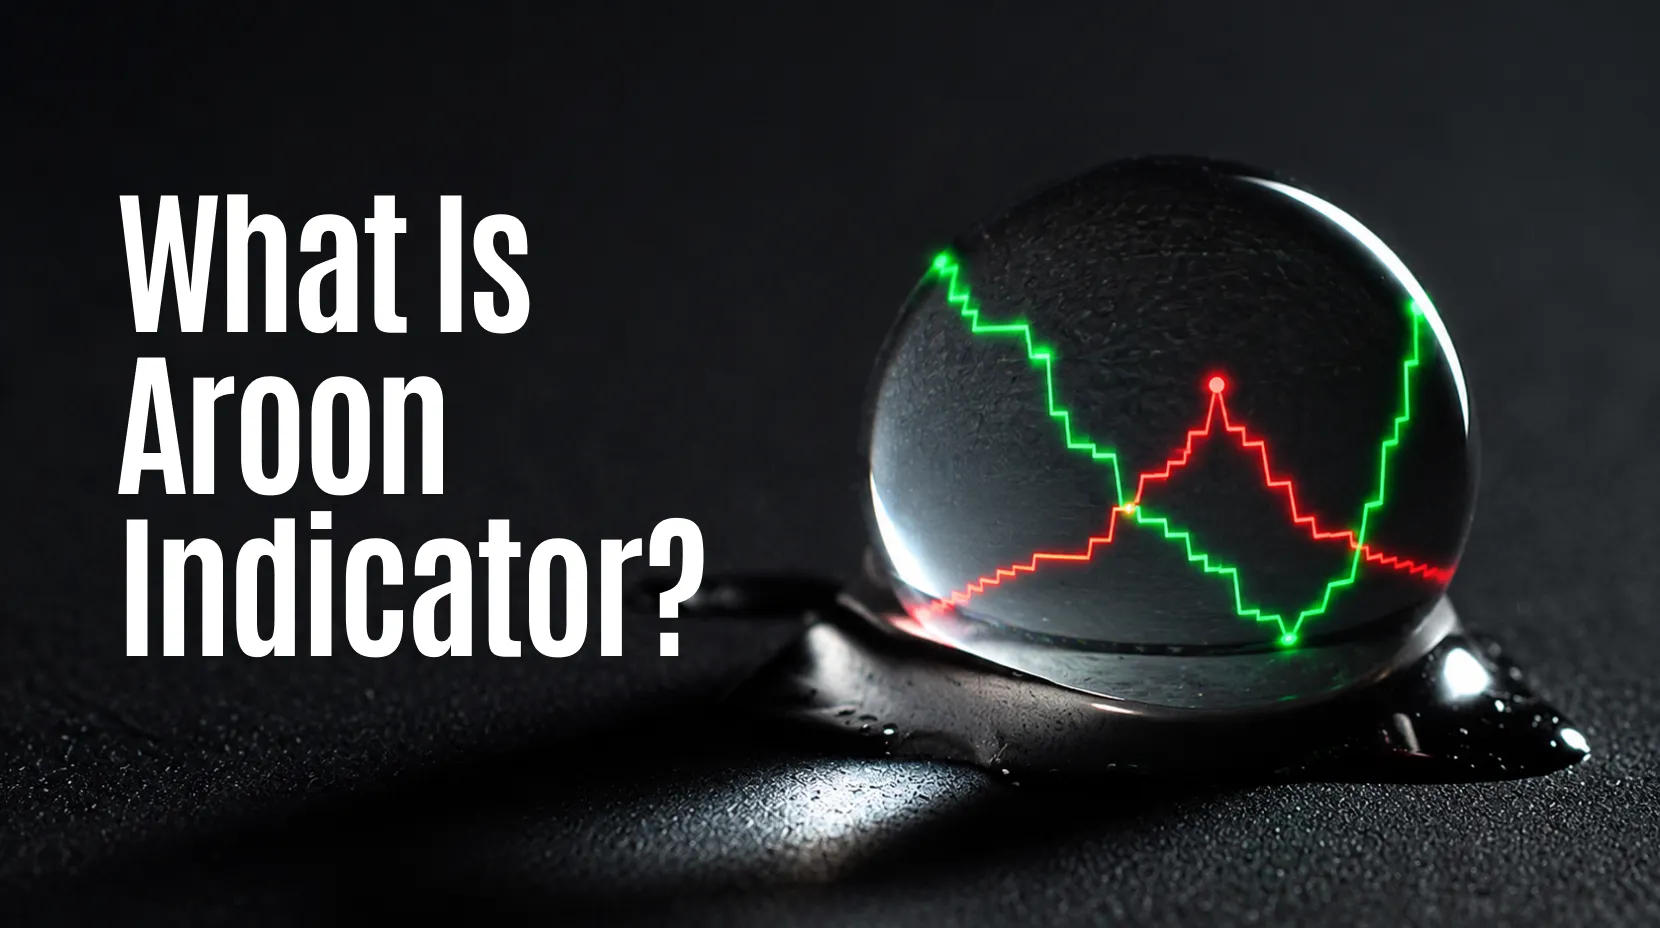
The Aroon indicator is a technical-analysis oscillator that measures how recently price recorded its highest high and lowest low within a selected period. Swing traders use Aroon Up and Aroon Down to identify emerging trend direction, evaluate changes in market control, and distinguish developing trends from sideways conditions.
2026-07-28 02:57:59
The ADX indicator measures the strength of a market trend on a scale from 0 to 100 without determining whether that trend is bullish or bearish. For swing traders and cryptocurrency traders, the Average Directional Index helps distinguish developing trends from sideways conditions, assess whether momentum is strengthening, and decide when trend-following signals deserve greater attention.
2026-07-28 02:54:31
EMA 20 is generally better for detecting short-term trend changes and active swing-trading setups, while EMA 50 provides a smoother view of the broader trend. In an EMA 20 vs. EMA 50 comparison, the more suitable indicator depends on whether the trader prioritizes responsiveness, trend stability, or confirmation across both time horizons.
2026-07-28 02:19:09