Judging whether Ethereum (ETH) is strong or weak versus Bitcoin (BTC) needs more than one order-book print. Treat the ETH/BTC ratio as a reviewable time series. The workflow builds on What is the ETH/BTC ratio: lock the definition and inputs before debating patterns.
Common mistakes include copying USD chart patterns onto the ratio unchanged, or treating one RSI extreme as a guaranteed reversal. A sturdier path is: chart → trend tools → momentum and levels → macro confirmation → stated invalidation rules.
Where Should ETH/BTC Analysis Start?
Start with a clean ETH/BTC history: an exchange ETH/BTC spot chart, or ratio views on TradingView, CoinMarketCap, or CoinGecko. Fix the timeframe (for example daily or weekly) before drawing conclusions across mixed horizons. ETH/BTC: What is it in an analysis stack? It is the Ethereum Bitcoin relative series you annotate—not a USD candle chart and not a converter widget’s headline tick.
Verify data conventions: live pair prints versus synthetic indexes, and whether quotes bounce through a stablecoin mid. Convention drift can make false breaks look real. Key data points for an Ethereum BTC Overview usually include ratio level, MA stack, Relative Strength Index readings, nearby support/resistance, Bitcoin dominance, and alt market-cap breadth. Rate-history and conversion-table pages can supply arithmetic checks (“what is the price of 1 ETH in BTC” as a definition exercise), but analysis should stay on the chart series you selected.
| Step |
Purpose |
Common tools |
| Chart |
Build an annotatable series |
Exchange charts, TradingView |
| Set timeframe |
Align the observation window |
Daily / weekly |
| Mark levels |
Record historical turn zones |
Horizontal S/R |
| Confirm |
Reduce single-indicator noise |
Dominance, alt caps, on-chain |
The table is the minimum loop: without a clean chart and shared timeframe, MA and RSI talk lacks a common premise. Compare with ETH/BTC on the same horizon when you pull Bitcoin vs Ethereum historical performance studies so relative leadership stories stay synchronized.
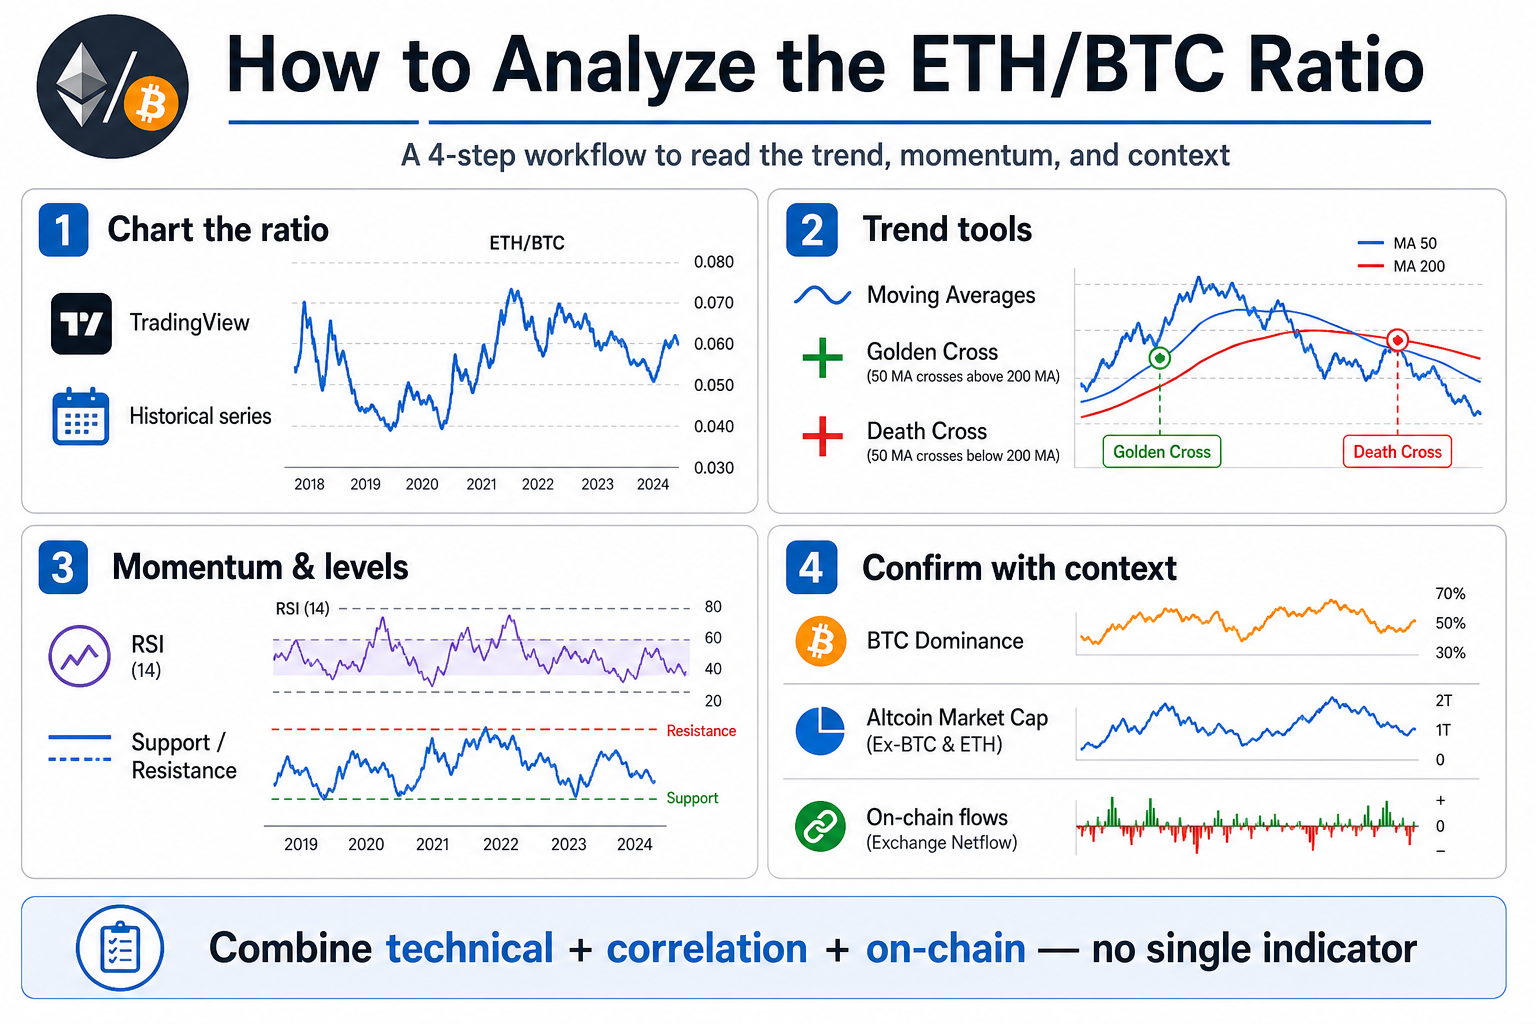
Figure 1. Four-step ETH/BTC analysis: chart → trend tools → momentum and levels → confirm with dominance, alt caps, and on-chain context.
How Do Moving Averages Help on ETH/BTC?
Moving averages (MAs) smooth ETH/BTC noise and describe relative trend direction. A shorter MA above a longer MA is often described as ETH relatively strong versus BTC; the reverse is relatively weak. On an ETH to BTC chart, the MA stack is a filter for the Ethereum Bitcoin series itself—not a filter copied blindly from ETH-USD.
A “golden cross” (for example the 50-day MA crossing above the 200-day) and a “death cross” can mark potential trend shifts, but both are lagging: by confirmation time, part of the move may already be done. Slope and price location versus the averages often matter more than a single cross event. Multi-year windows of Bitcoin vs Ethereum historical performance can show how often relative leadership flipped after such crosses; treat those windows as descriptive, not as average annualised return claims.
Trend tools answer whether relative strength direction looks stable—not how many points come next. Translating an MA cross into an order is overreach. Track whether the ratio holds above or below the longer average after the cross before you write a firmer relative-strength note.
How Do RSI and Support/Resistance Help?
Relative Strength Index (RSI) on ETH/BTC measures overbought or oversold conditions of the ratio itself, not ETH-USD RSI. Traditional bands near 70 and 30 are common reference points and can be adjusted by timeframe; they are not laws. Saying “Relative strength index” in plain language: it compresses the speed and size of ratio advances or declines into a bounded oscillator so you can see stretched conditions carefully.
Support and resistance come from zones where the ratio repeatedly stalled or reversed, plus pattern boundaries (flags, double tops, head-and-shoulders). Pattern reading is subjective and improves when volume or time-at-level context is included. Conversion rates and “how much ETH can I buy for 1 BTC” style FAQs describe inventory math; they do not locate chart levels. Keep Ethereum to Bitcoin FAQs about definition separate from level-drawing work.
Momentum and levels supply positioning context. When trend tools set direction, RSI and levels mainly help set expectations and invalidation—not solo triggers. A higher RSI with a still-rising MA stack is a different story from a higher RSI against a broken long-term average; represent both cases as context, not as forced mean-reversion orders.
How Do Bitcoin Dominance and Alt Market Cap Confirm?
Bitcoin dominance is BTC’s share of total crypto market capitalization. ETH/BTC rising while dominance falls and alt market cap expands is often read as risk appetite spreading beyond BTC. ETH/BTC rising while dominance still climbs and alt caps stall looks more ETH-specific.
Confirmation reduces “false altseason” misreads: ETH/BTC alone can overstate breadth. Dominance shifts alone also do not force ETH/BTC to follow.
Align three series when possible: ETH/BTC, Bitcoin dominance, and alt total market cap (or TOTAL2/TOTAL3-style indexes, depending on the data vendor). Agreement strengthens the narrative; disagreement argues for humility rather than forced storytelling. Ethereum to Bitcoin data pulled from converter pages should not override those three charted series when they conflict on direction.
What Can On-Chain and Flow Metrics Add?
On-chain clues can hint at chip movement: rising ETH net deposits to centralized exchanges (CEXs) are sometimes discussed alongside selling pressure and softer ETH/BTC; hotter DeFi activity and elevated fees are sometimes discussed alongside ETH relative demand. These are weak, noisy links distorted by bridges, arb, and hedges.
Stablecoin liquidity, futures funding, and open interest can warp short-horizon spot ratios. Treating derivatives prints as spot relative strength mixes different pricing venues.
Use flows as a fourth confirmation layer after chart trend and macro context agree—or as a reason to pause when they clash hard. They do not replace independent book, fee, and slippage checks.
What Mistakes Are Common When Analyzing ETH/BTC?
Frequent mistakes include migrating USD patterns onto the ratio unchanged; mixing timeframes; treating RSI extremes as guaranteed reversals; ignoring fees and slippage on the tradable ratio; and using one historical analogy to “call” the next altseason. Another mistake is treating ETH to BTC converter pages, headline news modules, or promotional sidebars as if they were the analysis chart—those surfaces mix education with marketing chrome.
Overfitting is another trap: stacking indicators until the past story looks perfect, then failing on new samples. A more robust habit is to pre-write the main trend rule, confirmation conditions, and what invalidates the framework. Asset allocation is hard when ETH/BTC, dominance, and USD legs disagree; pause rather than invent a single story that forces agreement.
Educational analysis favors reviewability and falsifiability over short-term accuracy myths. Any backtest depends on sample window and fee assumptions and cannot be extrapolated as future returns. Other glossary terms—ETH-BTC, ETHBTC, Ethereum Bitcoin cross—should map back to the same relative series so naming noise does not create fake signals.
Conclusion
Analyze the ETH/BTC ratio in order: chart and fix timeframe, read relative trend with MAs, locate position with RSI and levels, then confirm with dominance, alt market cap, and selective on-chain context—while listing failure modes. The framework explains relative strength between Ethereum and Bitcoin; it is not trading advice. Keep key data points documented so the next review can track the same checklist.
FAQ
What is the first step in analyzing ETH/BTC?
Choose a data source, plot ETH/BTC as its own chart, and lock timeframe plus quote convention. Without a shared horizon and clean series, MA, RSI, and pattern claims cannot be compared. Exchange ETH/BTC spot charts or TradingView are common starting points. Select one Ethereum to BTC chart and stick with it for the session so conversion-table snapshots do not replace the series.
Is ETH/BTC RSI the same as ETH-USD RSI?
No. RSI on ETH/BTC measures the ratio series; RSI on ETH-USD measures Ethereum’s dollar momentum. They can agree or diverge. Confirm which chart the indicator is attached to before interpreting. Relative strength index settings should match the timeframe you already chose for moving averages.
Why check Bitcoin dominance as well?
Bitcoin dominance helps tell whether ETH/BTC strength is spreading into broader alts or staying ETH-specific. Falling dominance with expanding alt caps makes a diffusion narrative more coherent; ratio-only strength deserves caution. Dominance itself is not a trade signal. Compare with ETH/BTC side by side so “ETH strength” and “BTC share of total cap” stay distinct key data points.
Does a golden cross mean buy ETH?
A golden cross is a lagging trend description: a shorter MA crossing above a longer MA, often used to discuss ETH relative strength versus BTC. It is not a buy or sell instruction and does not guarantee outcomes. Pair it with confirmation, liquidity checks, and personal risk limits. Historical performance of past crosses across years is descriptive context, not a license for sized orders.
Can on-chain metrics alone decide ETH/BTC direction?
No. Exchange flows, DeFi activity, and fees are noisy and often distorted by arb, bridges, and hedges. They work better as supplemental confirmation after chart trend and macro context—not as a standalone compass. Guide any operational next step with book depth and fees on the venue you actually use.