Square
Following
Hot
News
Notifications
Profile
Share your thoughts
placeholder
Article
I've joined #WCTCS9. Click the link to join my team and share the 136,000 USDT total prize pool with me. Fight for honor!
https://www.gate.com/zh/competition/wctc-s9?page=teamCompetition&teamId=77385&ref_type=165&utm_cmp=tgv0wayw&ref=ZHANGYIZ
Apparently, this is the fifth-generation housing currently being piloted in China.
Trenches
ZIG
Z
bade
b
ZIG
0x8c...1145
Market Cap
$.
Change
.
24h Vol
$.
Holders
.
STONK
S
bade
b
STONK
6GmA...UNgx
Market Cap
$.
Change
.
24h Vol
$.
Holders
.
IDOL
I
bade
b
IDOL
0x3b...ab07
Market Cap
$.
Change
.
24h Vol
$.
Holders
.
BTC
B
bade
b
BTC
C5xp...pump
Market Cap
$.
Change
.
24h Vol
$.
Holders
.
FLOAT
F
bade
b
FLOAT
Bv1a...BMmr
Market Cap
$.
Change
.
24h Vol
$.
Holders
.
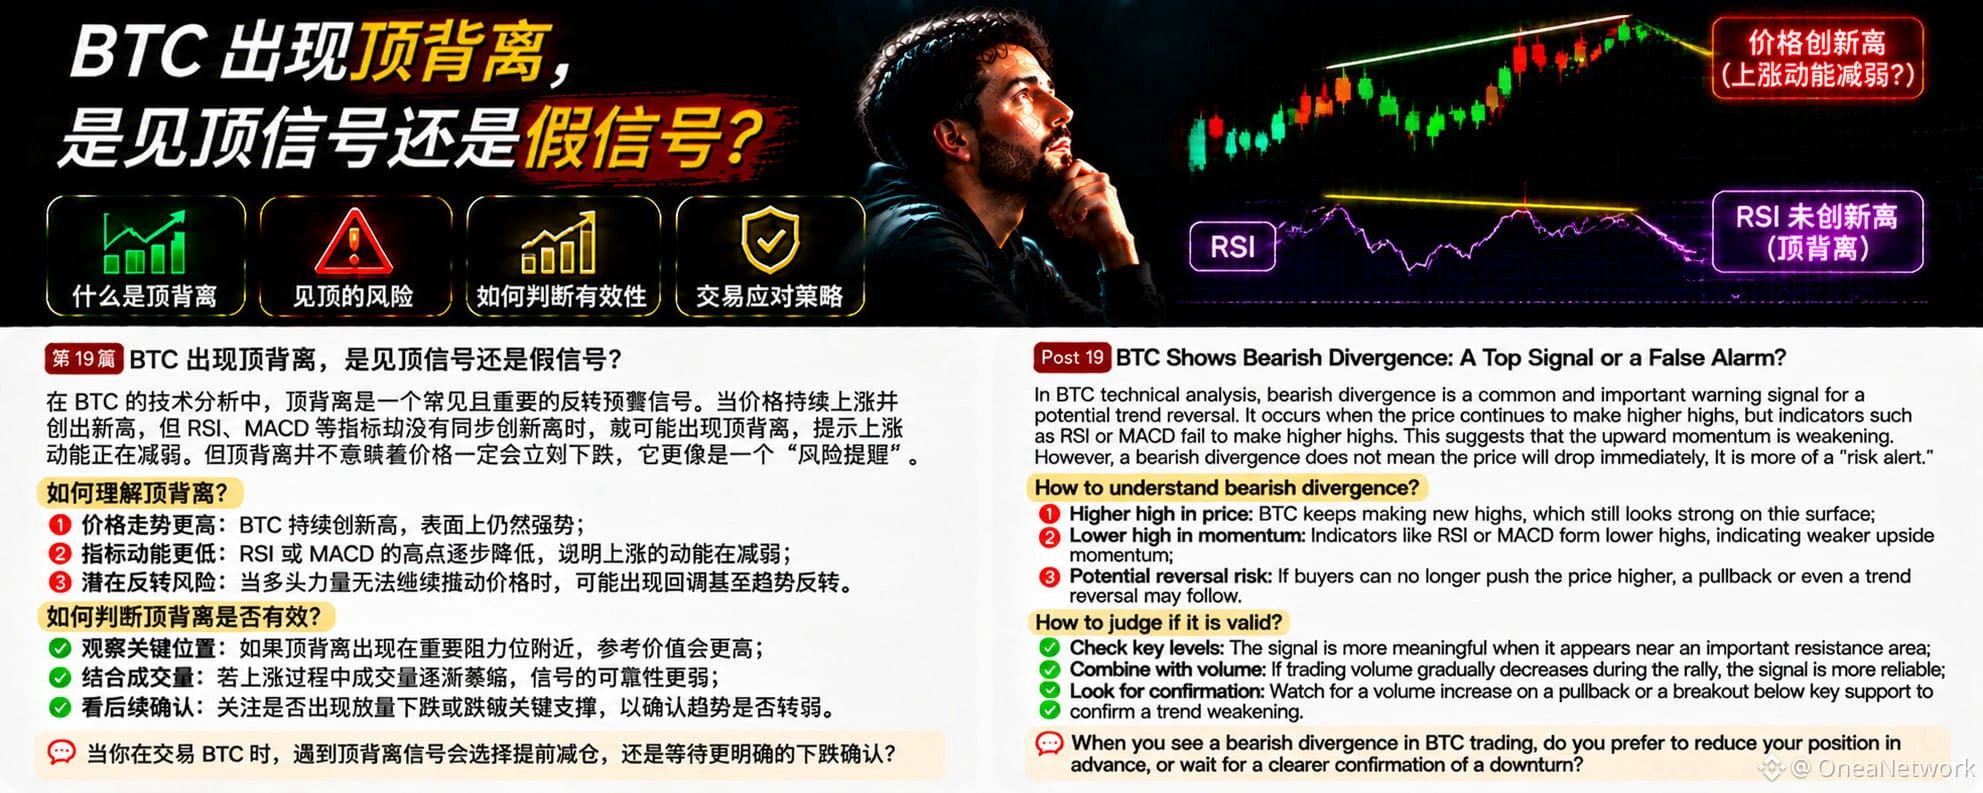
In BTC technical analysis, bearish divergence is a risk warning signal worth watching. Many traders see prices continually making new highs and assume the uptrend remains strong. But if prices continue to rise while indicators such as RSI or MACD fail to make new highs, bearish divergence may occur.
What is bearish divergence?
Simply put, it is when the price makes a higher high, but the technical indicator forms a lower high. This suggests that although the price is still rising, the momentum driving the rise may be weakening.
Why is bearish divergence worth watching?
First, upward momentum m
post-image
BTC-0.67%
$ETH

Are the US and Iran about to start fighting again?

Trouble flares up again in the Strait of Hormuz

Where will global capital flee this time?

Holy crap

Guys

The market had just caught its breath

And the Middle East is at it again

Tensions between the US and Iran have been rising again recently

November 6

The US carried out a new round of limited strikes on military targets near the Strait of Hormuz in Iran

Trump said

The US military had destroyed Iran’s newly built air defense system

Iran had also repeatedly warned

That if the US continued its attacks

It would retaliate aga
post-image
ETH-1.23%
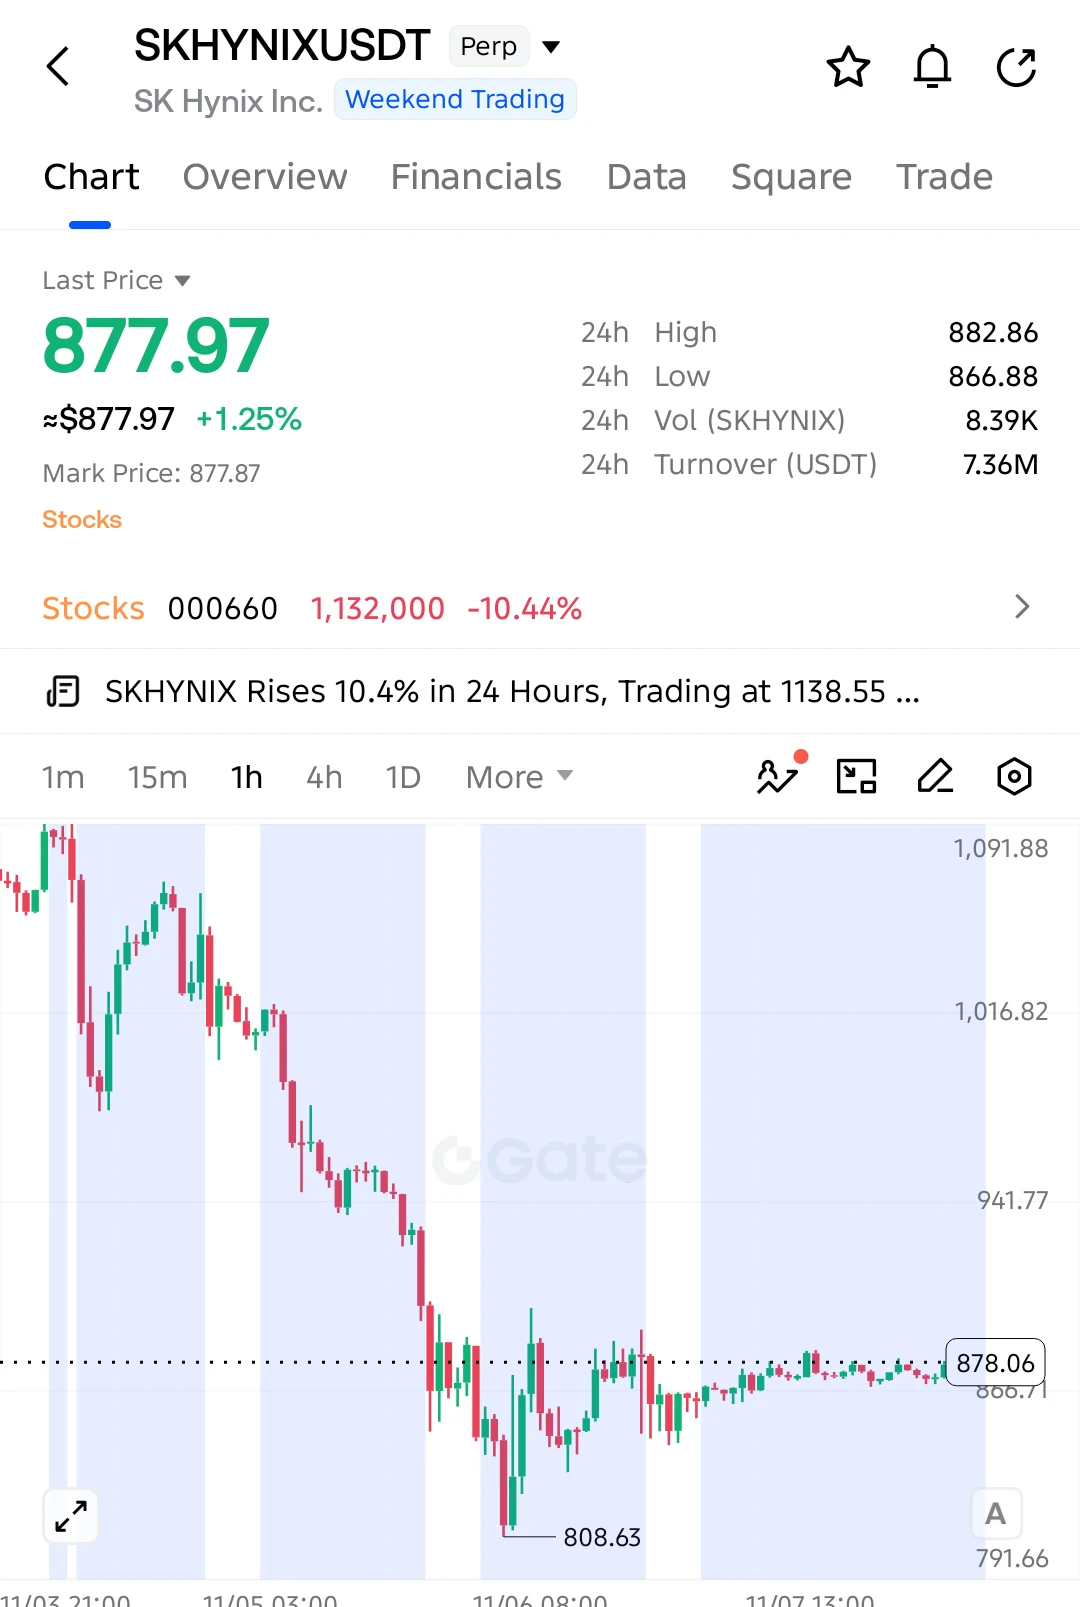
$SKHYNIX LONG SETUP — BIG RECOVERY AHEAD?

$SKHYNIX is showing signs of stabilization after a massive sell-off. Buyers are defending the 866 support area, with a potential recovery developing!

Entry: 877.97
SL: 865.00

TP1: 892.50
TP2: 905.00
TP3: 920.00
Final Target: 938.86

Selling pressure has eased as price consolidates near 878. Buyers are gradually rebuilding strength, and a breakout above 882.86 could open the door toward 905 and higher.

Invalidation: A sustained break below 865.00 weakens the bullish setup.

Keep your eyes on $SKHYNIX!
post-image
SKHYNIX+1.41%
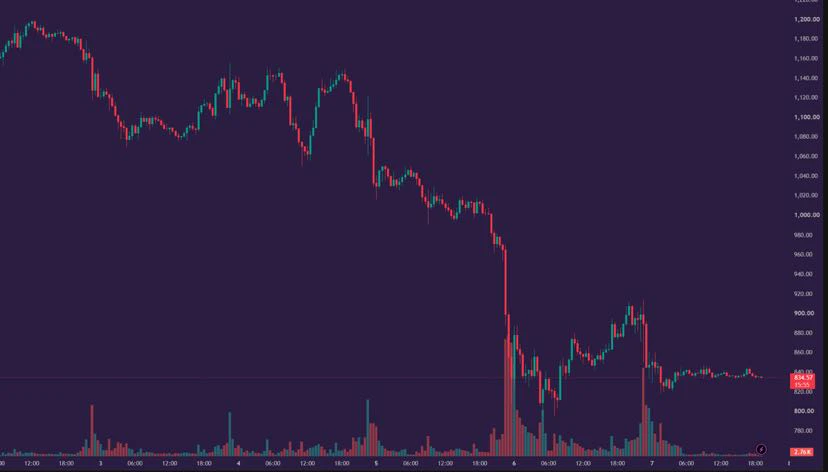
The storage sector has had what could be called a disastrous week😥

$SNDK fell from around 1170 at the start of the week to 835, hitting a weekly low of 794 and ending down nearly 29%

Keep in mind, this was one of the storage leaders the market had been most bullish on...

Thursday saw an especially dramatic wave of selling. After the Democrats won the midterm elections, the market began to worry that data center construction in the U.S. would face stricter regulation, and the entire AI supply chain was hit by valuation de-rating

SanDisk, Micron, and SK hynix were all caught up in the sell
post-image
SNDK-0.18%
[New Streamer] 🔹 Former FBI Agent Admits Stealing $2.47 Million in Cryptocurrency, Faces Up to 20 Y
live-cover
LIVE761
#USAIStocksHitHard

US AI Stocks Hit Hard: What Triggered the Sell-Off and What Investors Should Understand

The Myth: A Strong AI Industry Means AI Stocks Cannot Fall

Many investors believe that companies building artificial intelligence will continue rising as long as AI technology keeps improving. That is a dangerous assumption. A company can have excellent technology, growing demand and strong long-term potential while its stock price still falls sharply.

That is exactly the lesson emerging from the recent sell-off in U.S. AI stocks. The market is not suddenly rejecting artificial intel
post-image
AMD+11.55%
$ZEC Current price: 1244.52, 24H -7.99% (1236.65–1355.98). Weak on the 1H: RSI 28.06, EMA20 1271.33, volume ratio 0.52; weak on the 4H: RSI 49.23, EMA20 1280.54, support at 1183.38/resistance at 1387.89. A sustained move above the 1350.85 resistance level is meaningful; a break below the 1236.65 support level would signal further weakness. Review whether price holds above 1350.85 and recovers after losing 1236.65. Volume is only 0.52x; the setup is invalidated if volume is insufficient or price fails to recover. Market volatility is high; for observation only.
post-image
ZEC+1.16%
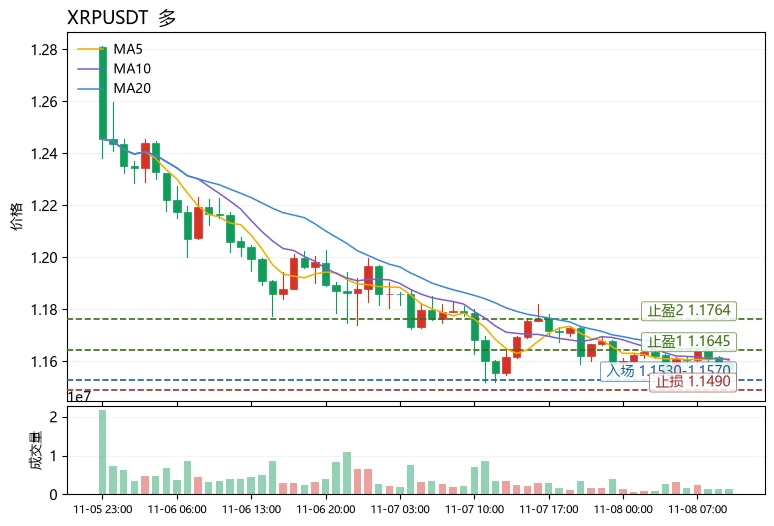
$XRP Current price: 1.1565. Resistance above is at 1.1645 (MA20) and 1.1764 (upper Bollinger Band), with support below at 1.1526 (lower Bollinger Band). The price is below MA5 (1.1604) and MA20 but above the lower Bollinger Band, forming a weak consolidation structure; bulls have yet to reclaim the medium-term moving average.
Technical breakdown: MA5 is below MA20, with the short-term moving average still capping rebounds. However, the MACD histogram is positive (+0.001018), indicating an early recovery phase as momentum shifts from bearish to bullish. RSI at 37.8 is approaching the weak zone
post-image
eur
eureur
Gate.Fun
MC:$5.55KHolders:3
0.06%
XRP-1.15%
ADA-1.48%
$IRON may come tomorrow
IRON-0.01%
$CLAUDIA One quote tweet pushed it back to a 7 million market cap, $JOSE and riding the same person's meme sent it soaring to 1.8 million. That's the entire logic of meme coins: money goes wherever the attention is. Don't ask why. Before the halving, while the market is trading sideways, we'll see even more of this kind of thing. Decide for yourself whether to follow along. What do you think? $BTC If you're watching, follow along.
post-image
MEME-0.94%
BTC-0.67%
𝗘𝗧𝗛𝗘𝗥𝗘𝗨𝗠 ⚡ | 𝗣𝗥𝗜𝗖𝗘 𝗦𝗧𝗔𝗕𝗜𝗟𝗜𝗭𝗘𝗦 𝗡𝗘𝗔𝗥 $𝟮,𝟮𝟯𝟳

💰 Price: $2,236.92
₿ BTC Value: 0.02953 BTC

📊 Market Performance

- 1H Change: +0.24%
- 24H Change: +0.07%
- 7D Change: -0.70%

🏦 Market Cap: $273.34B
📈 24H Volume: $3.89B

Supply Details

- Circulating Supply: 122.19M ETH
- Total Supply: 122.19M ETH

Ethereum is showing slight positive movement over the past 24 hours, but its weekly performance remains marginally negative.

Trading activity remains important to watch. $ETH needs stronger buying momentum to establish a clearer recovery trend.

For now, the market i
post-image
ETH-0.91%
A brief analysis of BTC short-term trends from Dow Theory, Chan Theory, Elliott Wave Theory, volume-price relationships, order flow, and price action (strategy recommendations)
Comprehensive assessment
Dow Theory confirms that the break below 75,000 has accelerated the bearish trend + volume is contracting as the market consolidates
Chan Theory: Each stroke makes a new low; the 75,460 potential bottom fractal is unreliable due to low volume
Elliott Wave Theory: Subwave ③ of Wave C's fifth wave is nearly complete (74,791 is just 31 points above the 1.0× target); a subwave ④ rebound could begin
BTC-0.67%
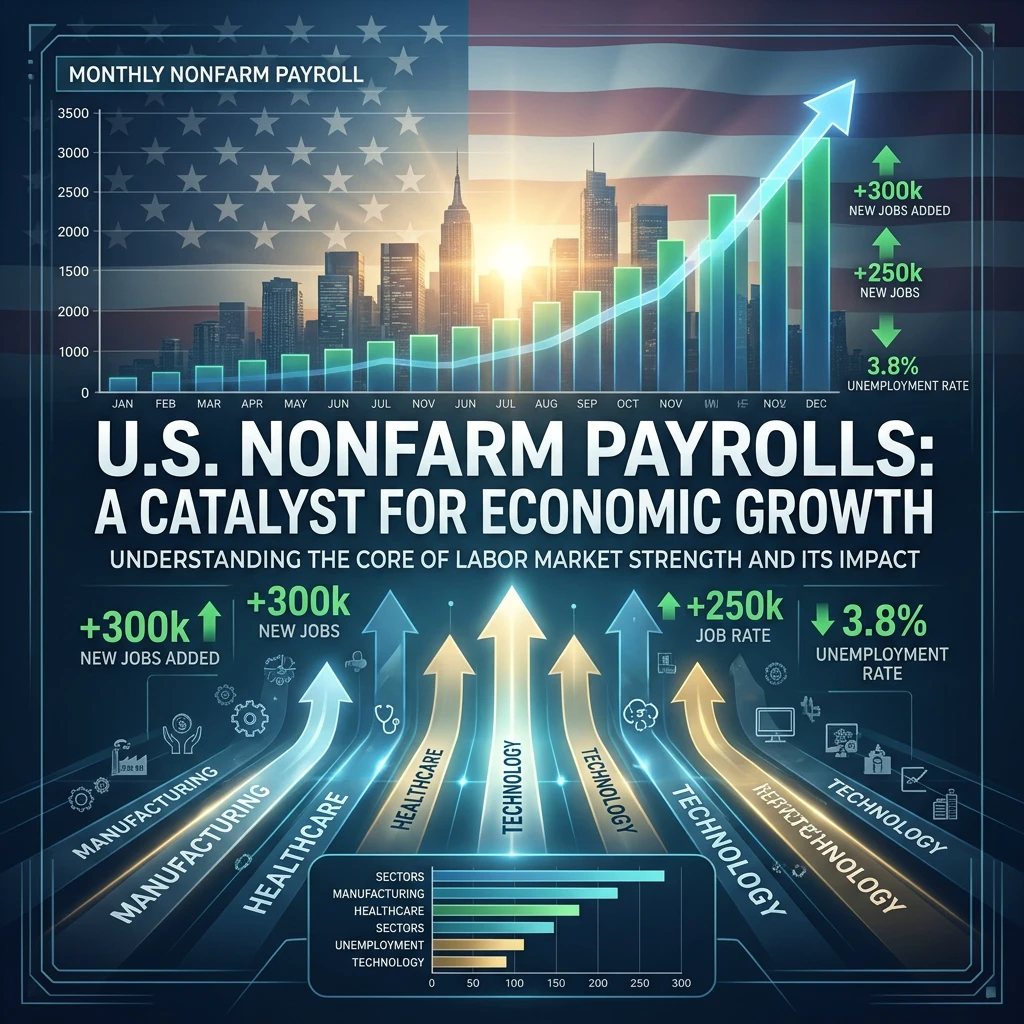
#USNonfarmPayrolls

US Jobs Deliver a Surprise Recovery: What October Payrolls Reveal About the Economy

A Sharp Change in Direction

A month ago, the US labour market appeared to be losing momentum. September added just 29,000 jobs, raising concerns about weaker hiring and a possible slowdown in the economy. Now the picture looks different. October brought a much stronger increase of 165,000 jobs, showing that employers added workers at a faster pace than recent months suggested.

This change is important because the US jobs report is one of the most closely watched economic releases. It hel
post-image
BTC-0.67%
Will This Week’s CPI Data Bring a Reversal?❓
This Week’s (11.9–11.15) Major Web3 Events⭐️
November 9
Release date moved to November 9, allowing Polymarket Protocol V2 to avoid U.S. midterm election week;
Hyperliquid L2 network Elysium to launch on November 9;
Uniswap confirms V4 Hooks support on Elysium, with mainnet expected to launch on November 9
Mercado Bitcoin: Platform to resume in phases on November 9, with compensation paid from its own funds
November 10
U.S. October CPI to be released on November 10 at 21:30;
Bitcoin payment acceptance expands to more than 4 million merchants, with Sq
post-image
HYPE+0.24%
UNI+3.05%
BTC-0.67%
MSCI-2.25%
BLUR-5.93%
  • 2
$PI On the daily chart, every decline in Pi coin comes with high volume, while every rise comes with low volume. High volume means heavy trading, so a high-volume decline means selling pressure exceeds buying pressure, causing the price to fall. Low volume means trading is subdued, with few people buying and few selling. But on the daily chart, even when the price rises, each candlestick is a very small bullish candle, indicating that buying volume is low. For a sustained uptrend, volume must increase on rises and decrease on declines.
post-image
PI-0.60%
  • 4
Sony China unveiled its in-vehicle passenger motion sickness detection technology globally at the 9th China International Import Expo: AI analyzes both the road ahead and content on rear-seat screens to predict passengers’ motion sickness levels, and can account for individual sensitivity. The assessment can prompt drivers to avoid sudden braking and sharp turns, and help content platforms recommend content with less visual movement. The system reuses the vehicle’s existing forward-facing ADAS camera, so no additional rear-seat camera is needed.

This isn’t about giving passengers medication;
post-image
SONY-1.99%
BTC-0.67%
New streamer bts market
live-cover
LIVE1,017
Load More

Join 40 M users in our growing community

⚡️ Join 40 M users in the crypto craze discussion

💬 Engage with your favorite top creators

👍 See what interests you

Trending Topics

USCPIDataIncoming

1.04k Views1.48k Discussing

The U.S. October CPI report will be released on November 10 at 8:30 a.m. ET. September CPI came in at 3.7% year over year, and markets will be watching closely for signs that inflation is cooling, especially in core CPI. A softer-than-expected reading could strengthen rate-cut expectations, while hotter inflation may pressure risk assets through higher Treasury yields and a stronger dollar. How do you think this CPI print will move $BTC, U.S. stocks and gold?

USAIStocksHitHard

23.56k Views3.69k Discussing

USNonfarmPayrolls

40.34k Views4.38k Discussing

View More