This comprehensive guide empowers cryptocurrency traders to master bullish candlestick patterns essential for trading success on Gate and other platforms. The article explains candlestick fundamentals—including the four key price elements (open, close, high, low) and color-coding system—before exploring eight critical patterns: Hammer, Inverted Hammer, Bullish Engulfing, Morning Star, and Piercing Line for bullish signals, alongside bearish counterparts. Readers will learn to identify trend reversals, support and resistance levels, and entry-exit points by analyzing candlestick formations and their market psychology. The guide emphasizes combining patterns with technical indicators like RSI and Moving Averages to filter false signals and improve decision-making. Perfect for both beginners and experienced traders seeking to enhance their technical analysis skills and develop robust trading strategies with proper risk management.
What is a Candlestick Chart?
A candlestick chart is one of the fundamental tools in cryptocurrency trading, providing a visual representation of price movements that helps investors make informed decisions. Beyond spot trading, candlestick formations enable traders to predict price trends of assets like Bitcoin by analyzing market sentiment and momentum. This comprehensive guide explores what candlestick patterns are, how to read them, and the eight most important bullish and bearish formations essential for effective crypto trading on leading platforms.
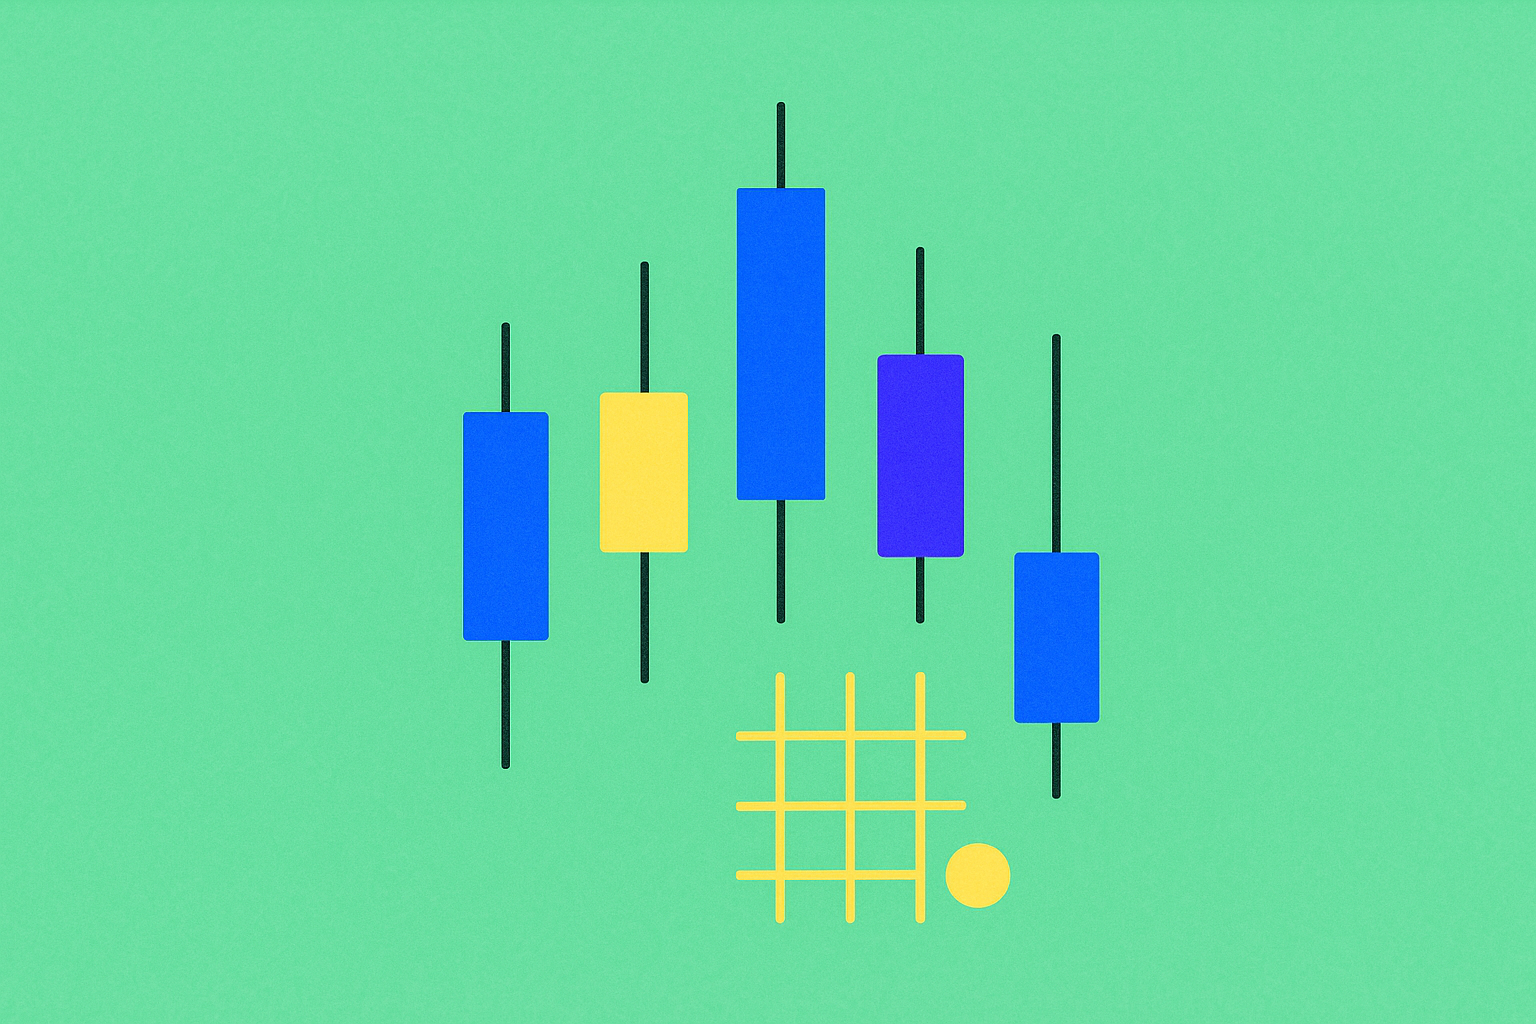
Each candlestick represents the price movement of an asset over a specific time period, which can be customized according to the investor's strategy (for example, 1 minute, 1 hour, daily, or monthly intervals). Every candlestick displays four key elements:
- Open: The asset's price at the beginning of the time period
- Close: The asset's price at the end of the time period
- High: The highest price reached during the time period
- Low: The lowest price observed during the time period
The candlestick body shows the difference between the opening and closing prices, while wicks (or shadows) extend above and below to indicate the high and low levels. Candlesticks are typically color-coded:
- Green: Closing price is higher than opening; indicates price increase
- Red: Closing price is lower than opening; signifies price decrease
For example, in a 5-minute green candle for BTC, if the opening is $60,000 and closing is $60,500, the candle body displays this upward movement. If the high reached $60,700 and the low touched $59,800, the upper wick extends to $60,700 while the lower wick reaches down to $59,800.
Why Use Candlestick Charts?
Developed by Japanese rice traders in the 18th century, candlestick charts have become an indispensable tool for modern investors. These charts offer significant advantages over simple line graphs by visually reflecting price movements and market psychology. By analyzing multiple candlesticks, investors can identify potential price reversals or continuation patterns, which facilitates critical trading decisions on major crypto platforms.
The visual nature of candlestick charts makes them particularly valuable for understanding not just where prices have been, but also the underlying market dynamics. The size of the body, the length of the wicks, and the color all convey important information about the balance of power between buyers and sellers during that time period. This rich information density makes candlestick charts superior to other charting methods for technical analysis.
How to Read Candlestick Patterns?
Candlestick patterns form over time and indicate trends, reversals, or indecision in the market. While a single candle provides clues about price action within its own time frame, multiple candles create larger formations that reveal the direction of the trend. Understanding these patterns requires recognizing the story they tell about market psychology.
For example:
- A green candle with a long upper wick indicates that buyers pushed the price higher but encountered resistance, causing the price to close below its peak level. This suggests that while bullish momentum exists, sellers are defending higher price levels.
- A red candle with a long lower wick implies that sellers drove the price down but buyers stepped in to prevent a lower close, showing that support exists at lower levels and buyers are willing to defend those prices.
Candlestick patterns may appear complex initially; however, with regular analysis, especially when combined with other technical indicators, their predictive power becomes clear. The key is to understand not just the individual candles, but how they relate to each other and the broader market context.
8 Essential Candlestick Patterns for Crypto Trading
Candlestick patterns are classified as bullish (signaling price increase) and bearish (signaling price decrease). Understanding these patterns is crucial for identifying potential entry and exit points in your trading strategy.
Bullish Candlestick Patterns
Hammer
Appearance: Forms at the bottom of a downtrend, featuring a small body (green or red) at the top with a long lower wick and little to no upper wick.
Meaning: Indicates strong buyer interest following selling pressure and signals a potential reversal. For example, if BTC drops to $58,000 but closes at $59,000 with a long lower wick, it demonstrates that buyers have started to dominate the market, heralding a possible upward move. The long lower wick shows that despite sellers pushing prices down significantly, buyers were strong enough to push prices back up near the opening level.
Signal: Potential price increase or trend reversal, particularly when confirmed by subsequent bullish candles or other technical indicators.
Appearance: Forms at the bottom of a downtrend, characterized by a small body (green or red) with a long upper wick and almost no lower wick.
Meaning: Buyers attempted to push the price higher but sellers showed resistance. If followed by a green candle, it confirms that an uptrend may be beginning. This pattern suggests that buyers are testing higher prices, and if they succeed in the next period, a reversal is likely. The inverted hammer is particularly significant when it appears after an extended downtrend, as it shows the first signs of buyer strength.
Signal: Beginning of a bullish trend, especially when volume increases on the confirmation candle.
Bullish Engulfing
Appearance: At the end of a downtrend, consists of a small red candle followed by a larger green candle that completely engulfs the previous candle's body. There may be a small gap between them (rare in crypto markets).
Meaning: Strong buying pressure overwhelms sellers and market sentiment turns positive. For instance, if BTC's red candle closes at $60,000, followed by a green candle opening at $59,800 and closing at $61,000, buyers are completely in control. This pattern is one of the most reliable bullish reversal signals because it shows a definitive shift in market dynamics. The larger the engulfing candle relative to the previous candle, the stronger the signal.
Signal: Strong bullish reversal, often marking the beginning of a significant uptrend.
Morning Star
Appearance: Forms at the end of a downtrend with a three-candle structure: a long red candle, a short-bodied "star" candle (with long wicks, closing lower than the first candle), followed by a long green candle (closing above the midpoint of the first candle's body).
Meaning: Shows that selling pressure is diminishing, after which buyers take control and an uptrend begins. The middle "star" candle represents indecision and a balance point between buyers and sellers. The third candle's strong close confirms that buyers have won this battle. This three-stage pattern provides more reliability than single-candle patterns because it shows the complete transition from bearish to bullish sentiment.
Signal: Bullish reversal formation, particularly powerful when the third candle closes well into the first candle's body.
Piercing Line
Appearance: At the end of a downtrend, a long red candle is followed by a long green candle that closes above the midpoint of the red candle's body. There may be a gap between the two candles.
Meaning: In a session that started with selling, buyers enter with strong response and demonstrate interest in current price levels. The piercing line shows that buyers not only stopped the decline but pushed prices significantly higher, recovering more than half of the previous session's losses. This aggressive buying behavior often indicates that a bottom has been found.
Signal: Bullish reversal with strong buying interest, though slightly less powerful than a bullish engulfing pattern.
Bearish Candlestick Patterns
Hanging Man
Appearance: Forms at the peak of an uptrend, featuring a small body (green or red) with a long lower wick and almost no upper wick.
Meaning: Indicates intensifying selling pressure and weakening bullish momentum. For example, when BTC price peaks at $62,000 and closes at $61,500 with a long lower wick, sellers are taking control. Despite the candle potentially closing green, the long lower wick reveals that significant selling occurred during the period, suggesting that buyers are losing their grip on the market.
Signal: Potential selling or beginning of a decline, especially when confirmed by subsequent bearish candles.
Shooting Star
Appearance: Forms at the peak of an uptrend, characterized by a small body (green or red) with a long upper wick and almost no lower wick.
Meaning: Although buyers pushed the price higher, sharp rejection and closing near the opening signals a reversal. The shooting star demonstrates that buyers attempted to continue the rally but were met with strong resistance from sellers. The long upper wick shows that the higher prices were decisively rejected, indicating that the uptrend may be exhausted.
Signal: Bearish reversal following a price rally, particularly significant at resistance levels.
Bearish Engulfing
Appearance: At the top of an uptrend, a small green candle is followed by a large red candle that completely engulfs the previous candle's body. There may be a gap between them.
Meaning: Strong selling pressure dominates the market and sentiment turns negative. For instance, if BTC's green candle closes at $62,000, followed by a red candle opening at $62,200 and closing at $61,000, sellers are dominant. This pattern is particularly powerful because it shows that sellers not only absorbed all the buying from the previous period but pushed prices significantly lower, completely reversing the prior gains.
Signal: Beginning of a downtrend, often marking a significant market top.
Combining Candlestick Patterns with Other Indicators
While candlestick patterns are powerful on their own, they become significantly more effective when used in conjunction with other technical indicators such as the Relative Strength Index (RSI), Moving Averages, or Bollinger Bands. This multi-indicator approach helps filter out false signals and increases the probability of successful trades.
For example, a Bullish Engulfing pattern combined with RSI below 30 (oversold territory) provides a strong signal for an upward move. The candlestick pattern shows the immediate shift in sentiment, while the RSI confirms that the asset was oversold and due for a bounce. Similarly, a Shooting Star appearing at a resistance level identified by Moving Averages carries more weight than one appearing in the middle of a trading range.
Experienced traders use multiple confirmations to reduce false signals and improve their decision-making process. They might wait for:
- Volume confirmation (higher volume on reversal candles)
- Support/resistance level alignment
- Trend line breaks or bounces
- Multiple timeframe confirmation
This comprehensive approach to technical analysis significantly improves trading outcomes and risk management.
Conclusion
Candlestick patterns are indispensable tools for cryptocurrency investors, offering crucial insights into market sentiment and potential price movements. Mastering these formations can enhance your trading strategy on leading crypto platforms; however, success requires experience and attention to detail. By confirming your signals with other technical indicators, you can conduct stronger analysis and should always exercise responsible trading practices.
Remember that no single pattern or indicator guarantees success in trading. The key is to develop a comprehensive trading strategy that incorporates candlestick pattern recognition, technical analysis, risk management, and continuous learning. As you gain experience reading these patterns in real market conditions, your ability to interpret them accurately and make profitable trading decisions will improve significantly. Always practice with small positions initially and never risk more than you can afford to lose.
FAQ
What is a candlestick chart (K-line chart) and how is it used in cryptocurrency trading?
A candlestick chart displays cryptocurrency price movements within specific time periods, showing opening, closing, highest, and lowest prices. Traders use candlestick patterns to identify market trends, recognize support and resistance levels, and make informed trading decisions based on price action and volume.
What are common candlestick patterns and how to identify bullish and bearish signals?
Common patterns include Hammer, Engulfing, and Doji. Hammer signals potential reversal with long lower wick. Bullish Engulfing shows strong upward momentum when larger green candle completely covers prior red candle. Bearish patterns appear when opposite occurs, indicating downward pressure and potential reversal downtrend.
How to formulate trading strategies and risk management plans using candlestick patterns?
Identify candlestick patterns like engulfing formations to recognize trend reversals. Use technical analysis to determine entry and exit points. Combine pattern signals with support/resistance levels. Set stop-loss orders based on pattern confirmation to manage risk effectively.
What market signals do hammer lines, engulfing patterns, and doji stars represent respectively?
Hammer lines signal potential upward reversal at downtrends end. Engulfing patterns show one force overwhelming another, indicating trend changes. Doji stars indicate balanced supply-demand, suggesting potential price direction shifts.
What are the limitations of candlestick analysis and how should it be combined with other indicators?
Candlestick analysis has time lag issues and cannot display accurate open and close prices. Combine it with moving averages, RSI, and volume analysis for more accurate trend identification and trading signals.
How should beginners learn and practice candlestick pattern recognition skills?
Start by studying basic patterns like doji and double bottoms. Practice identifying these patterns on demo accounts first. Consistently observe live market trends to gradually improve accuracy and build confidence in pattern recognition.
* The information is not intended to be and does not constitute financial advice or any other recommendation of any sort offered or endorsed by Gate.