The cryptocurrency market in 2025 is more active than ever, driven by institutional adoption, technical upgrades of trading platforms, and increased public participation. As the market matures, technical analysis (TA) has become one of the core tools for cryptocurrency traders to maintain competitiveness. This article will analyze the most popular technical trading strategies in 2025, helping you accurately control the buying and selling rhythm in the cryptocurrency market.
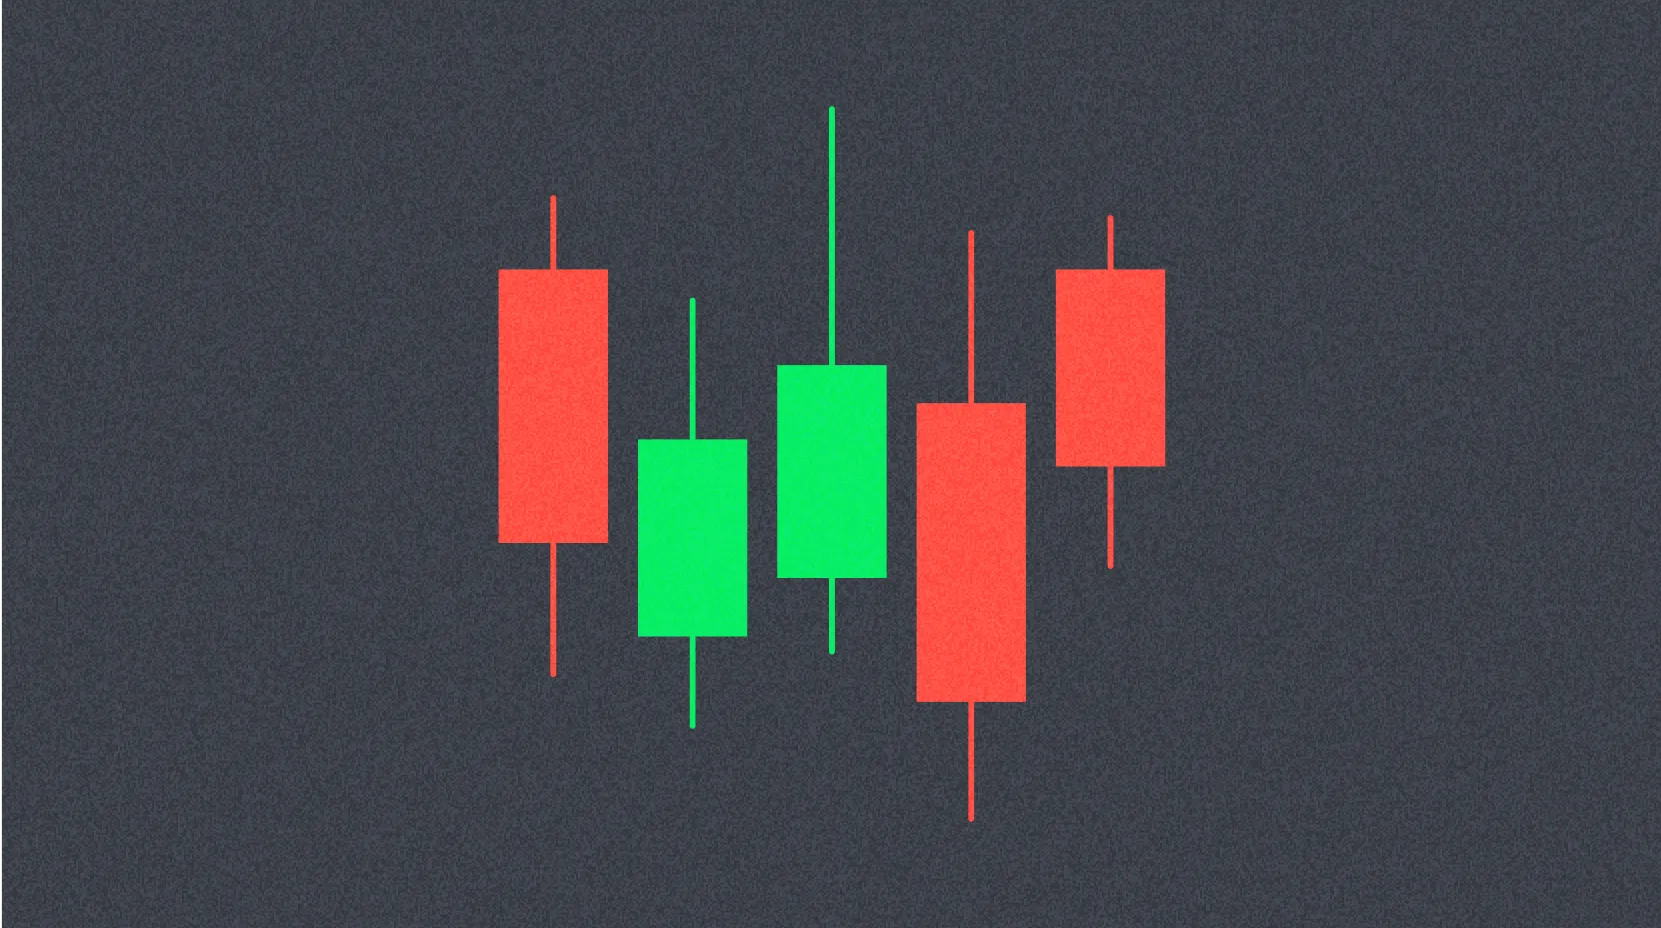
Why is technical analysis so important in crypto trading?Technical analysis is a method of predicting future price changes by studying historical price trends, chart indicators, and market patterns. Unlike fundamental analysis, TA focuses more on price action and trading volume, especially suitable for the volatile and rapidly changing crypto assets market.
In 2025, mastering technical analysis becomes particularly crucial, reasons include:- The market structure is becoming increasingly complex
-
The trend cycles are shortening, and the trading pace is picking up.
-
Algorithms and automated trading (such as trading robots) are prevalent
Support and resistance levels
Support and Resistance RangeIt is the most basic but extremely practical tool in technical analysis. These areas represent key price points of market sentiment expectations, usually indicating that prices will pause or reverse.
-
Support levelThe buying force is strong, and the price usually stops falling and rebounds here.
-
Resistance LevelSelling pressure is strong, and it is often difficult to break through when the price rises to this level.
Traders often use this to judge entry and exit points, and set stop-loss or take-profit orders.Moving Averages
Moving averages can effectively smooth price fluctuations and help identify market trends. The two most commonly used moving averages in 2025 are still:
Among them, the 50-day EMA and 200-day EMA are widely followed by institutions and retail investors. The 'Golden Cross' (50-day EMA crossing above the 200-day EMA) is often seen as a bullish signal; while the 'Death Cross' suggests a possible downward trend.Relative Strength Index (RSI)
RSI is a momentum indicator used to identify overbought or oversold conditions in the market, with values ranging from 0 to 100:
-
RSI > 70: Overbought, may face a pullback
-
**RSI ##### In the faster-paced market of 2025, RSI is particularly useful for judging short-term corrections and swing trading opportunities.Bollinger Bands
Bollinger Bands consist of a middle moving average line and upper and lower standard deviation bands. When the price touches the outer bands, it often means:
-
Market volatility is increasing, potentially leading to a breakthrough in the market.
-
Prices may correct due to overextension
Many traders will combine Bollinger Bands with RSI or MACD to get clearer entry signals. Fibonacci Retracement
The Fibonacci tool is used to determine possible support and resistance levels, with core ratios including 23.6%, 38.2%, 50%, 61.8%. After a strong market rally or decline, traders often wait for a pullback to these key levels before entering in the direction of the trend.
By 2025, the tool is particularly suitable for deploying low-cost strategies during market pullbacks.Volume Analysis
The trading volume is an important reference for verifying the strength of price trends. A high trading volume breakthrough usually means the trend is real and reliable, while a low volume breakthrough may be a "false signal".
Common volume auxiliary tools include:- OBV (On-Balance Volume)
They help identify the true momentum of the market and investor activity.## Conclusion: In 2025, be a strategic crypto traderTo win in the crypto market in 2025, you need not only strategic skills, but alsodisciplineAndThe ability to adapt to market changesBy mastering classic technical analysis tools such as support/resistance, moving averages, RSI, and trading volume, you will make trading decisions more confidently and efficiently.
Whether you are a novice or an experienced trader, like Gate.comPlatforms like this can provide you withAdvanced charting tools, real-time market data, and intelligent trading bot supportHelps you easily apply the above strategies. Whether it's day trading or swing trading, choosing a reliable and feature-rich trading platform is a key step towards success.“
* The information is not intended to be and does not constitute financial advice or any other recommendation of any sort offered or endorsed by Gate.