


1. What Is a Spot Grid Trading Bot?
A spot grid trading bot is an automated trading strategy designed for volatile markets, aiming to buy low and sell high. It can be used for short-, medium-, or long-term trading. Simply set parameters such as the price range and number of grids, and the bot handles the rest. Once activated, the bot divides your funds into multiple portions, placing buy orders as the price falls and sell orders as it rises. By continuously buying low and selling high as the market fluctuates, the bot aims to capture profits from price movements.
2. Overview of the Spot Grid Strategy
Advantages:
Spot grid bots are beginner-friendly and can help reduce mistakes caused by emotional trading in volatile markets. They automatically execute buy and sell orders 24/7, so you don’t need to constantly monitor the market to capture potential profits.
- In a sideways-to-upward market: You can profit from both price appreciation and grid arbitrage.
- In a sideways-to-downward market, grid arbitrage can help mitigate potential losses.
Disadvantages:
However, spot grid bots are not a one-size-fits-all solution. They only support long (buy) positions, so they may get stuck in prolonged downtrends, have relatively low capital efficiency, and stop executing trades when prices move outside the preset range.
Which Trading Pairs Are Suitable for Spot Grid Trading?
If you're new to trading, it's best to start with mainstream, highly liquid assets with strong market consensus, such as BTC/USDT or ETH/USDT. You can also refer to CoinMarketCap’s top 100 digital assets and check their trading status on Gate. If you’re more experienced with spot grid trading, you can consider more volatile trading pairs for greater profit potential.
3. Spot Grid Parameters Explained
Glossary of Spot Grid Terms:
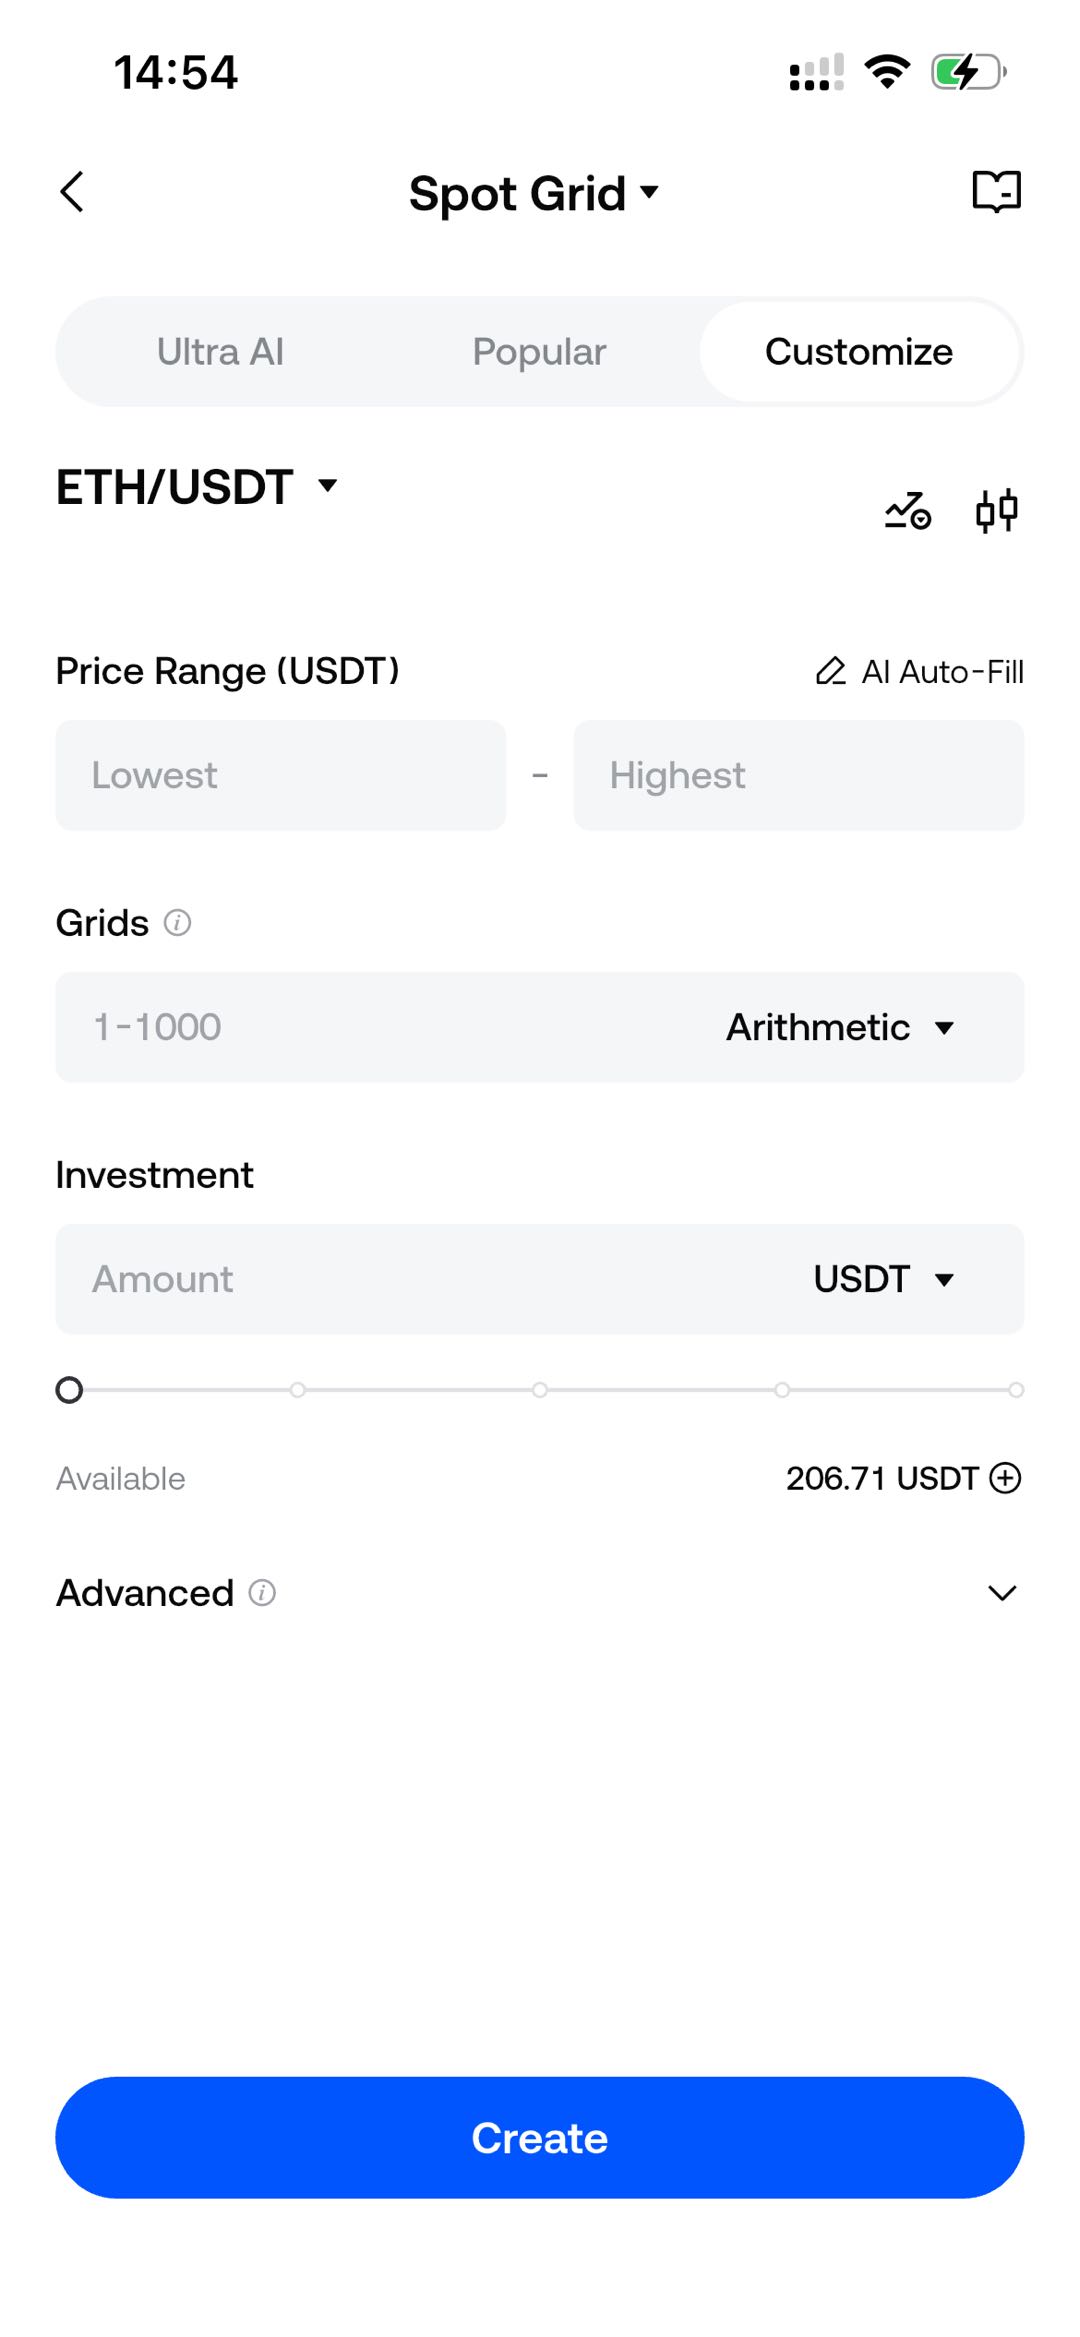
AI Smart Grid: The AI Smart Grid uses the past 7 days of historical data for backtesting to automatically determine the optimal grid parameters for maximizing potential returns, including the upper price limit, lower price limit, and number of grids. Simply select your investment amount, which must meet the minimum requirement.
Fill AI Data: Automatically retrieves and fills in the AI Smart Grid parameters.
Clear All Shortcut: If you need to clear multiple data entries, use this shortcut instead of deleting them one by one. After clicking, you can reset the parameters.
Lower Price Limit: The lowest buy price. The bot won't buy if the latest market price is below this value. Also, no sell orders will be executed at this price.
Upper Price Limit: The highest sell price. The bot won't sell if the latest market price is above this value. No buy orders will be executed at this price.
Grid Count: The number of grids to execute, ranging from 1 to 1000.
Grid Spacing:
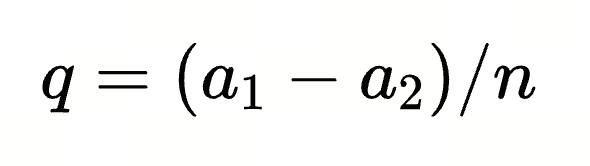
Suppose the grid spacing is q, the upper price limit is a1, the lower price limit is a2, and the grid count is n. The arithmetic grid spacing q is calculated as follows:
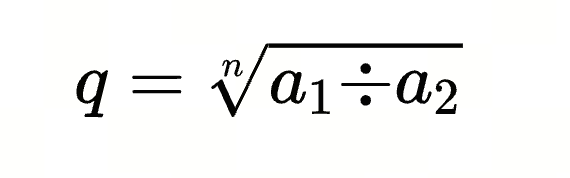
The geometric grid floating ratio q is calculated as follows:
Single Grid Return:
Suppose the grid spacing is q, the upper price limit is a1, the lower price limit is a2, and the grid count is n.
Geometric Single Grid Return:

Arithmetic Single Grid Return:


Base Buy/Sell Quantity per Grid: The amount of the selected asset to buy or sell in each grid.
Quantity Increment: By default, quantity increment is off. When enabled, you can choose to increase the buy/sell amount per grid either by a fixed number or by a percentage.
Example: If the base buy/sell quantity per grid = 1 and the quantity increment = 2, the first grid will buy/sell 1 BTC, the second grid will buy/sell 1+2=3 BTC, the third grid will buy/sell 1+2+2=5 BTC, and so on.
Advanced Settings: The above are the basic required parameters. For a cleaner interface, advanced settings are hidden by default and can be expanded by clicking. These settings include optional parameters that you can configure as needed.
Advanced Settings Explained:
- Trigger Price: The grid will only start running when the latest market price is less than or equal to the trigger price. The trigger price must be lower than the latest market price and within the grid's price range.
- Stop-Loss Price: When the latest market price is less than or equal to this price, a stop-loss is triggered. This must be below the lower price limit.
- Take-Profit Price: When the latest market price is greater than or equal to this price, a take-profit is triggered. This must be above the upper price limit.
- Settlement Options (Optional)
- Sell All Assets on Termination: When enabled, all held assets will be sold at market price for USDT when the strategy ends.
- Coin Accumulation Mode: When enabled, grid profits are instantly converted to the selected coin. In coin accumulation mode, you’re betting on long-term appreciation of the coin. Profits from each buy-sell cycle are used to buy more coins at the latest market price, increasing your coin holdings over time.
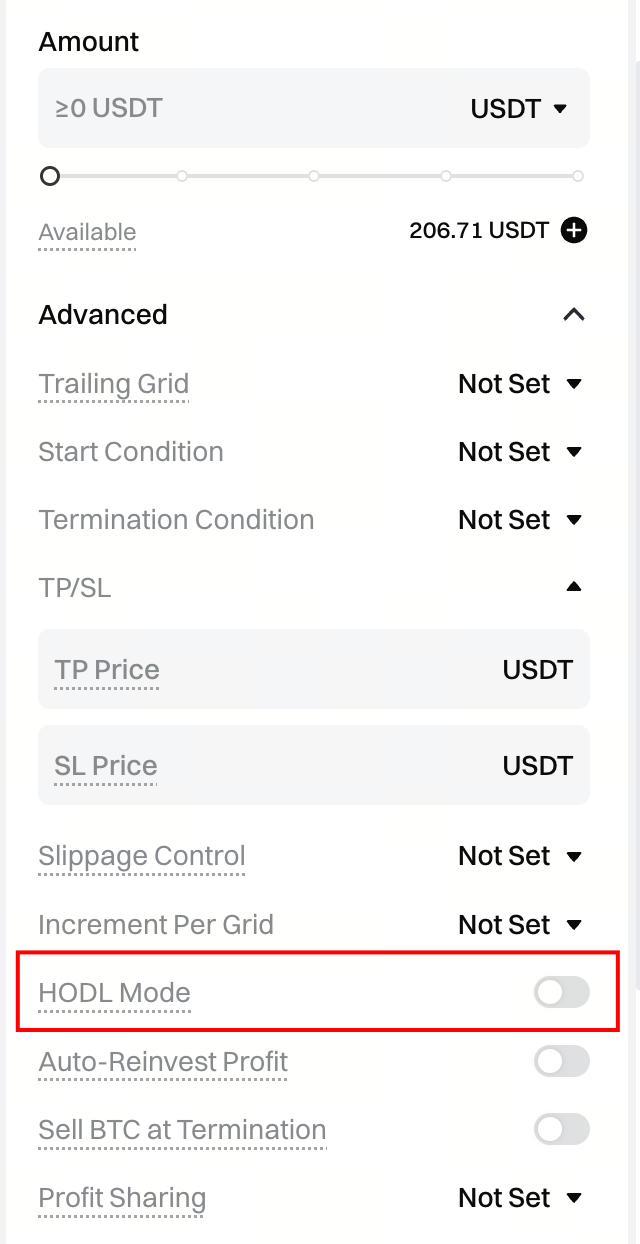
You can view the records of profits converted into coins in the coin accumulation records section when this mode is enabled.
Note: If the profit from a single buy-sell cycle is less than the system's minimum order amount, the profit will be temporarily stored. Once it reaches the minimum order amount, it will be used to buy coins at the latest market price.
Tip: “Sell All Assets on Termination” and “Coin Accumulation Mode” can be enabled at the same time.
4. How to Create/Terminate a Spot Grid
4.1 How to Create a Spot Grid
You have three creation modes:
- Smart Creation: New users can use the recommended bots section and select a 7-day/30-day/180-day backtested bot. These are based on historical trends and smart algorithms to generate parameters.
- Copy Trading: If smart creation doesn't meet your needs, you can filter for top users in the recommended bots section and copy their bots.
- Custom Creation: Set your own parameters and trigger conditions based on your market view, then confirm your investment amount to create a grid.
Spot Grid Custom Creation Process
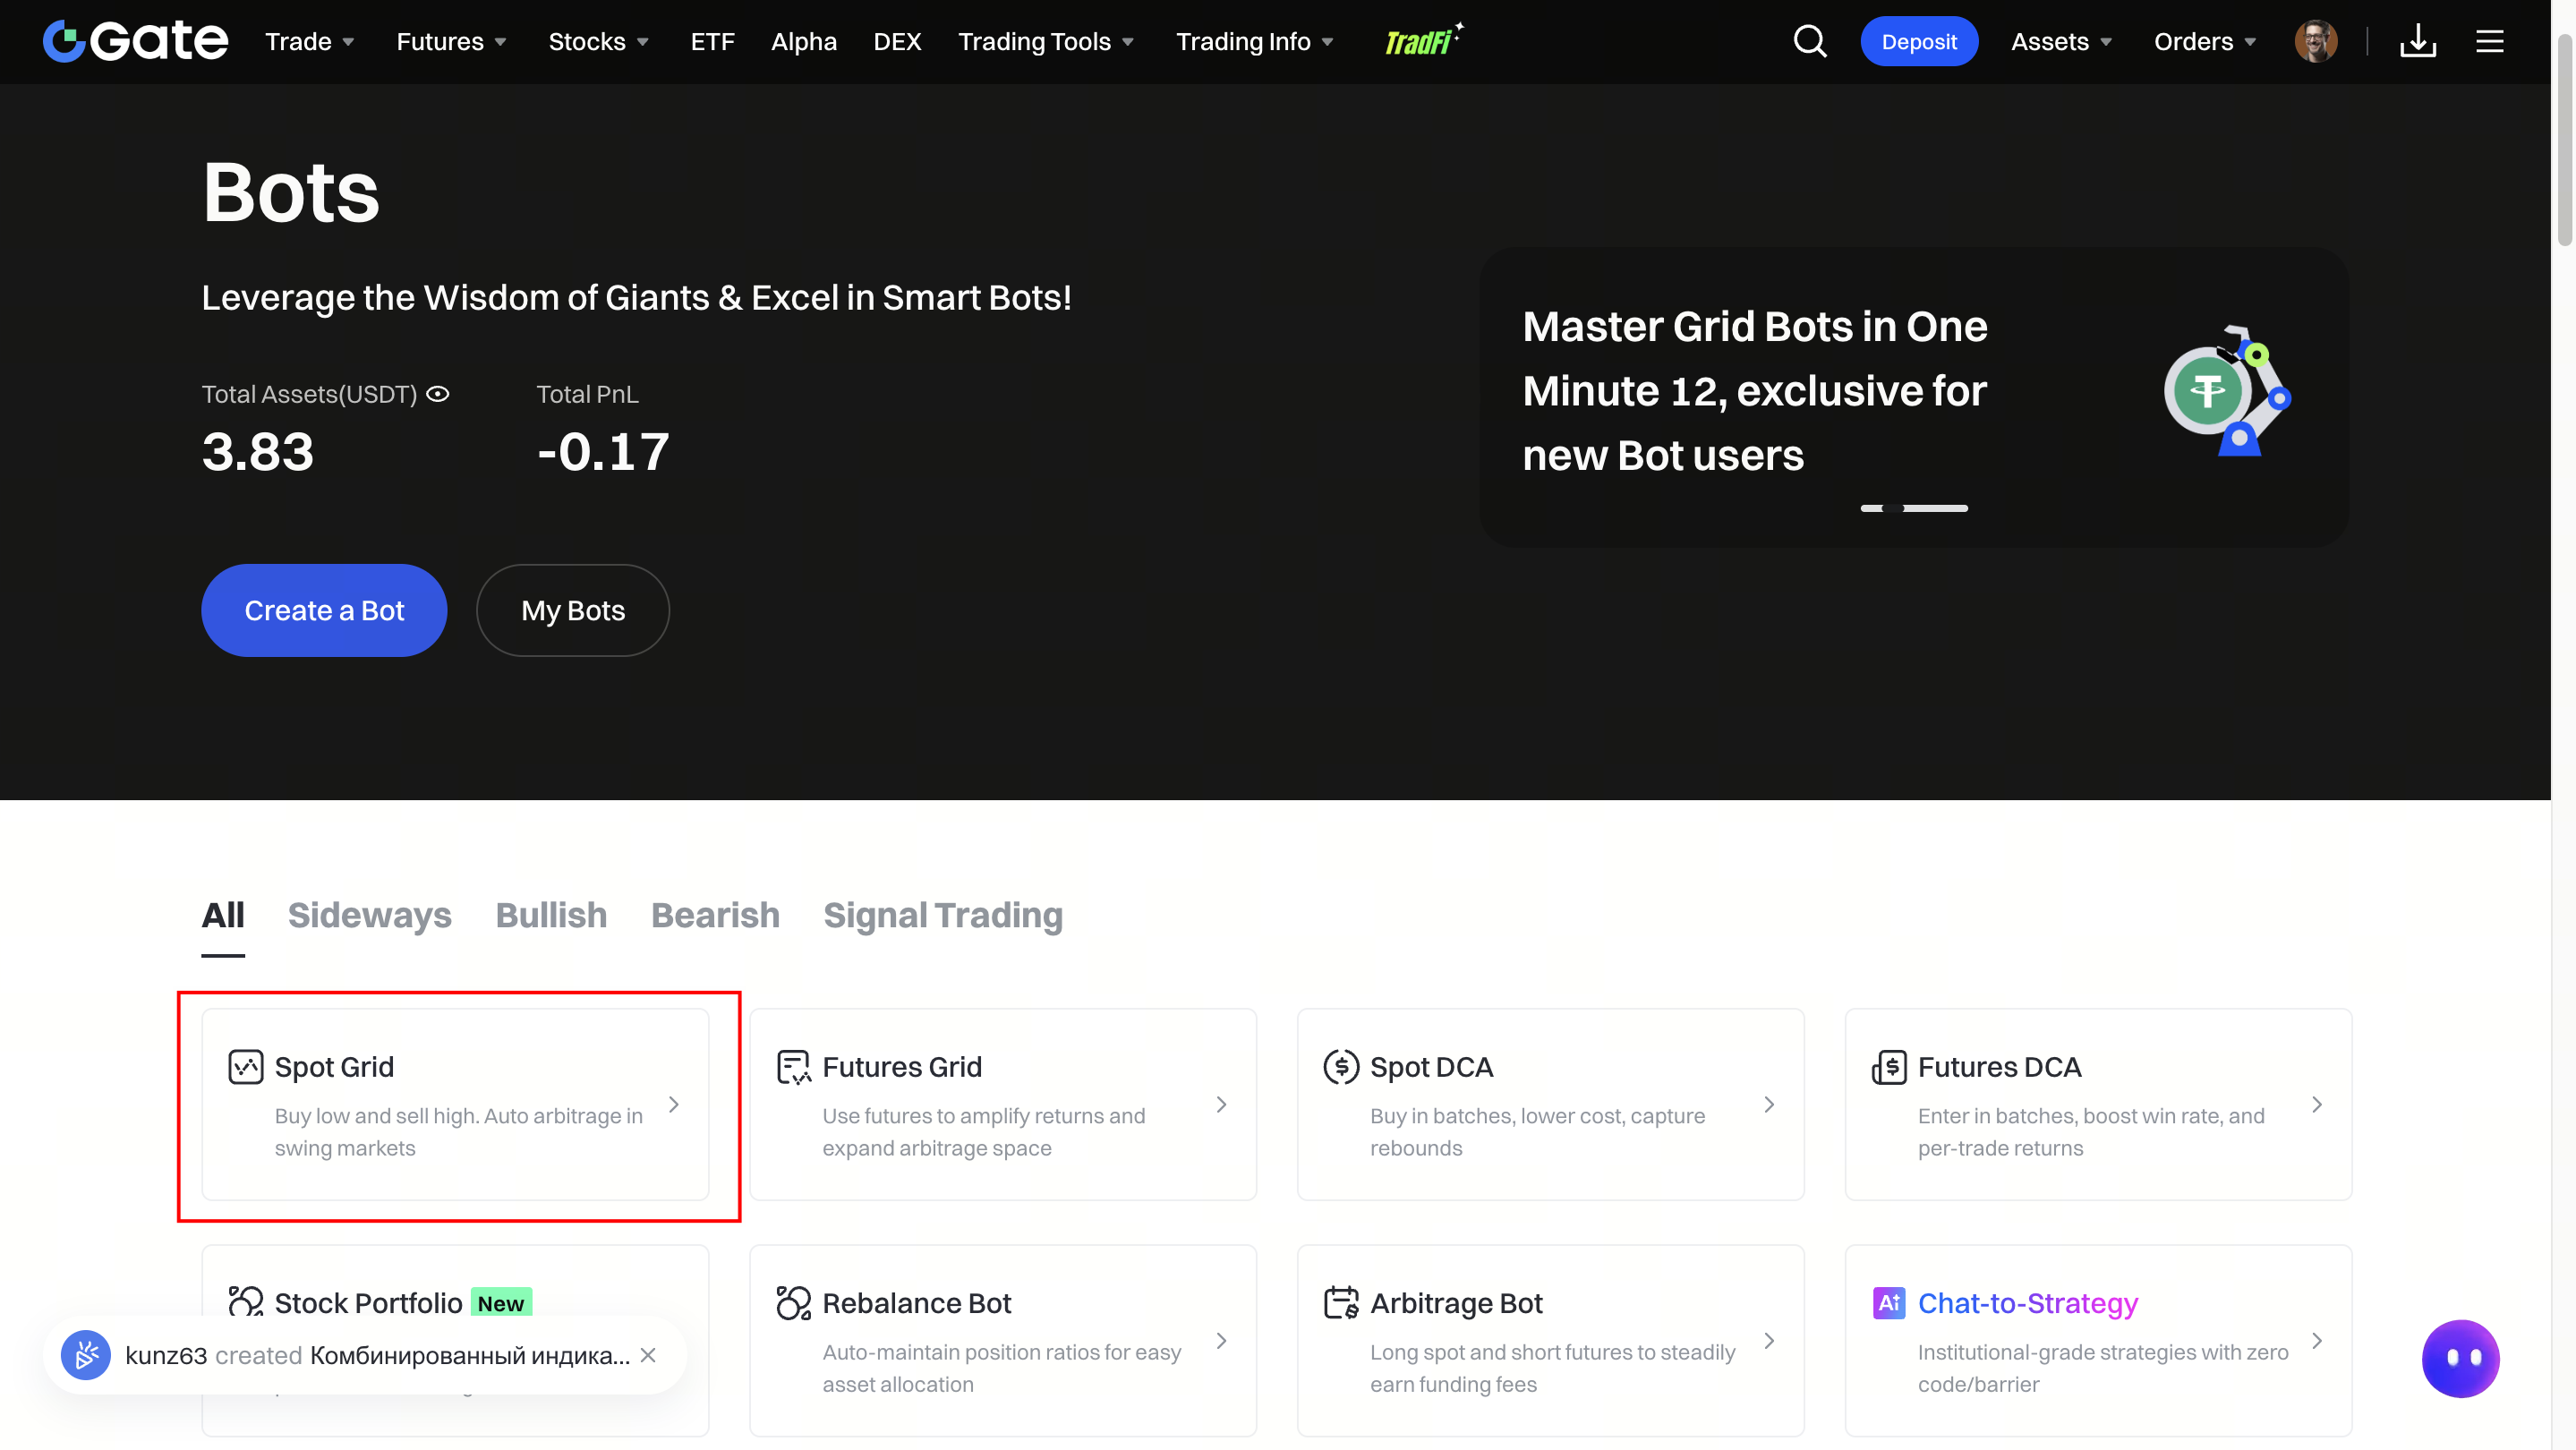
Web:
[Bots] – [Spot Grid] – [Select Trading Pair] – Ultra AI/Manual Grid Setup – [Create]
APP:
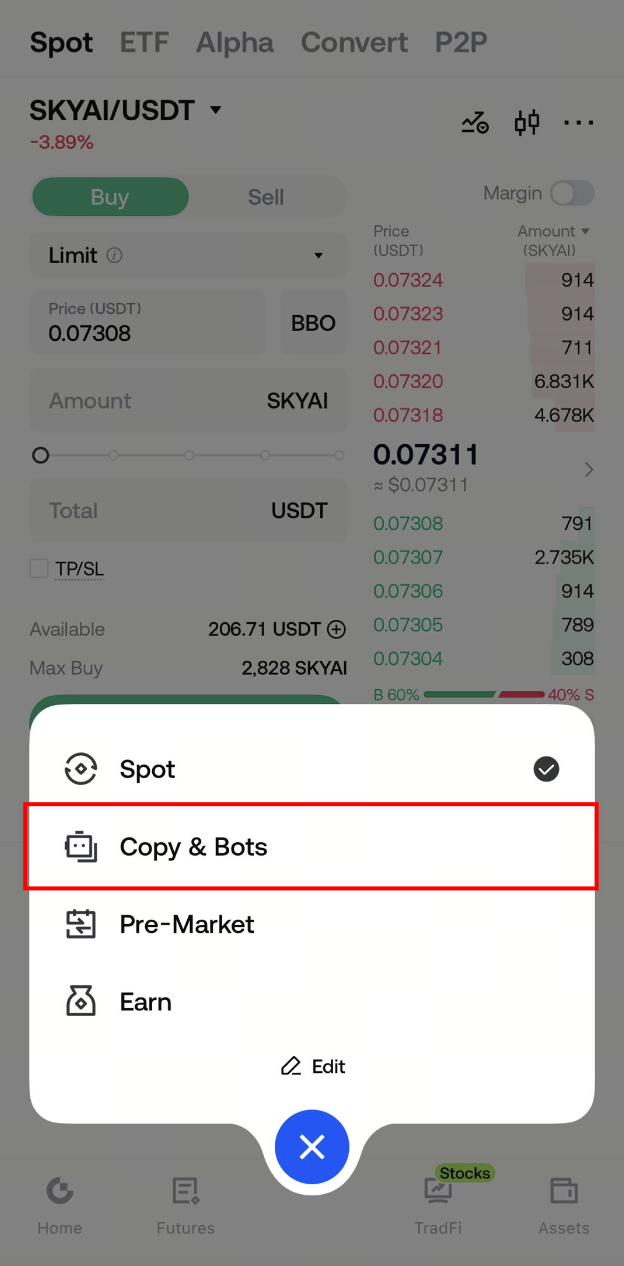
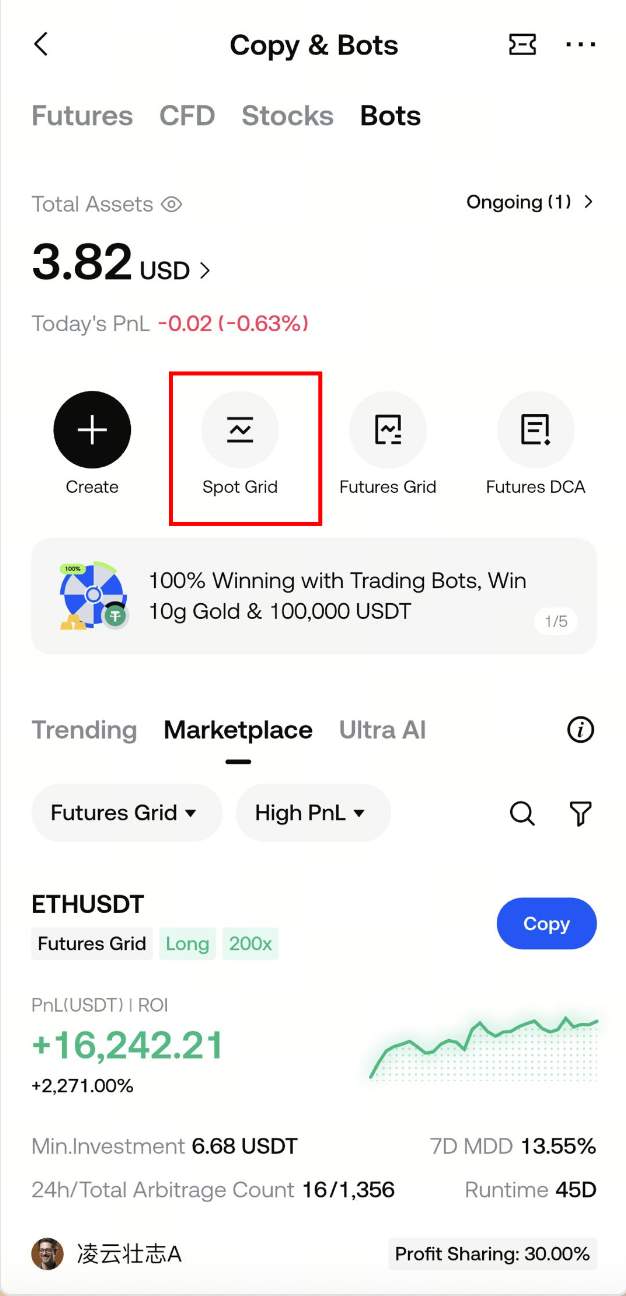
[Bots] – [Create Bot] – Spot Grid – [Select Trading Pair] – Ultra AI/Recommended Bot/Manual Grid Setup – [Create]
4.2 How to Terminate a Spot Grid
You can terminate a spot grid bot at any time. Please note:
- If the spot grid bot is no longer suitable for current market conditions, you should stop it.
- Spot grid bots are not designed for ultra-short-term trading. Most grid strategies need time to run and accumulate trades before reaching their expected returns.
- The buy-low, sell-high nature of grid bots means the profit curve may dip before rising. Initial unrealized losses can be normal.
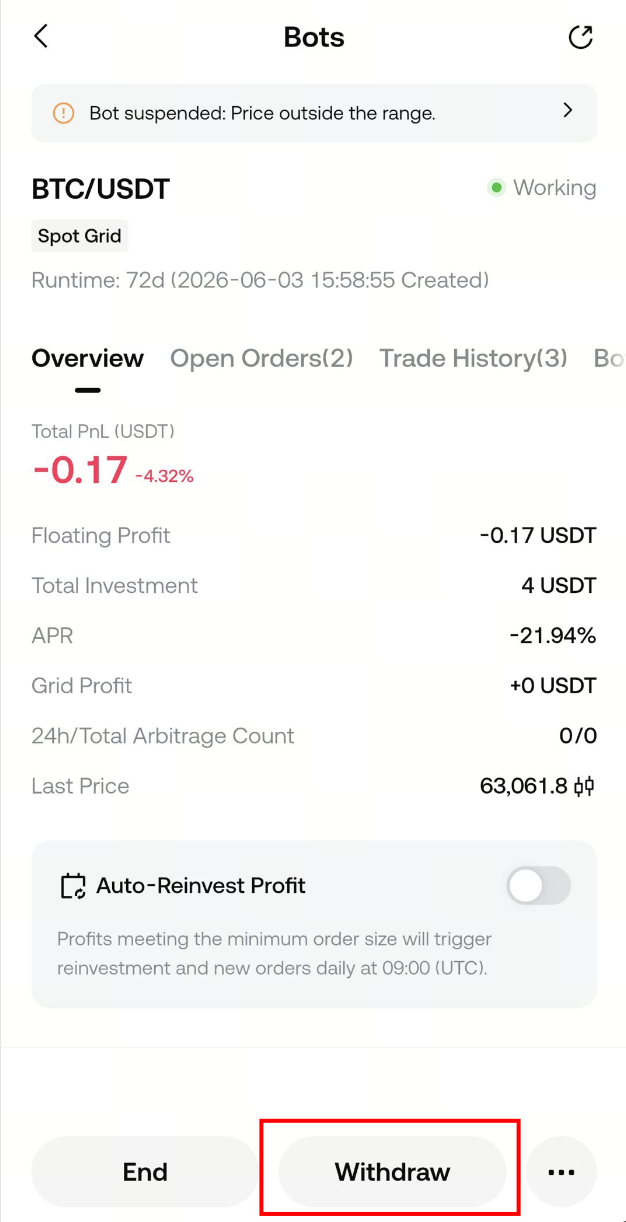
5. How to View/Withdraw Spot Grid Profits
Web:
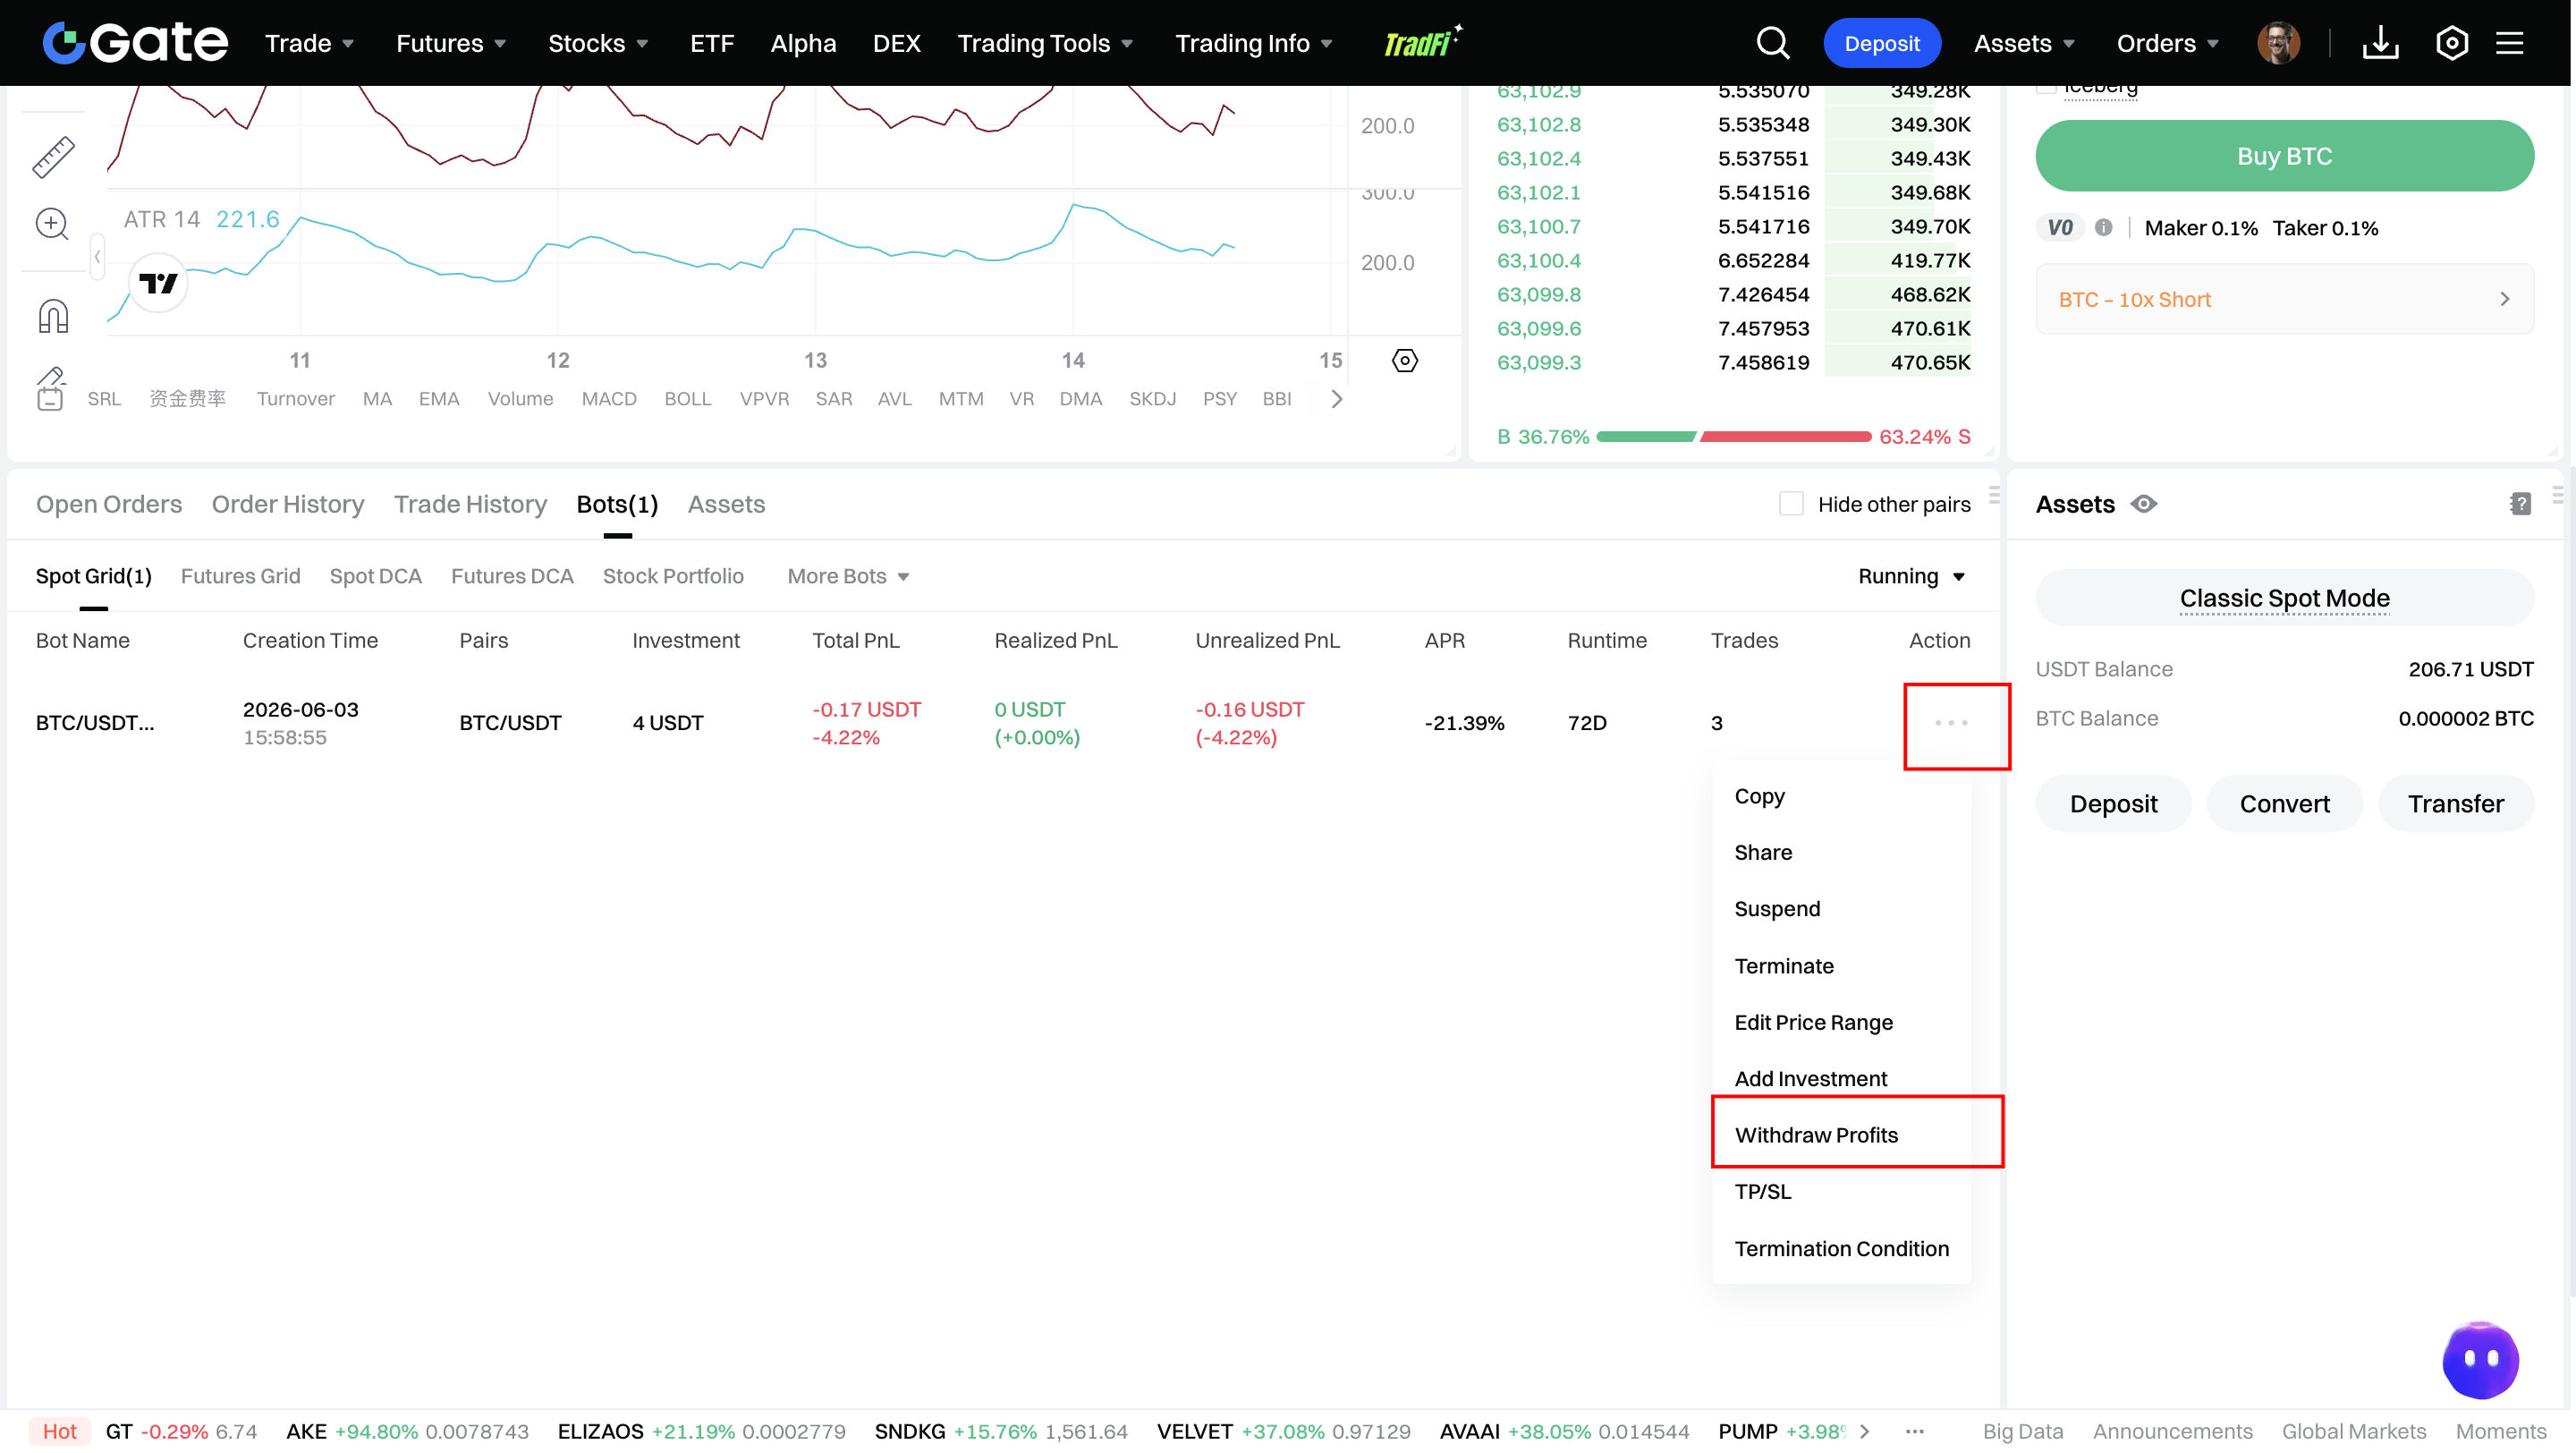
Go to [My Bots] – [Active Bots] – [Spot Grid], then enter the spot grid bot order to view or withdraw your profits.
APP:
[Trade] – [Bots] – [My Bots] – Running – Enter the spot grid bot order to view or withdraw your profits.
6. How to Maximize Spot Grid Profits
Spot grid trading divides your capital into multiple portions based on your selected price range and number of grids. It automatically buys in increments as prices fall and sells in increments as prices rise, allowing you to capture profits from price fluctuations in volatile markets. So, how can you maximize grid profits? In general, grid profitability depends largely on the number of grids, grid range, and trading fees. Choosing an appropriate grid count and price range while keeping trading fees low is key to maximizing potential profits.
6.1 Set a Reasonable Grid Range
The grid range represents the expected price fluctuation range over a given period, defined by the upper and lower price limits. If the range is too narrow, you may need to use fewer grids, increasing the risk of prices moving outside the range and causing the strategy to stop executing. If the range is too wide, you may miss short-term arbitrage opportunities because smaller price movements are less likely to trigger trades.
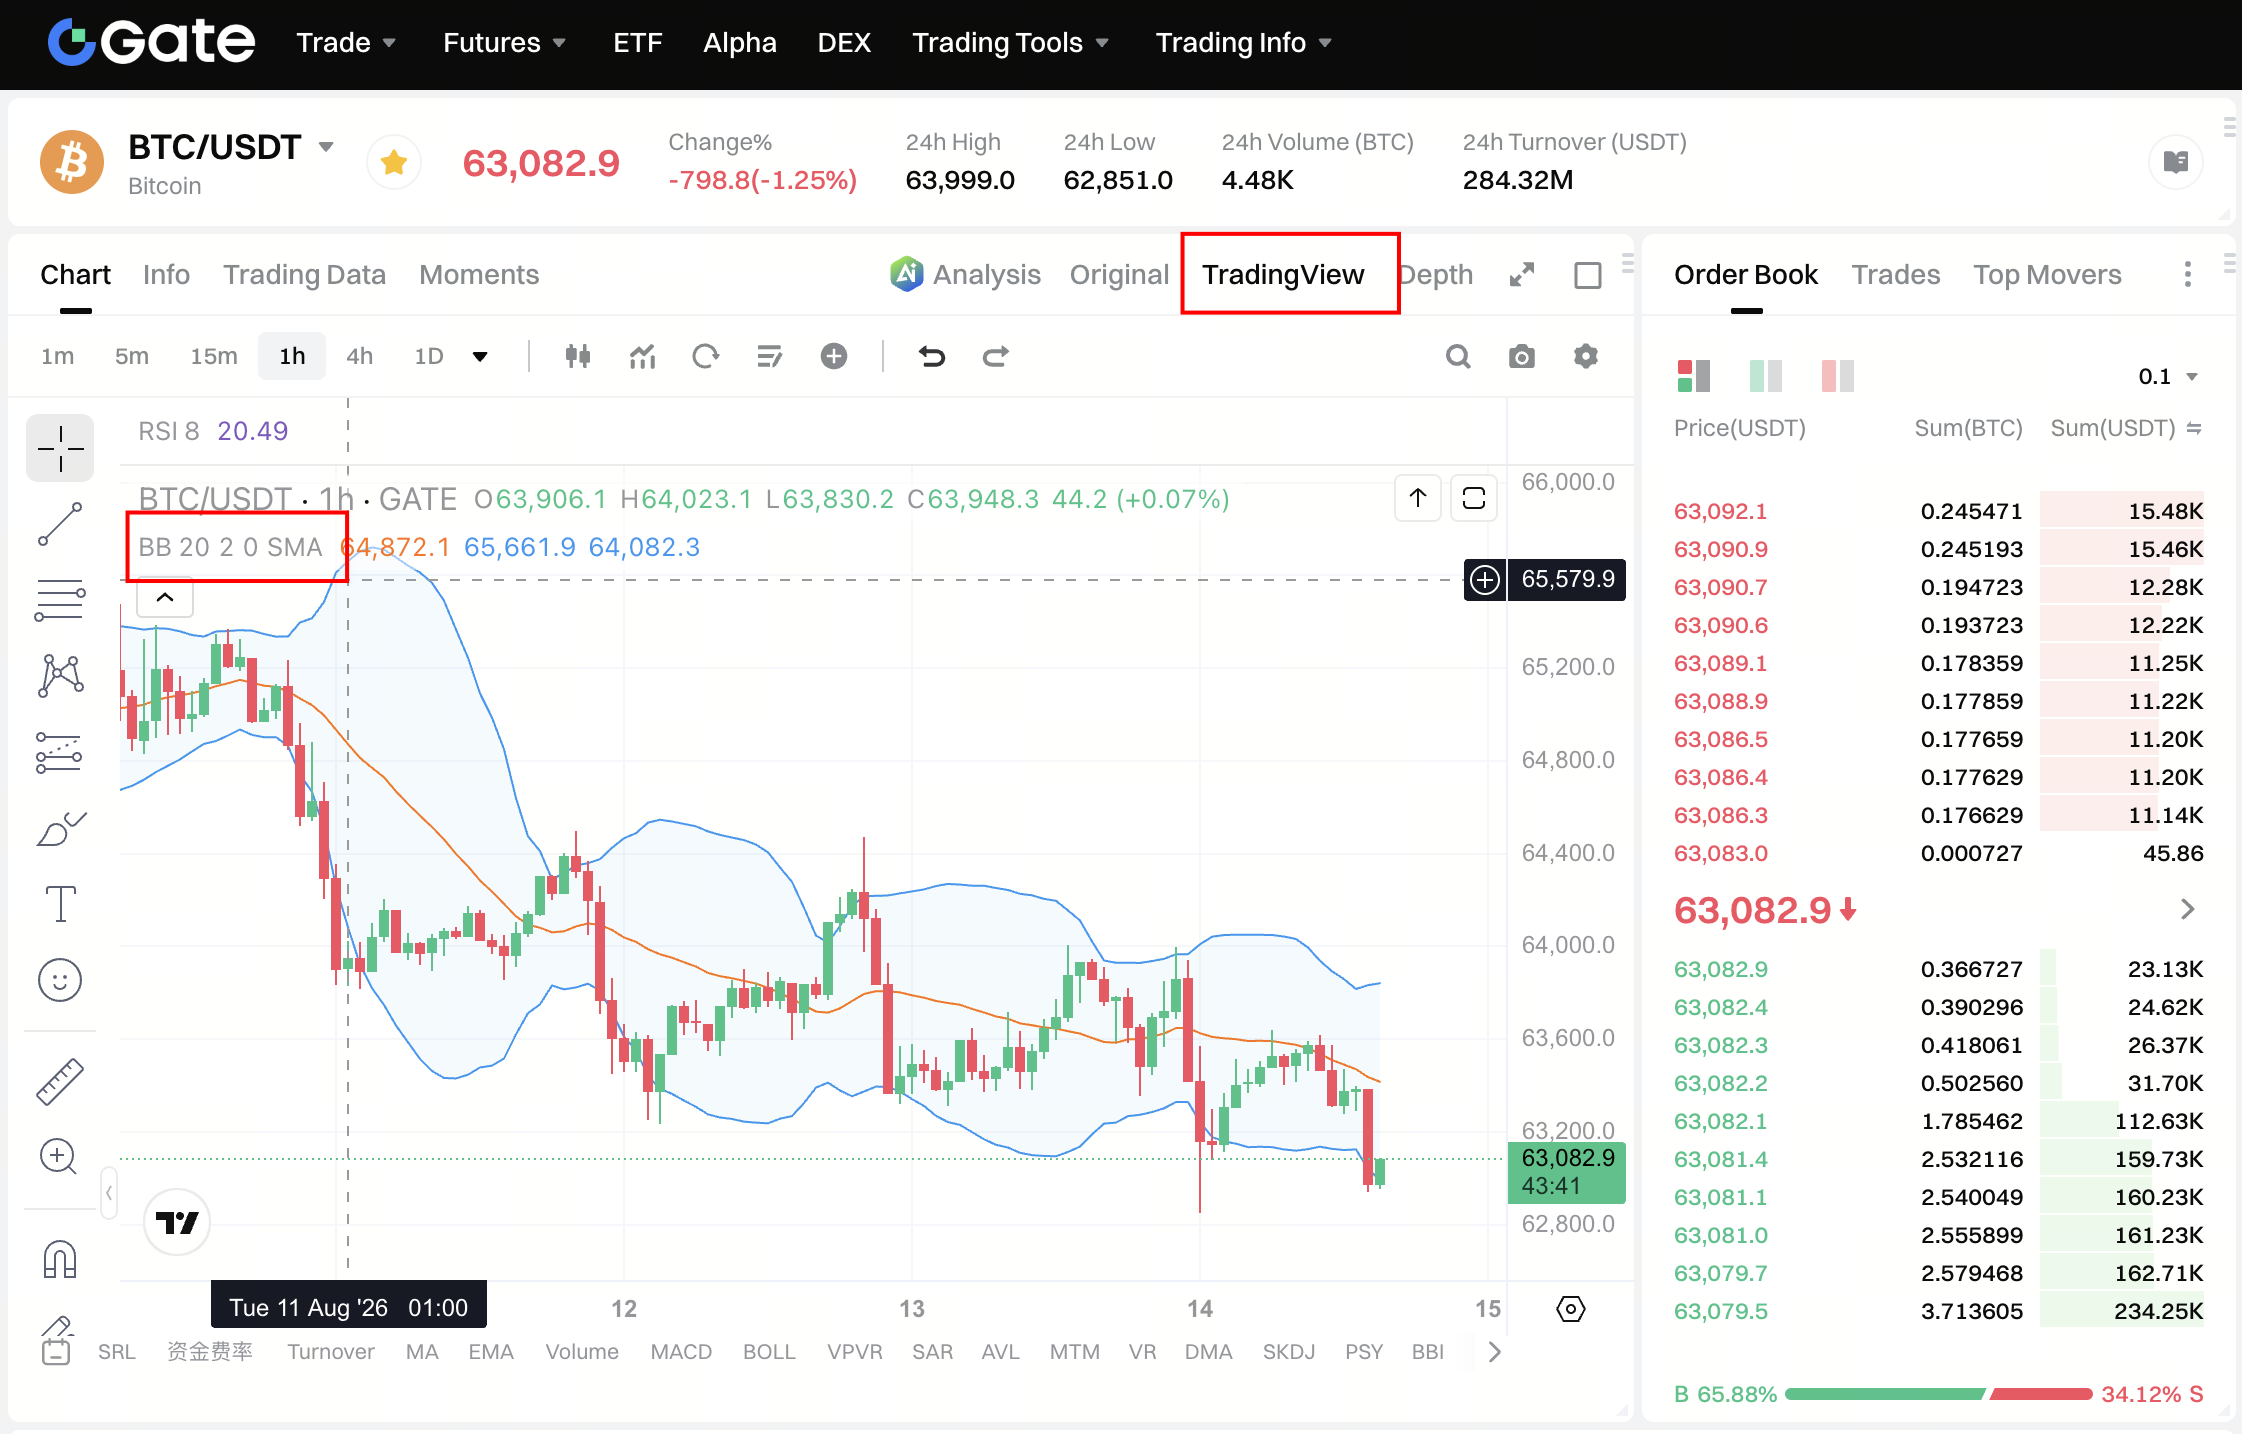
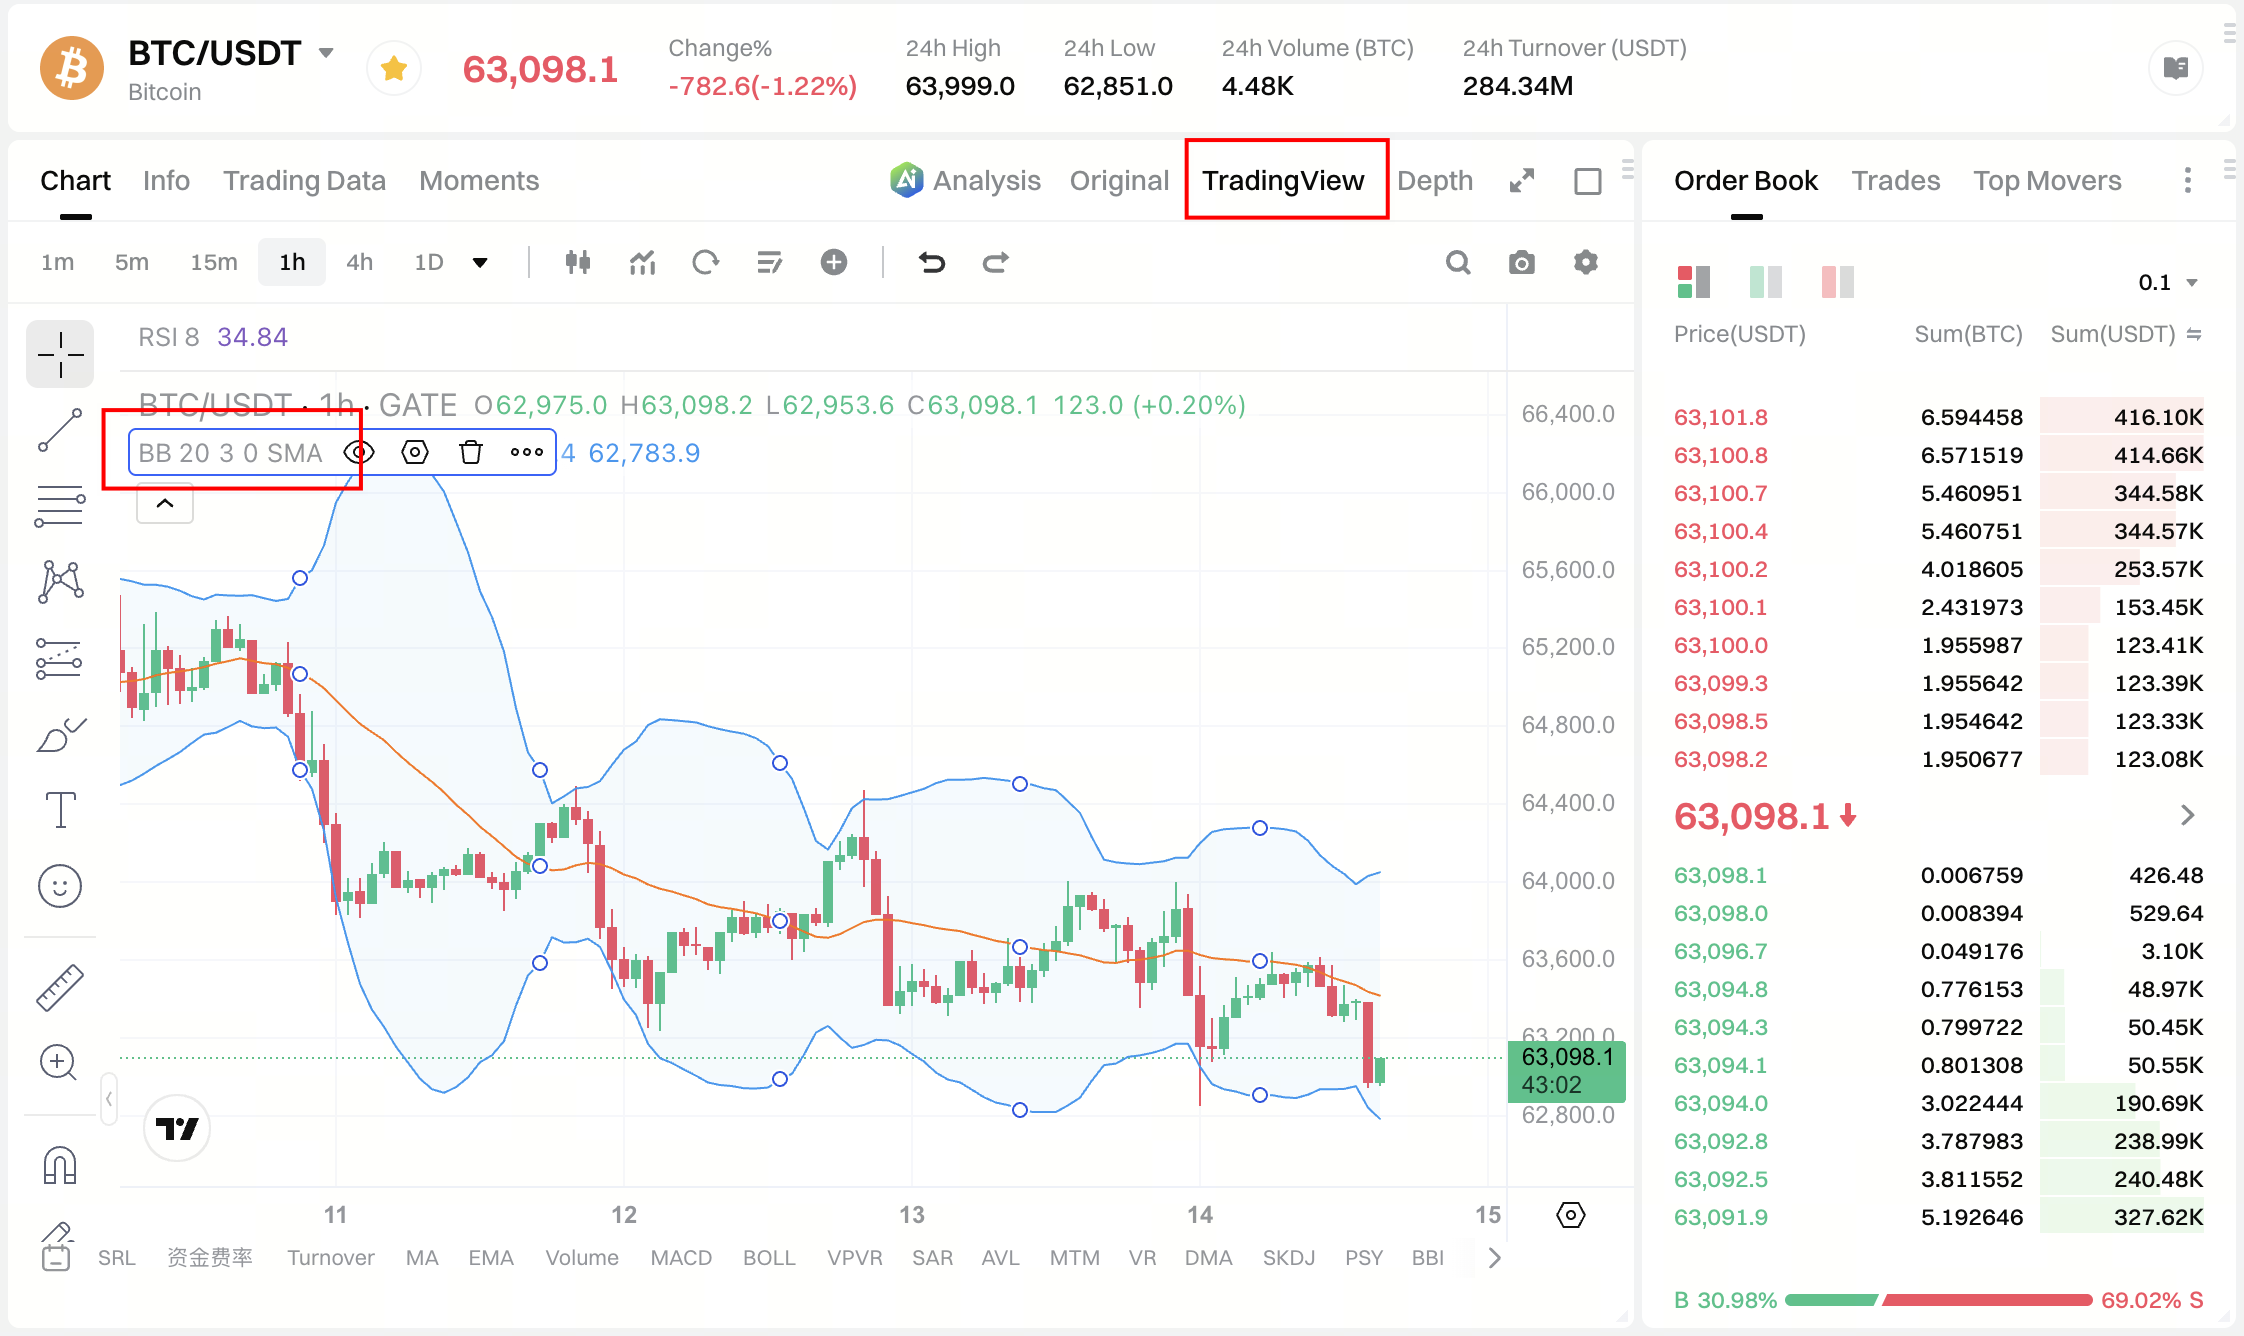
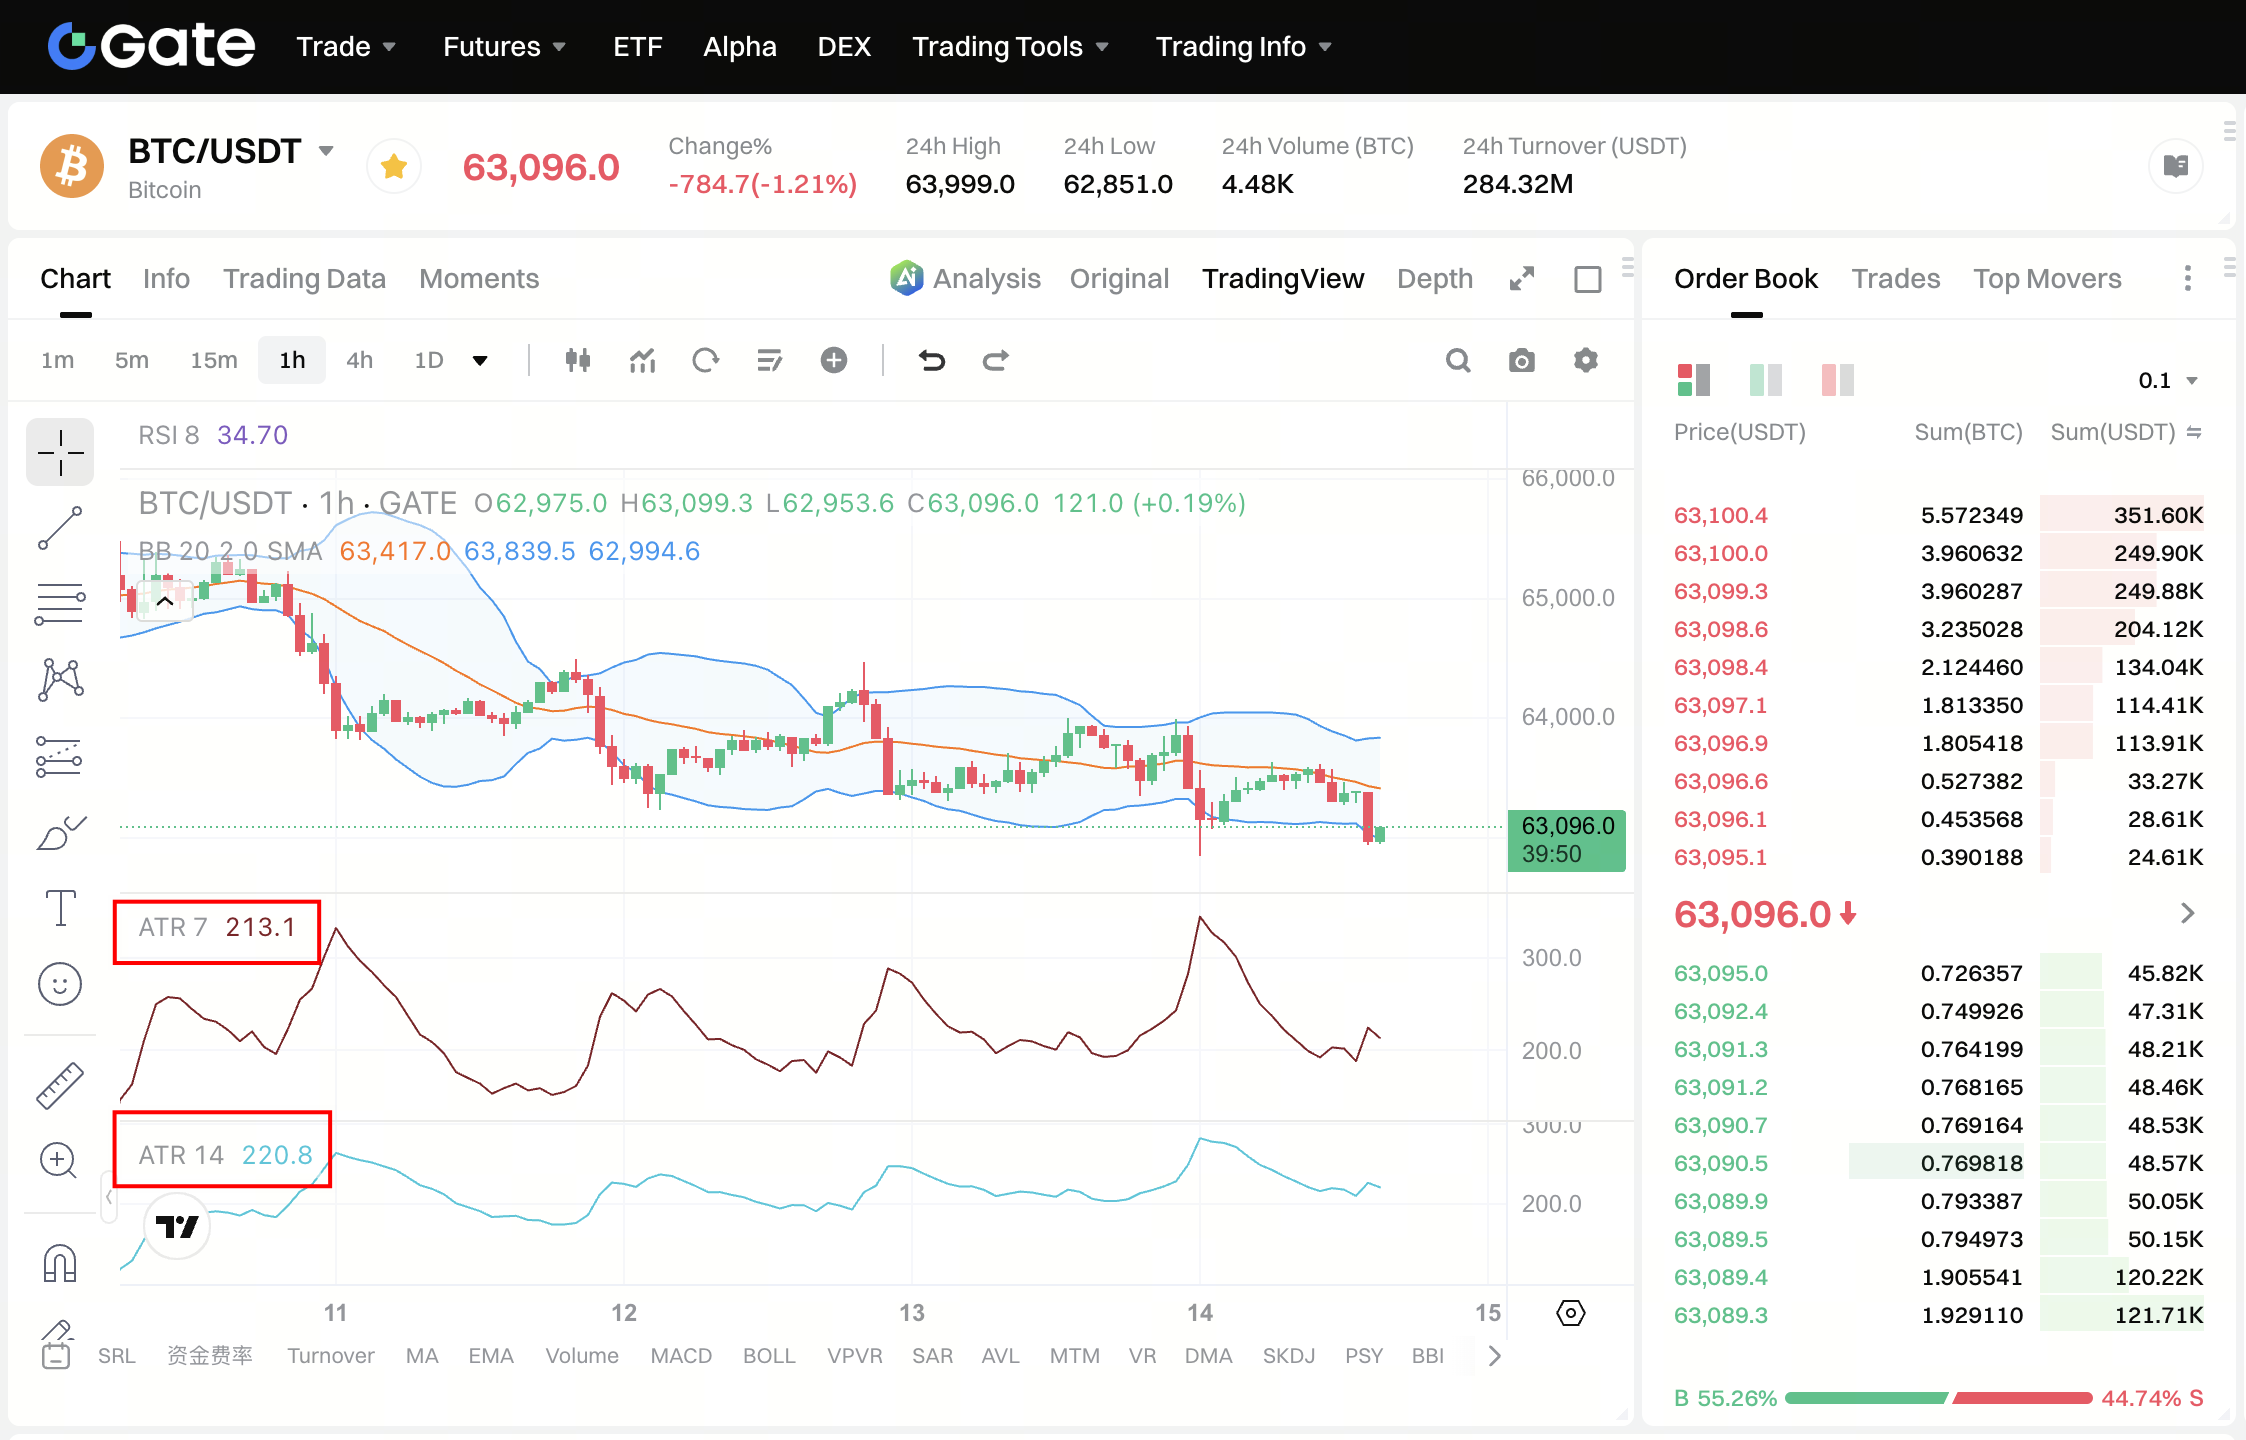
You can use indicators such as Bollinger Bands and ATR channels, or refer to longer time-frame candlesticks (typically daily or weekly) to help determine your grid range. For example, with Bollinger Bands, the upper and lower bands can serve as the grid’s price limits. Bollinger Bands are based on the concept of a normal distribution and assume that prices tend to fluctuate within the bands, with breakouts occurring relatively infrequently. When a breakout does occur, prices often move back toward the bands, and the closer the price gets to a band’s edge, the less likely it is to continue moving in the same direction. Using the upper and lower Bollinger Bands as your grid limits is a simple and straightforward approach. However, during a strong uptrend, the lower Bollinger Band may widen significantly, resulting in a wider grid range and lower capital efficiency and potential returns. In such cases, you can consider using an ATR channel to determine the grid range. As shown below, ATR channels typically expand less than Bollinger Bands, and the upper and lower boundaries of a weekly ATR channel are often used as grid limits.
Two Ways to Set the Grid Range:
1. Using Bollinger Bands
Bollinger Bands consist of three lines: the upper and lower bands serve as dynamic resistance and support levels, while the middle band represents a moving average. Prices typically fluctuate within the bands, which automatically adjust as market conditions change. When the bands narrow, a sharp price movement may follow. If the price breaks outside the bands but quickly moves back within them, a retracement may be likely.
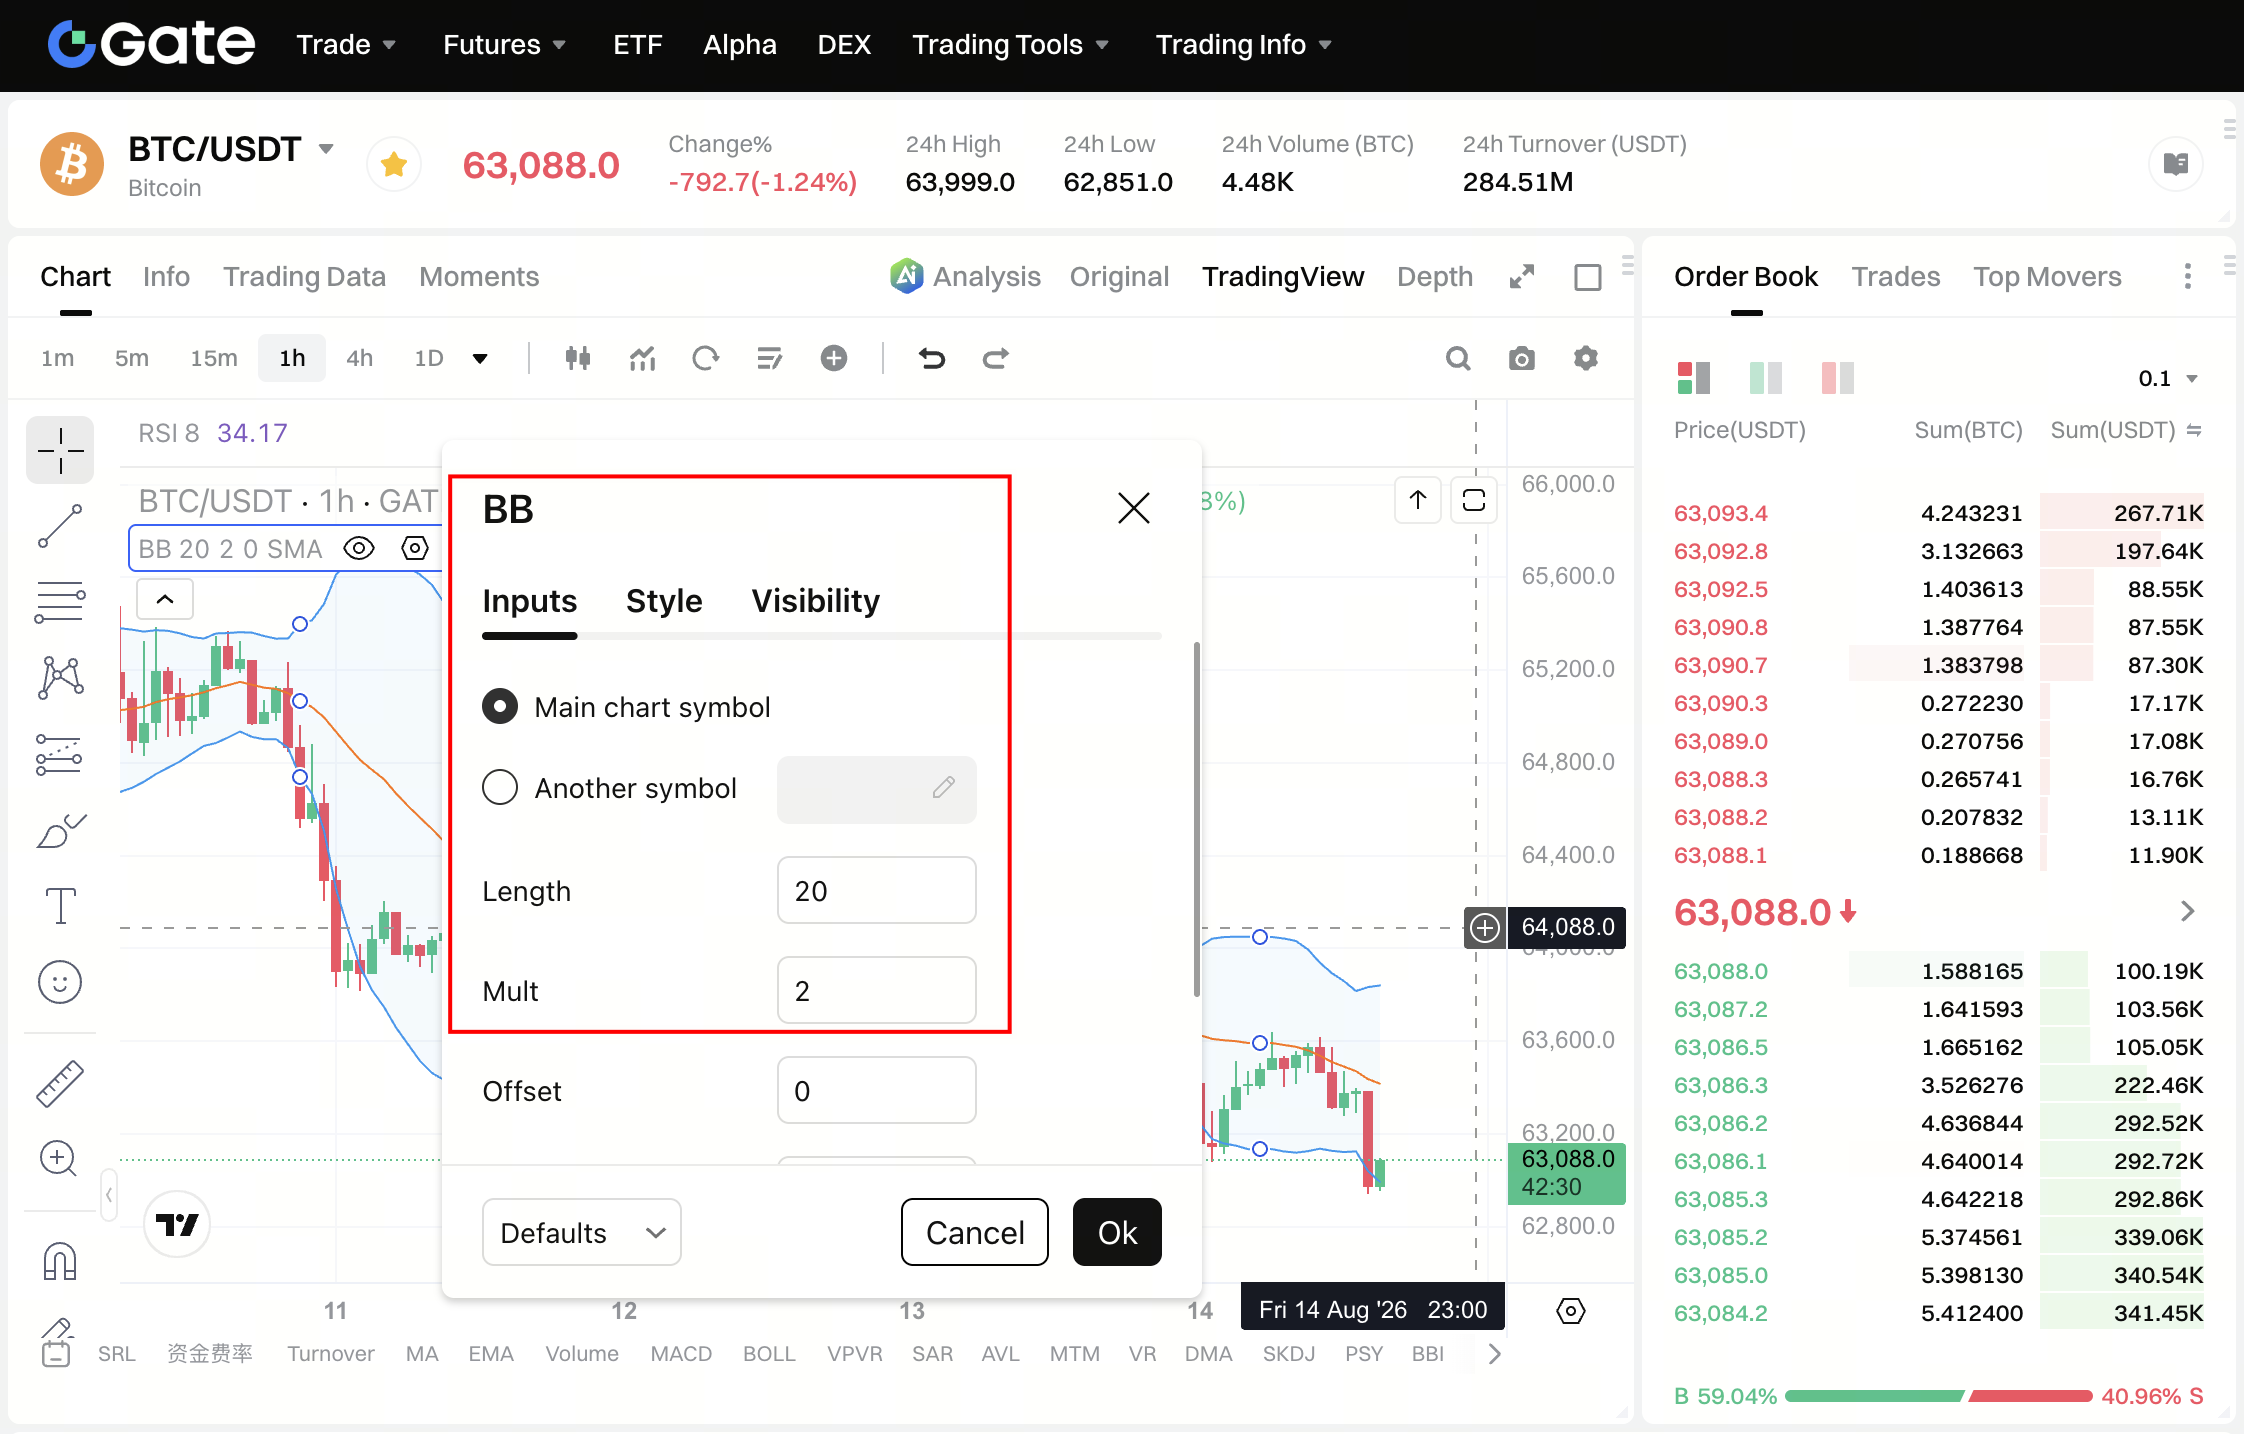
Method: Identify the Bollinger Band (BOLL) range for your chosen period and use the upper and lower bands as your price limits. The greater the standard deviation, the wider the price range. The images below illustrate Bollinger Bands based on 2x and 3x standard deviations. As shown, the 3x standard deviation covers a wider price range than the 2x standard deviation.
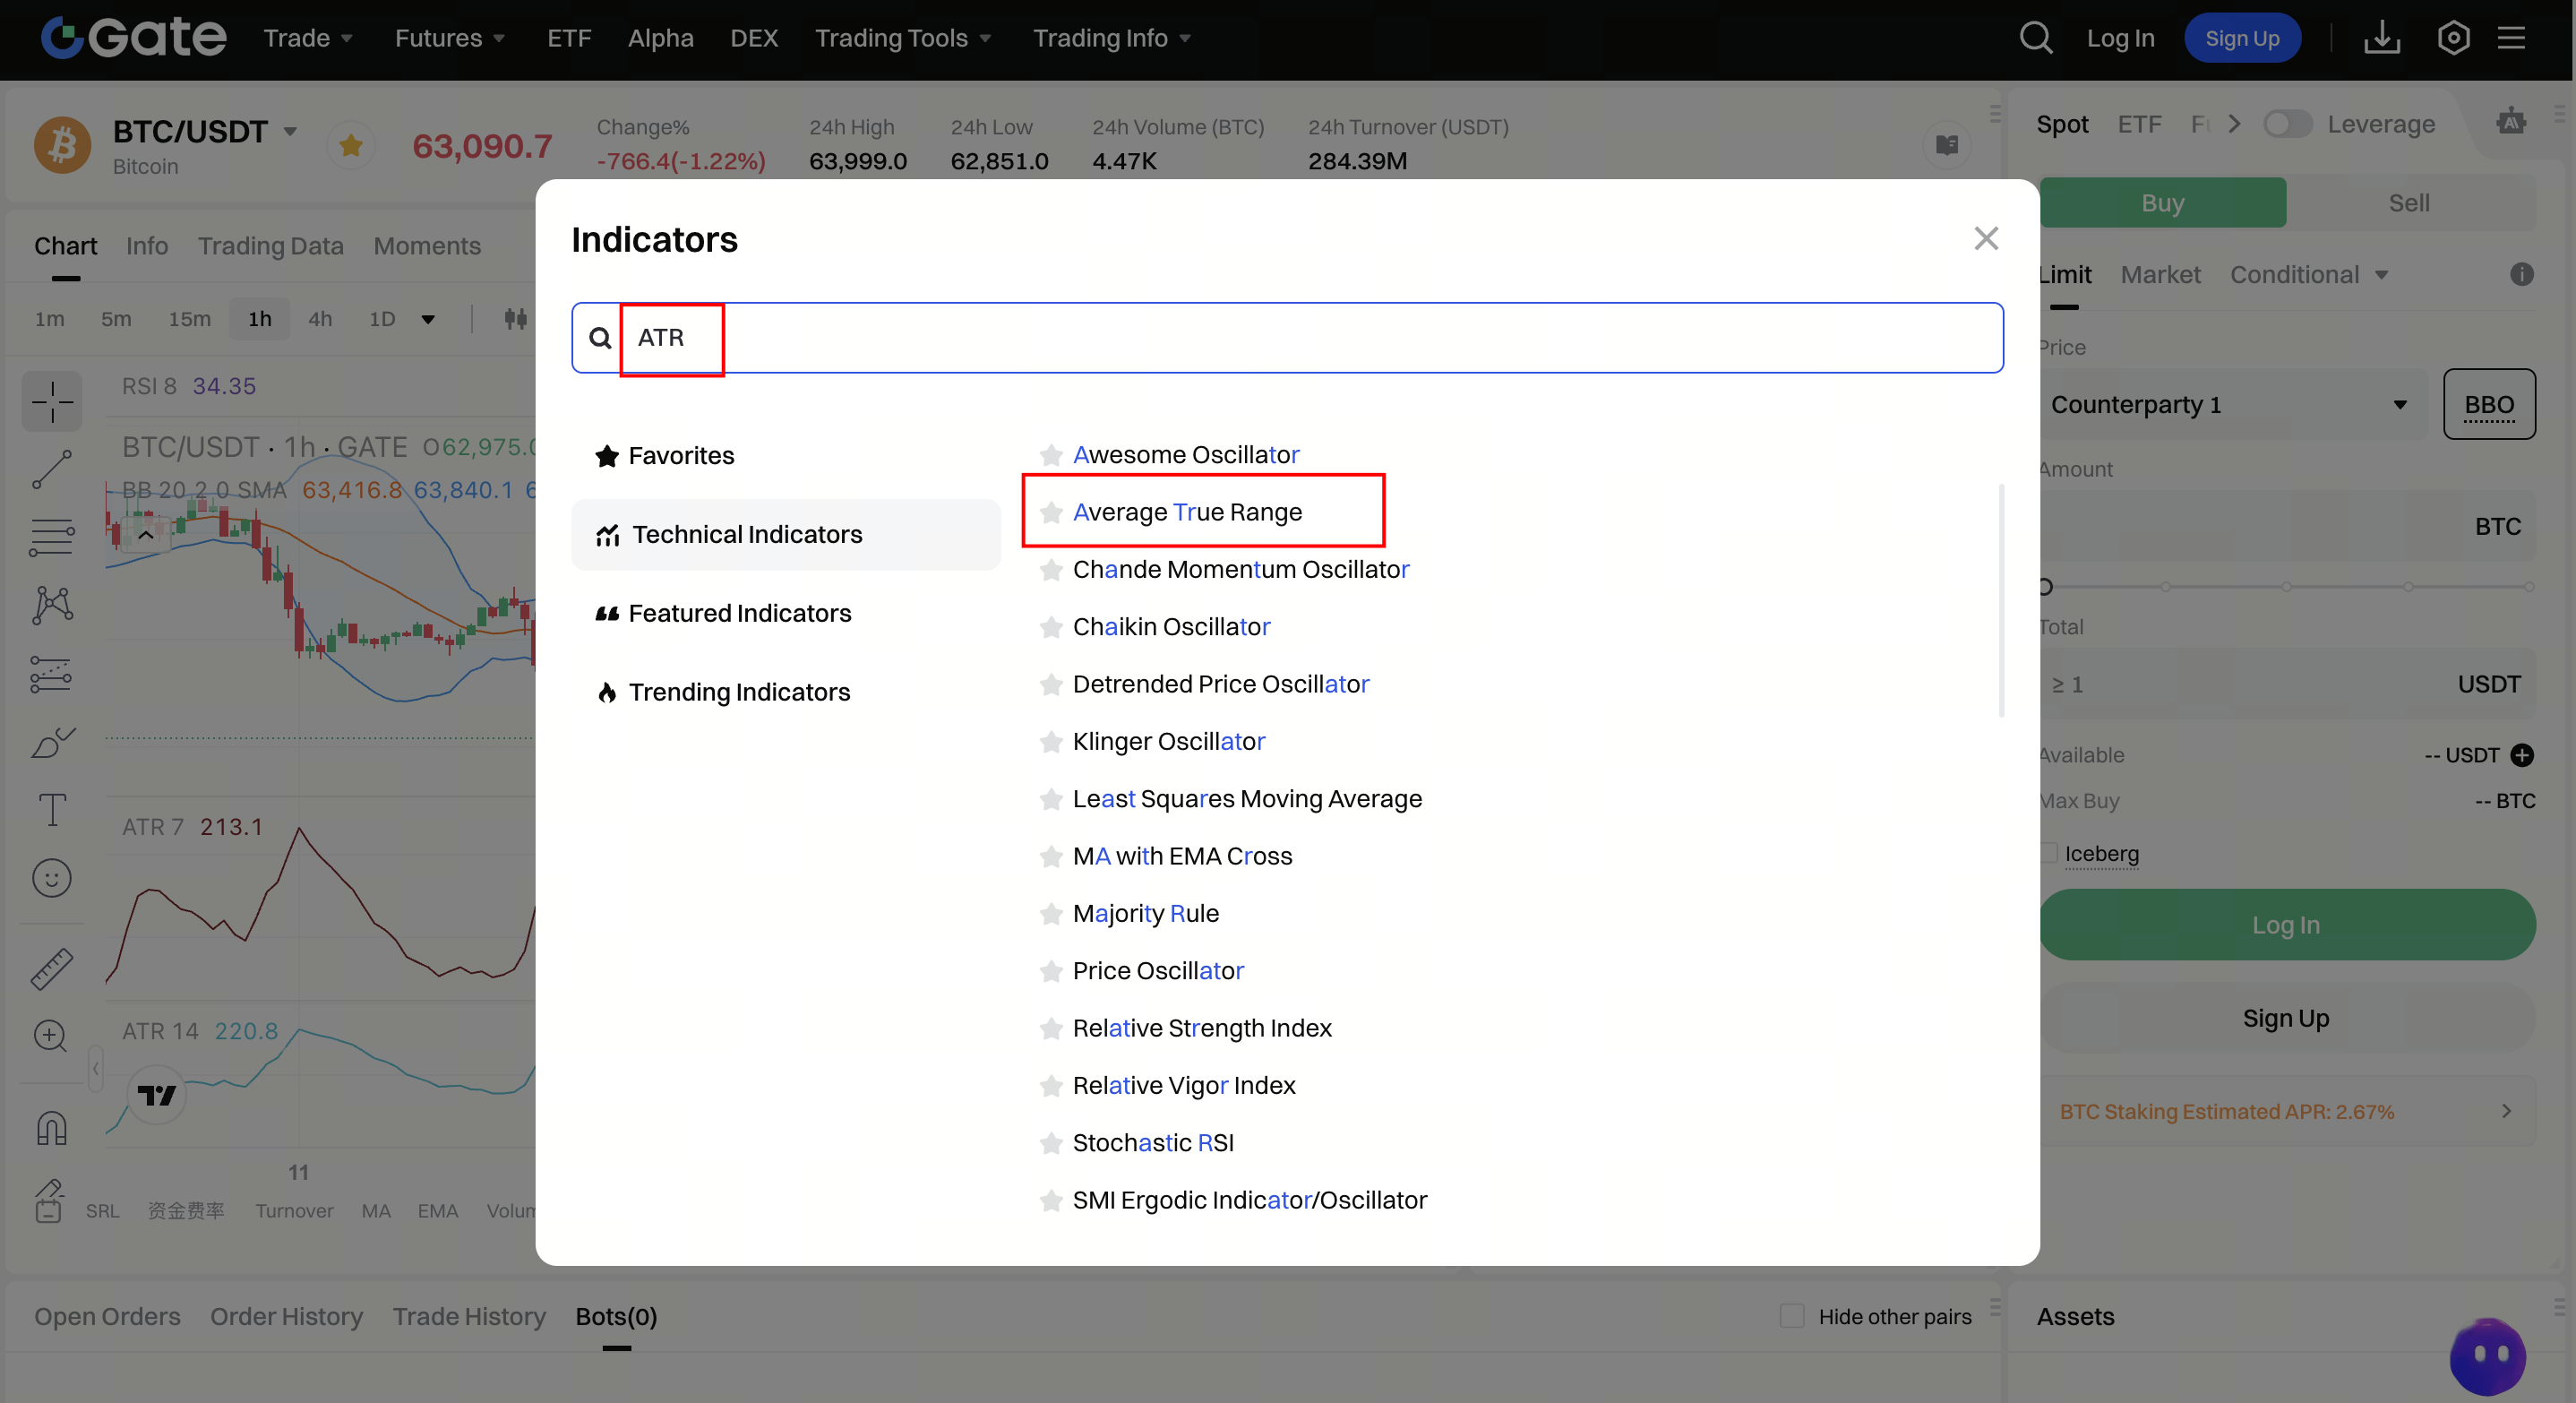
ATR is the moving average of price volatility over a set period. The higher the ATR, the more likely a trend change; the lower the ATR, the weaker the trend movement. ATR is mainly used to determine buy/sell timing.
Method: Use the upper and lower price limits from the ATR for your chosen period as the grid range. For example, ATR(7) represents the average true range over the past 7 days. You can use the highest and lowest prices during this period as the upper and lower grid limits, respectively. See the example below:
Grid Net Profit = Grid Arbitrage Return – (Trading Fee x 2).
Grid arbitrage is your gross profit; after deducting trading fees, the remainder is your net profit. To maximize net profits, keep trading fees as low as possible. Here’s how:
- Choose coins with low fees. Gate currently offers some zero-fee trading pairs, such as BTC-USDT.
- Upgrade your VIP level to lower your trading fees.
- For highly liquid perpetual contracts, you can use perpetuals instead of spot trading.
- Set grid ranges and counts wisely to reduce unnecessary trades. Grid range, grid count, and trading fees are closely linked; reasonable settings are essential.
7. Auto-Moving Grid Feature in Spot Grid
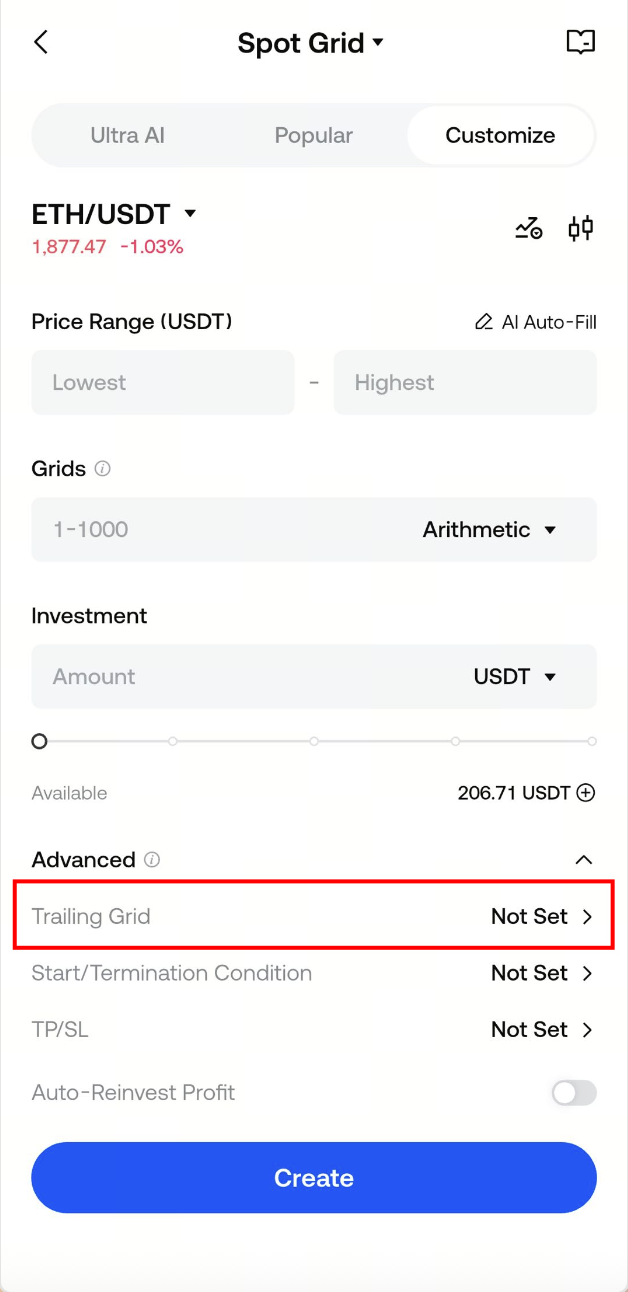
The [Moving Grid] feature in Spot Grid’s advanced settings allows the bot to automatically shift its grid range up or down in response to market movements. There are two trigger modes: Moving Average and Breakout.
Moving Grid Explained:
Once the grid is running, if the price moves outside the grid range, the bot will automatically shift the grid range up or down based on your selected mode. This helps the bot adapt to uptrends and avoid getting stuck in downtrends.
Key Features of Moving Grid:
- The grid's upper and lower price limits move by the same amount.
- The number of grids remains unchanged after moving.
- Since the grid count is unchanged, the per-grid return stays the same.
Moving Grid Trigger Conditions:
- Moving Average: After the bot opens a position or adjusts the price range, if the latest price moves outside the grid range and the 720-minute moving average changes by the preset percentage, the bot will automatically shift the price range up or down. An upward move in the 720-minute MA triggers an upward grid shift, while a downward move triggers a downward shift.
- Breakout: After the bot opens a position or adjusts the price range, if the latest price breaks above the upper grid limit by at least one grid interval, the entire grid will shift up by one grid interval. If the price breaks below the lower grid limit by at least one grid interval, the grid will shift down by one grid interval. The number of grids remains unchanged, and the bot will continue running within the new range.
How to Enable the Moving Grid Feature:
[Bots] – [Spot Grid] – Ultra AI/Manual Setup – [Advanced Settings] – Fill in the moving grid parameters
Disclaimer
The content provided herein is for reference and educational purposes only and does not constitute any financial, investment, trading, or legal advice, nor does it constitute an offer or solicitation to buy or sell any digital assets. Gate makes no express or implied representations or warranties regarding the accuracy, completeness, or timeliness of the information contained herein. Product features, interfaces, rules, and fee structures may be updated or adjusted at any time. Please refer to the latest announcements and the actual information displayed on the Gate platform for the most accurate details.
Digital asset investments involve significant risk, and prices may fluctuate substantially. You may lose the entire amount of your investment. Please make decisions cautiously based on your own financial situation and risk tolerance after fully understanding the associated risks. If necessary, you are advised to consult an independent professional financial or legal advisor.
For more information about potential risks, please refer to Gate's Risk Disclosure and User Agreement.
