廣場
最新
熱門
資訊
我的主頁
發布
掃描下載 Gate App
更多下載方式
今天不再提醒
顺势而为才有福报
行情分析師
區塊鏈鑽石手
合約策略師
訂閱
關注
一起來擼狗莊,輕倉帶止損!
20
關注
187
粉絲
72
點讚
廣場
直播
置頂
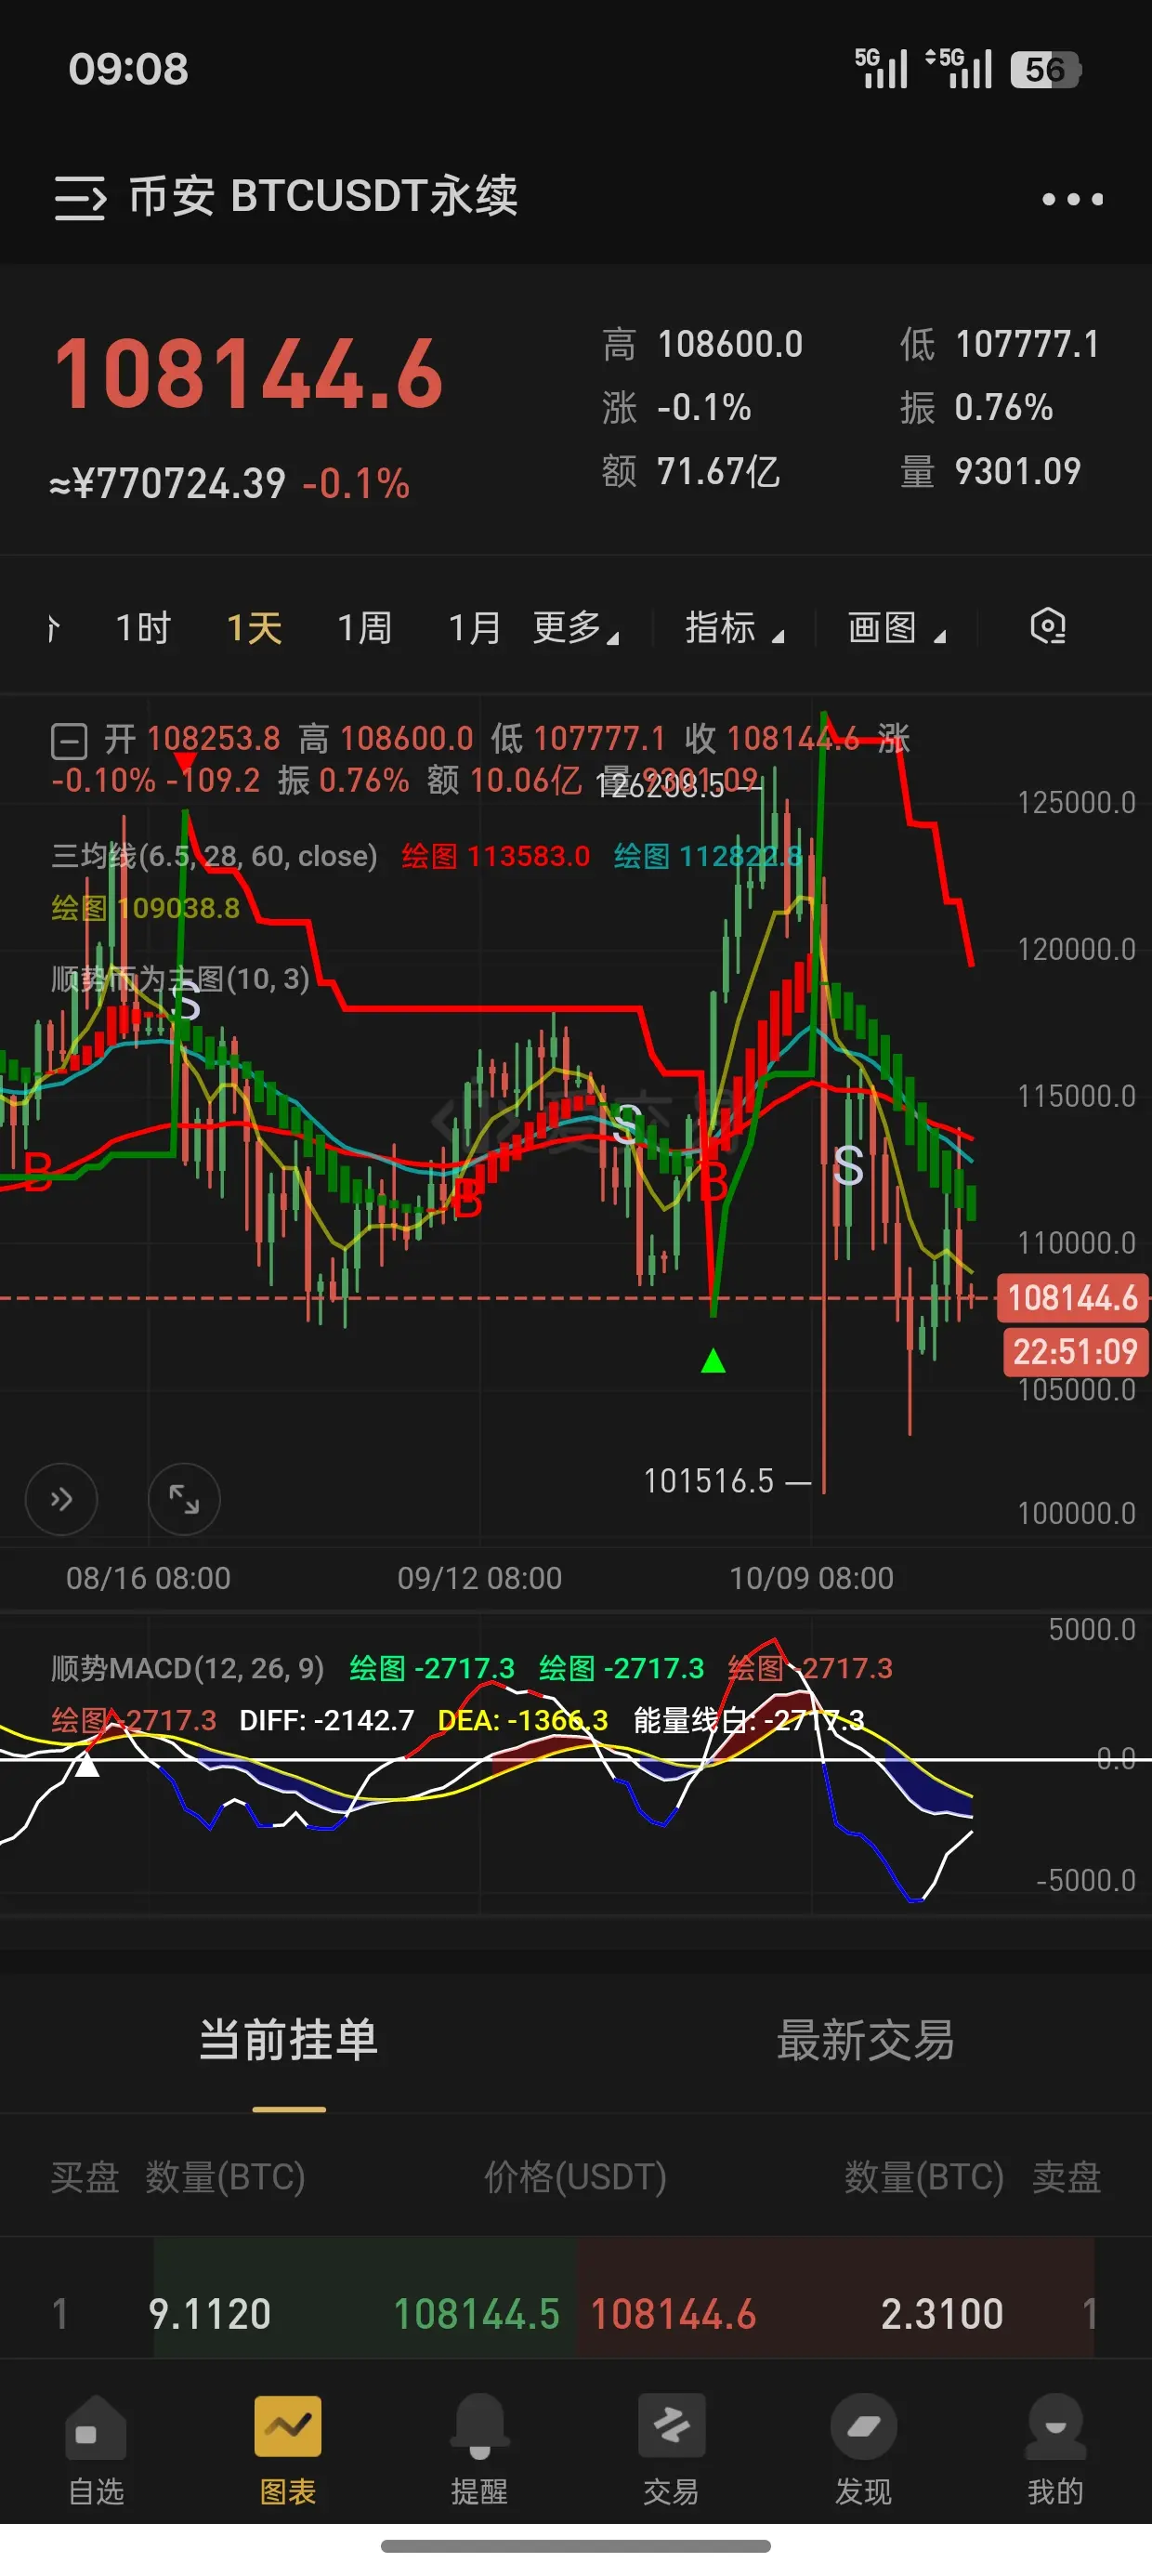
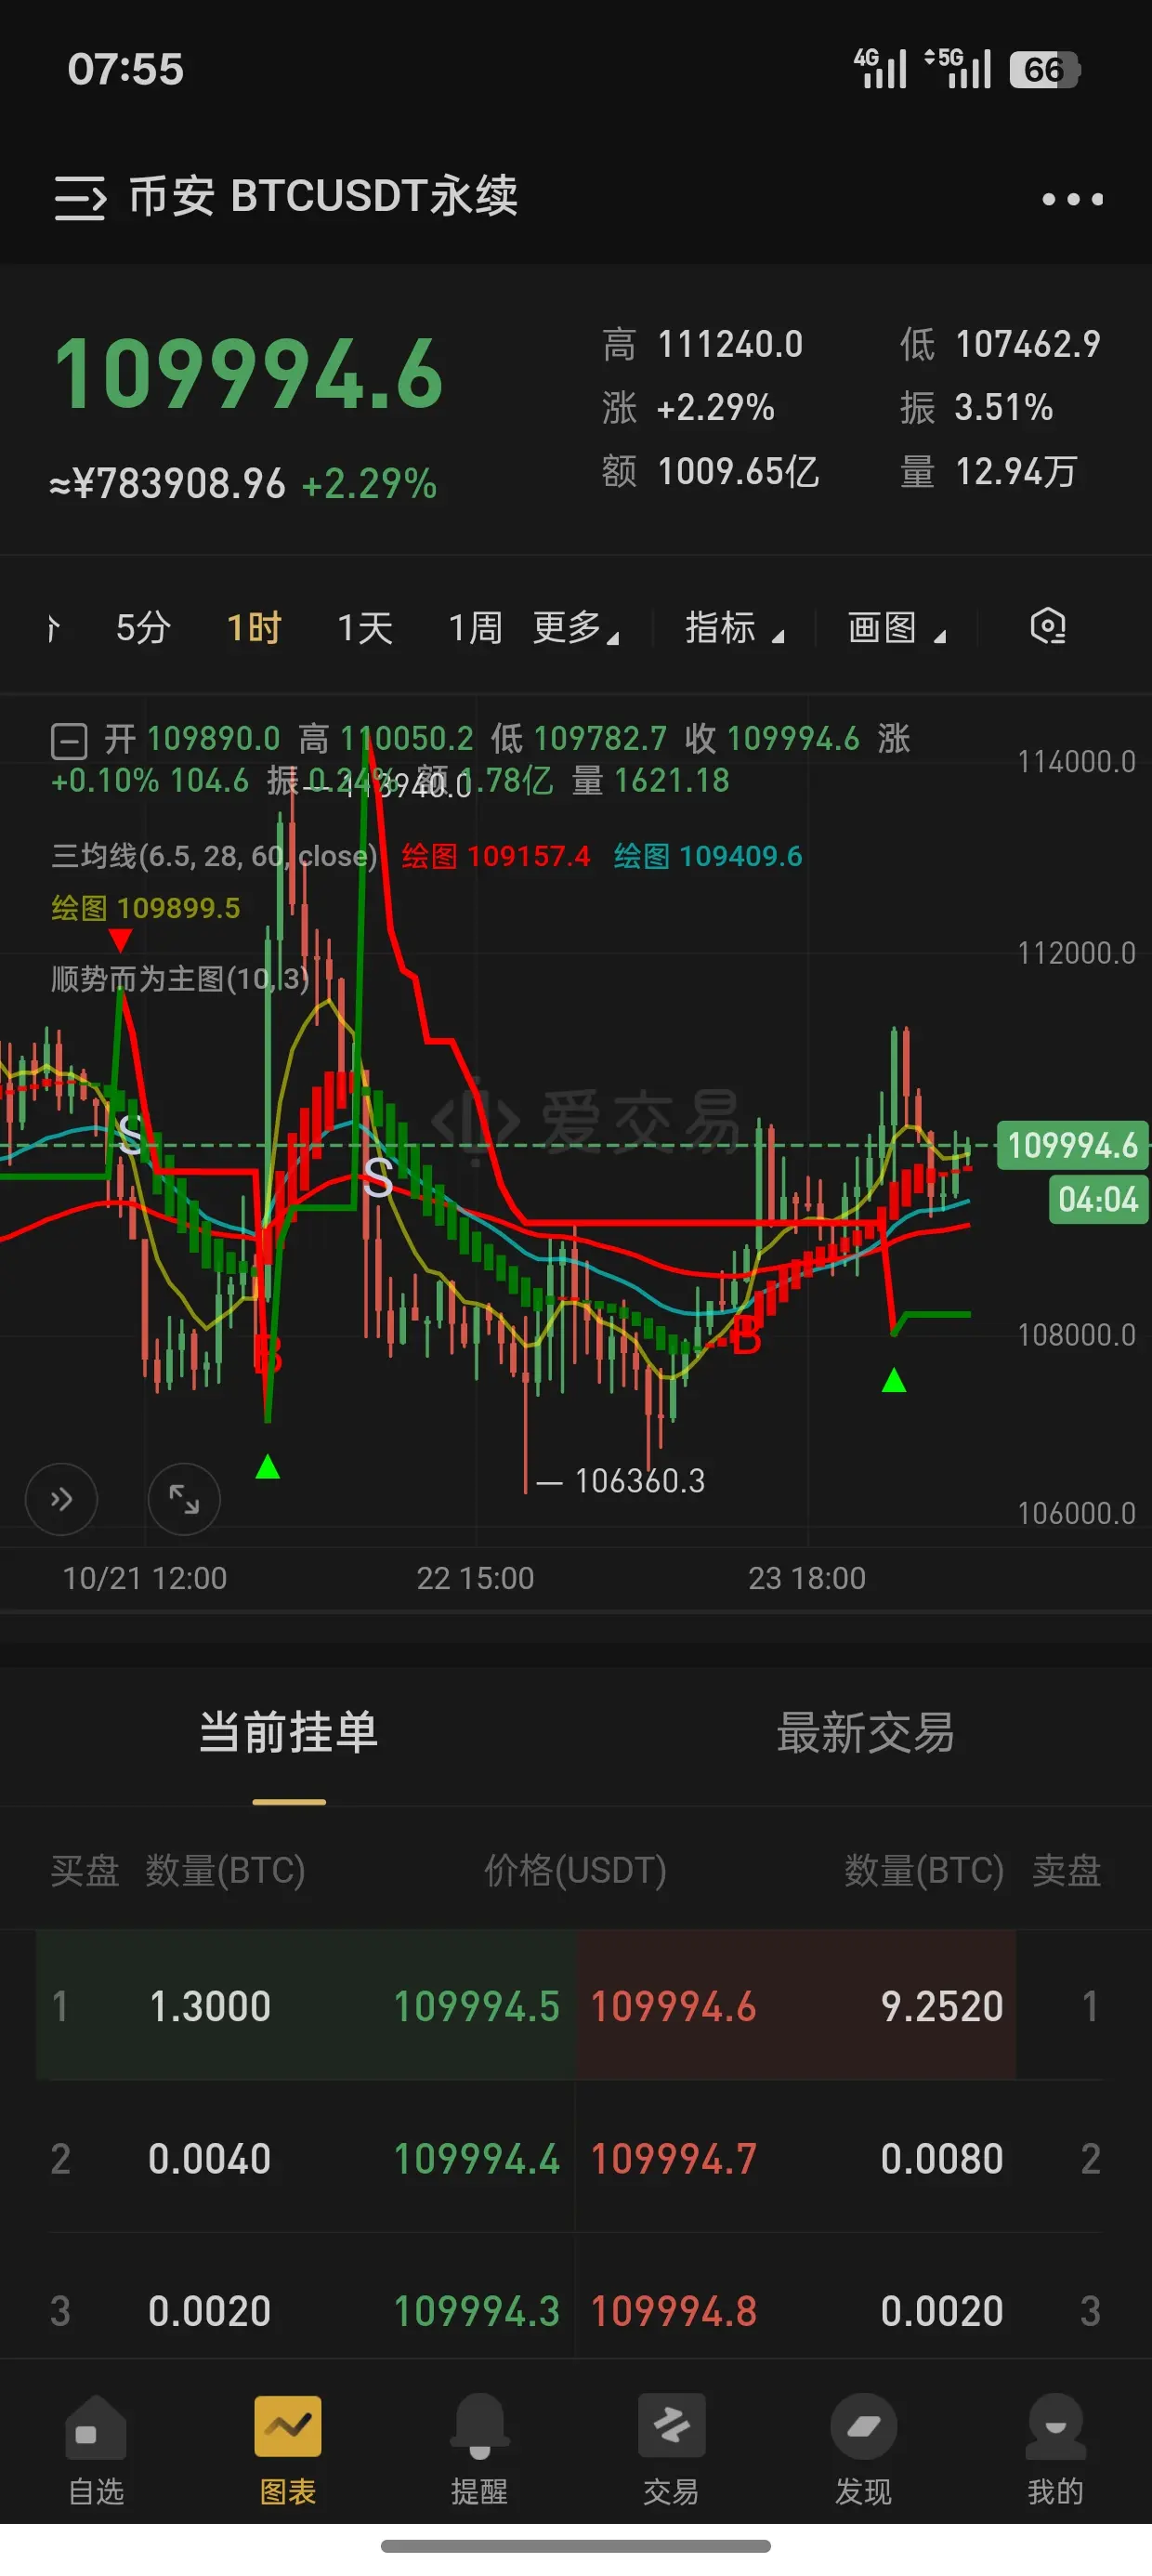
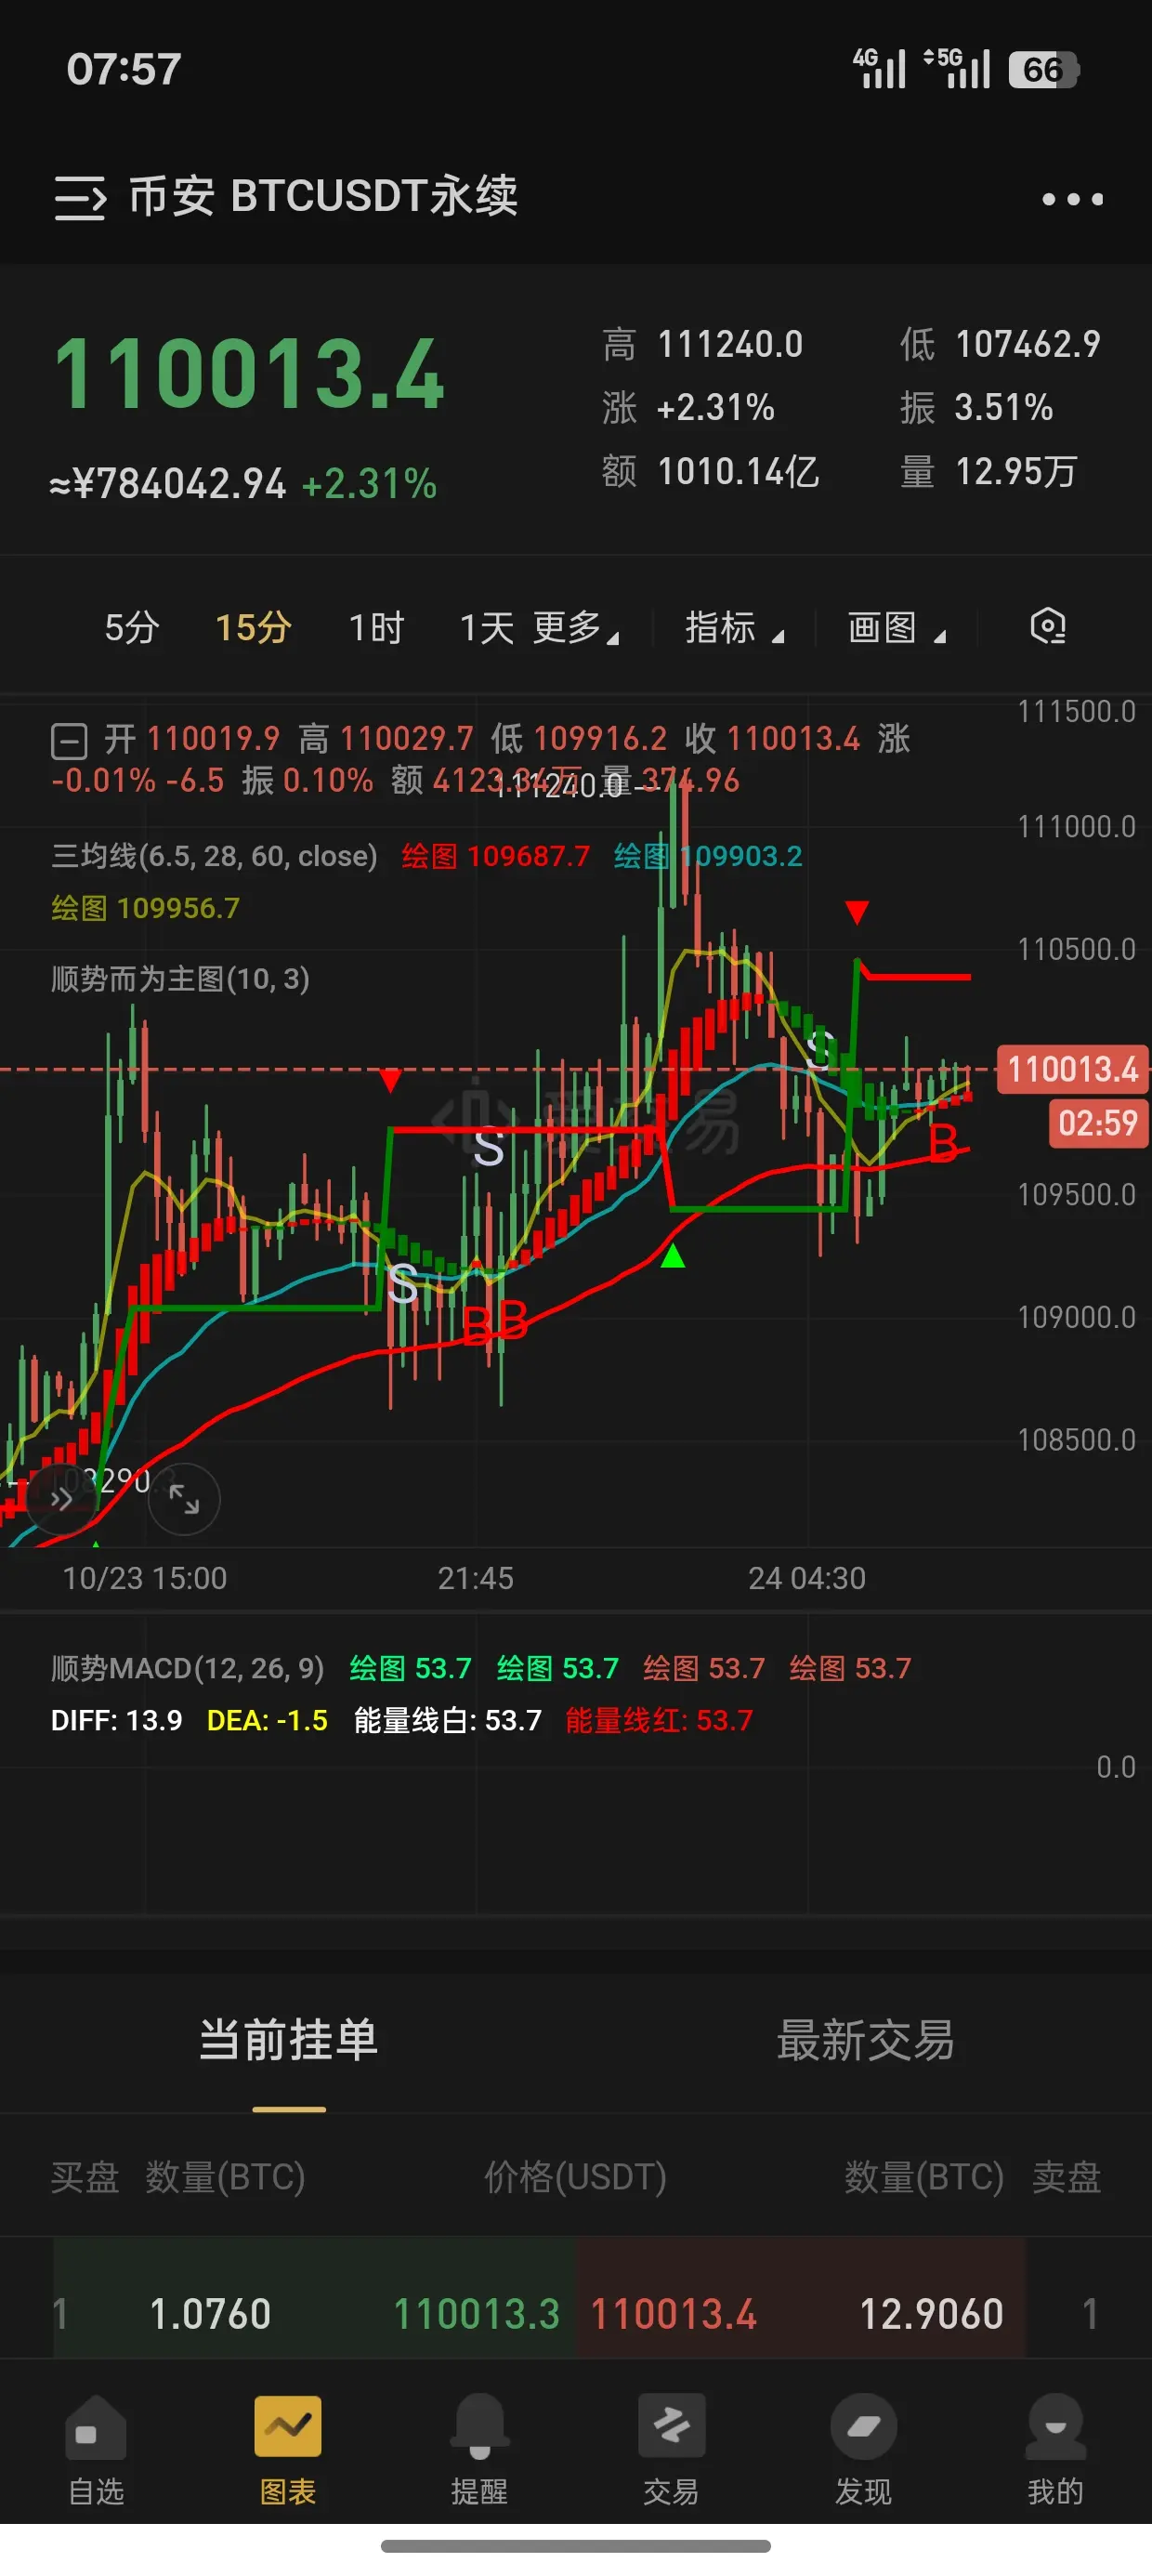
顺势而为才有福报
10-24 00:00
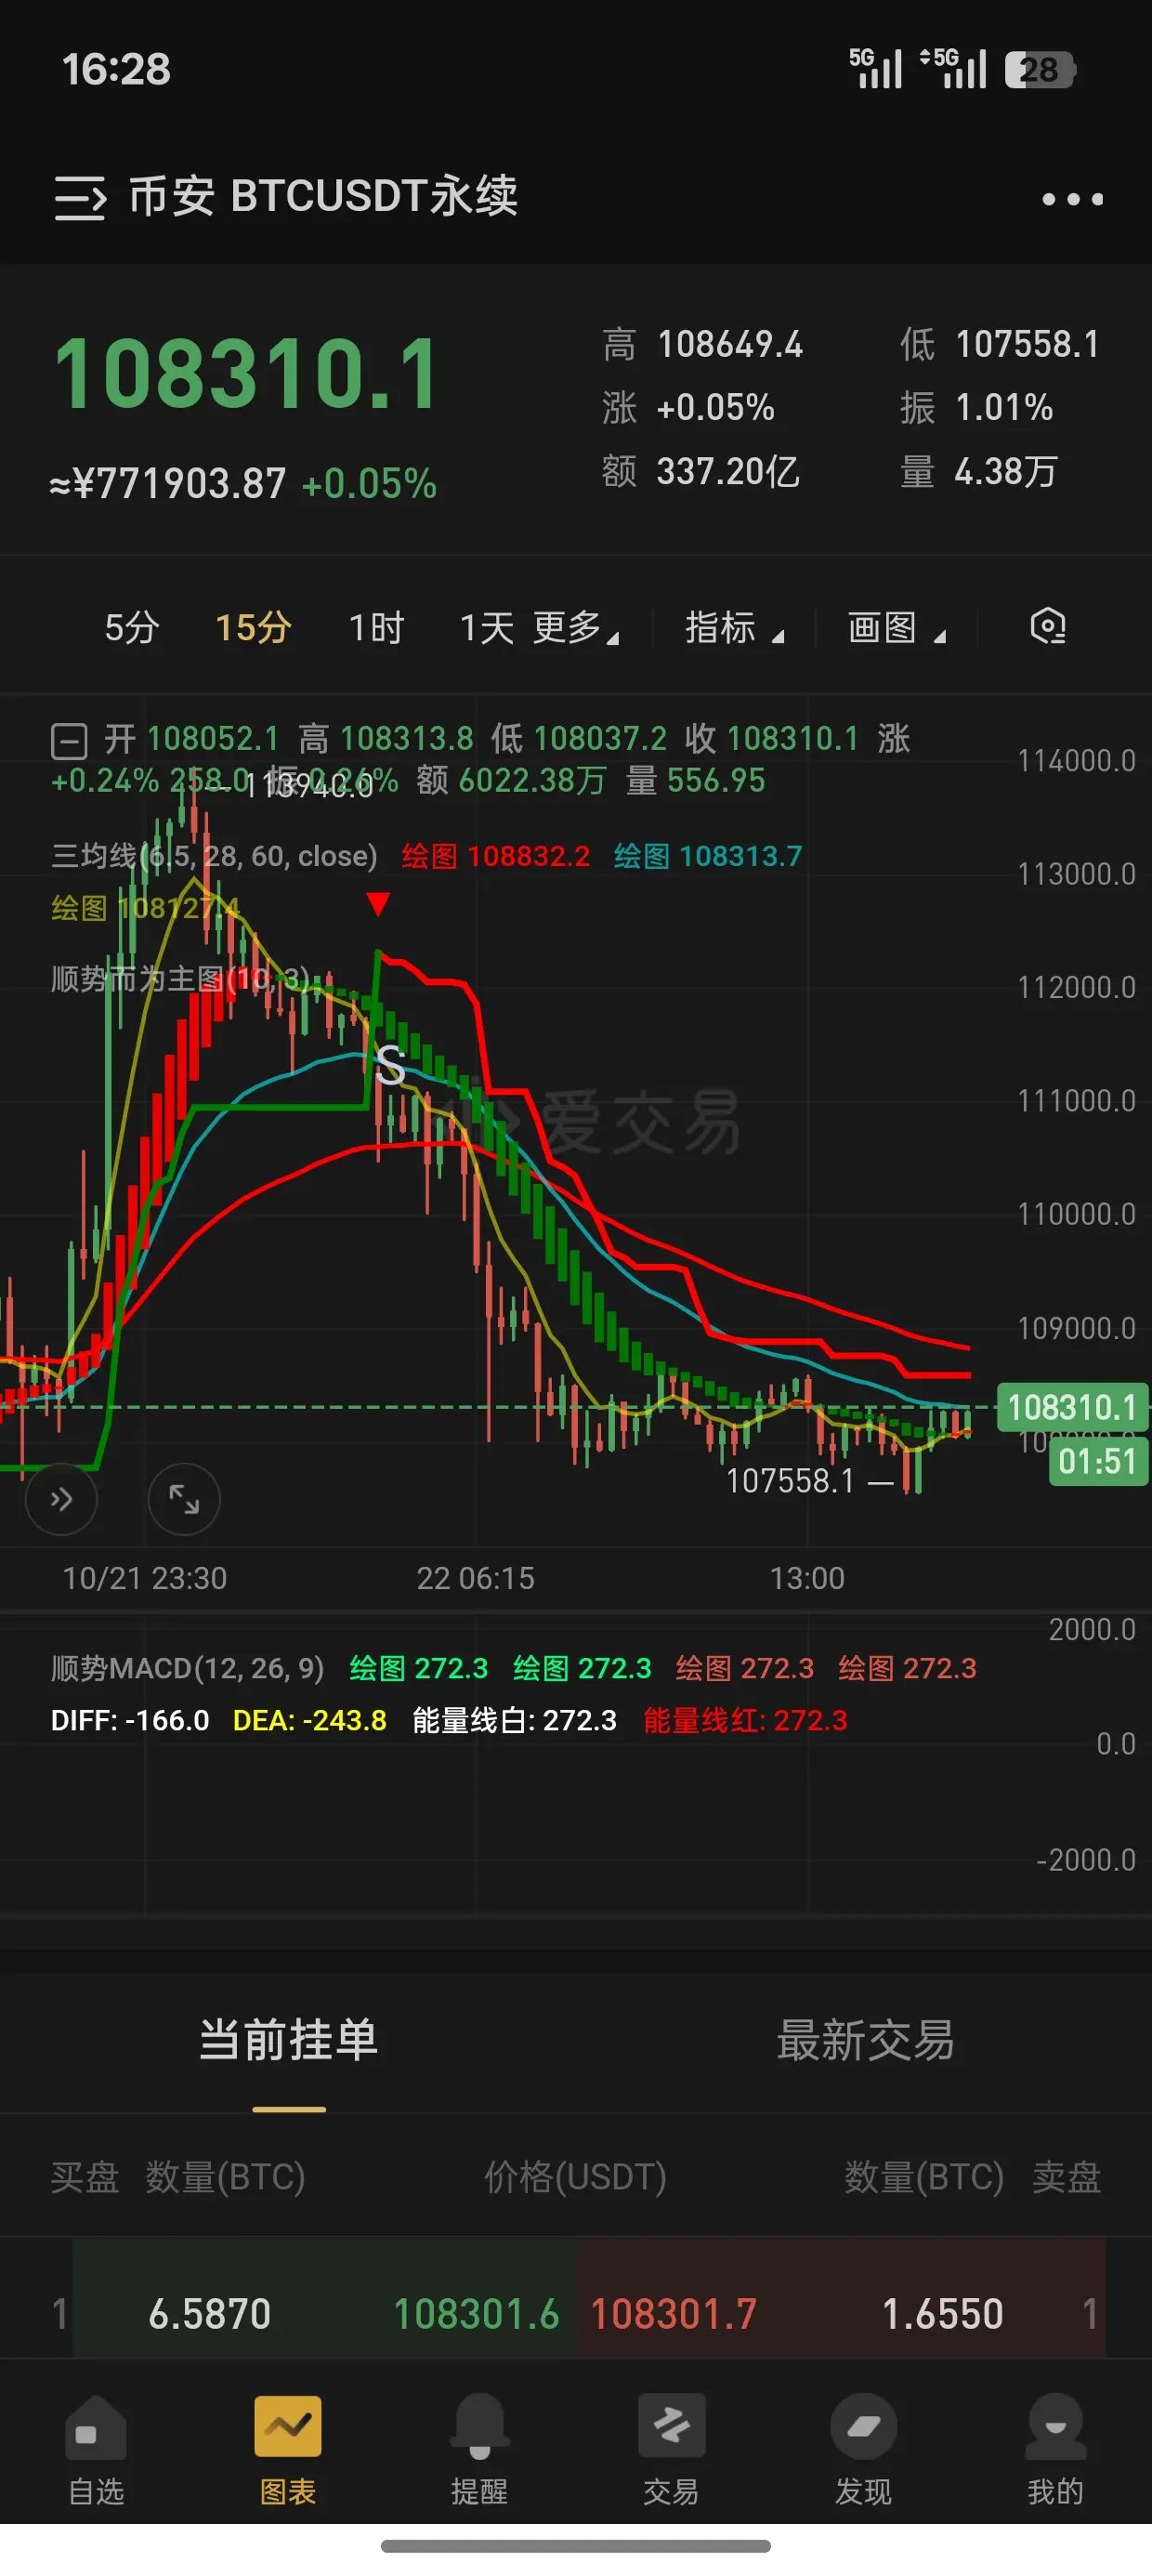
來看一下現在的行情,一小時色帶紅色,均線上方,多軍現在強勢,十五分鍾均線上方,色帶紅色,多頭強勢,多單爲主,空爲輔,到高位再去考慮空單,等反彈走完,可以在110800這個位置空單,你們怎麼看呢?評論區告訴我!
查看原文
【當前用戶分享了他的交易卡片,若想瞭解更多優質交易資訊,請到App端查看】
1人點讚了這條動態
讚賞
1
1
轉發
分享
顺势而为才有福报
:
來看一下現在的行情,一小時色帶紅色,均線上方,多軍現在強勢,十五分鍾均線上方,色帶紅色,多頭強勢,多單爲主,空爲輔,到高位再去考慮空單,等反彈走完,可以在110800這個位置空單,你們怎麼看呢?評論區告訴我!
顺势而为才有福报
11-15 08:46
$TNK
發幣真賺錢
TNK
-14.27%
查看原文
讚賞
點讚
留言
轉發
分享
顺势而为才有福报
11-14 08:01
$BDXN
這個幣就是一個項目,可以免費領的
BDXN
18.7%
查看原文
讚賞
點讚
留言
轉發
分享
顺势而为才有福报
11-14 08:00
$BDXN
誰多誰衝家
BDXN
18.7%
查看原文
讚賞
點讚
留言
轉發
分享
顺势而为才有福报
11-14 06:13
$BDXN
山寨只配空
BDXN
18.7%
1人點讚了這條動態
讚賞
1
留言
轉發
分享
顺势而为才有福报
10-24 00:33
#红牛交易巡回赛
讚賞
點讚
留言
轉發
分享
顺势而为才有福报
10-23 11:58
#红牛交易巡回赛
讚賞
點讚
留言
轉發
分享
顺势而为才有福报
10-23 07:48
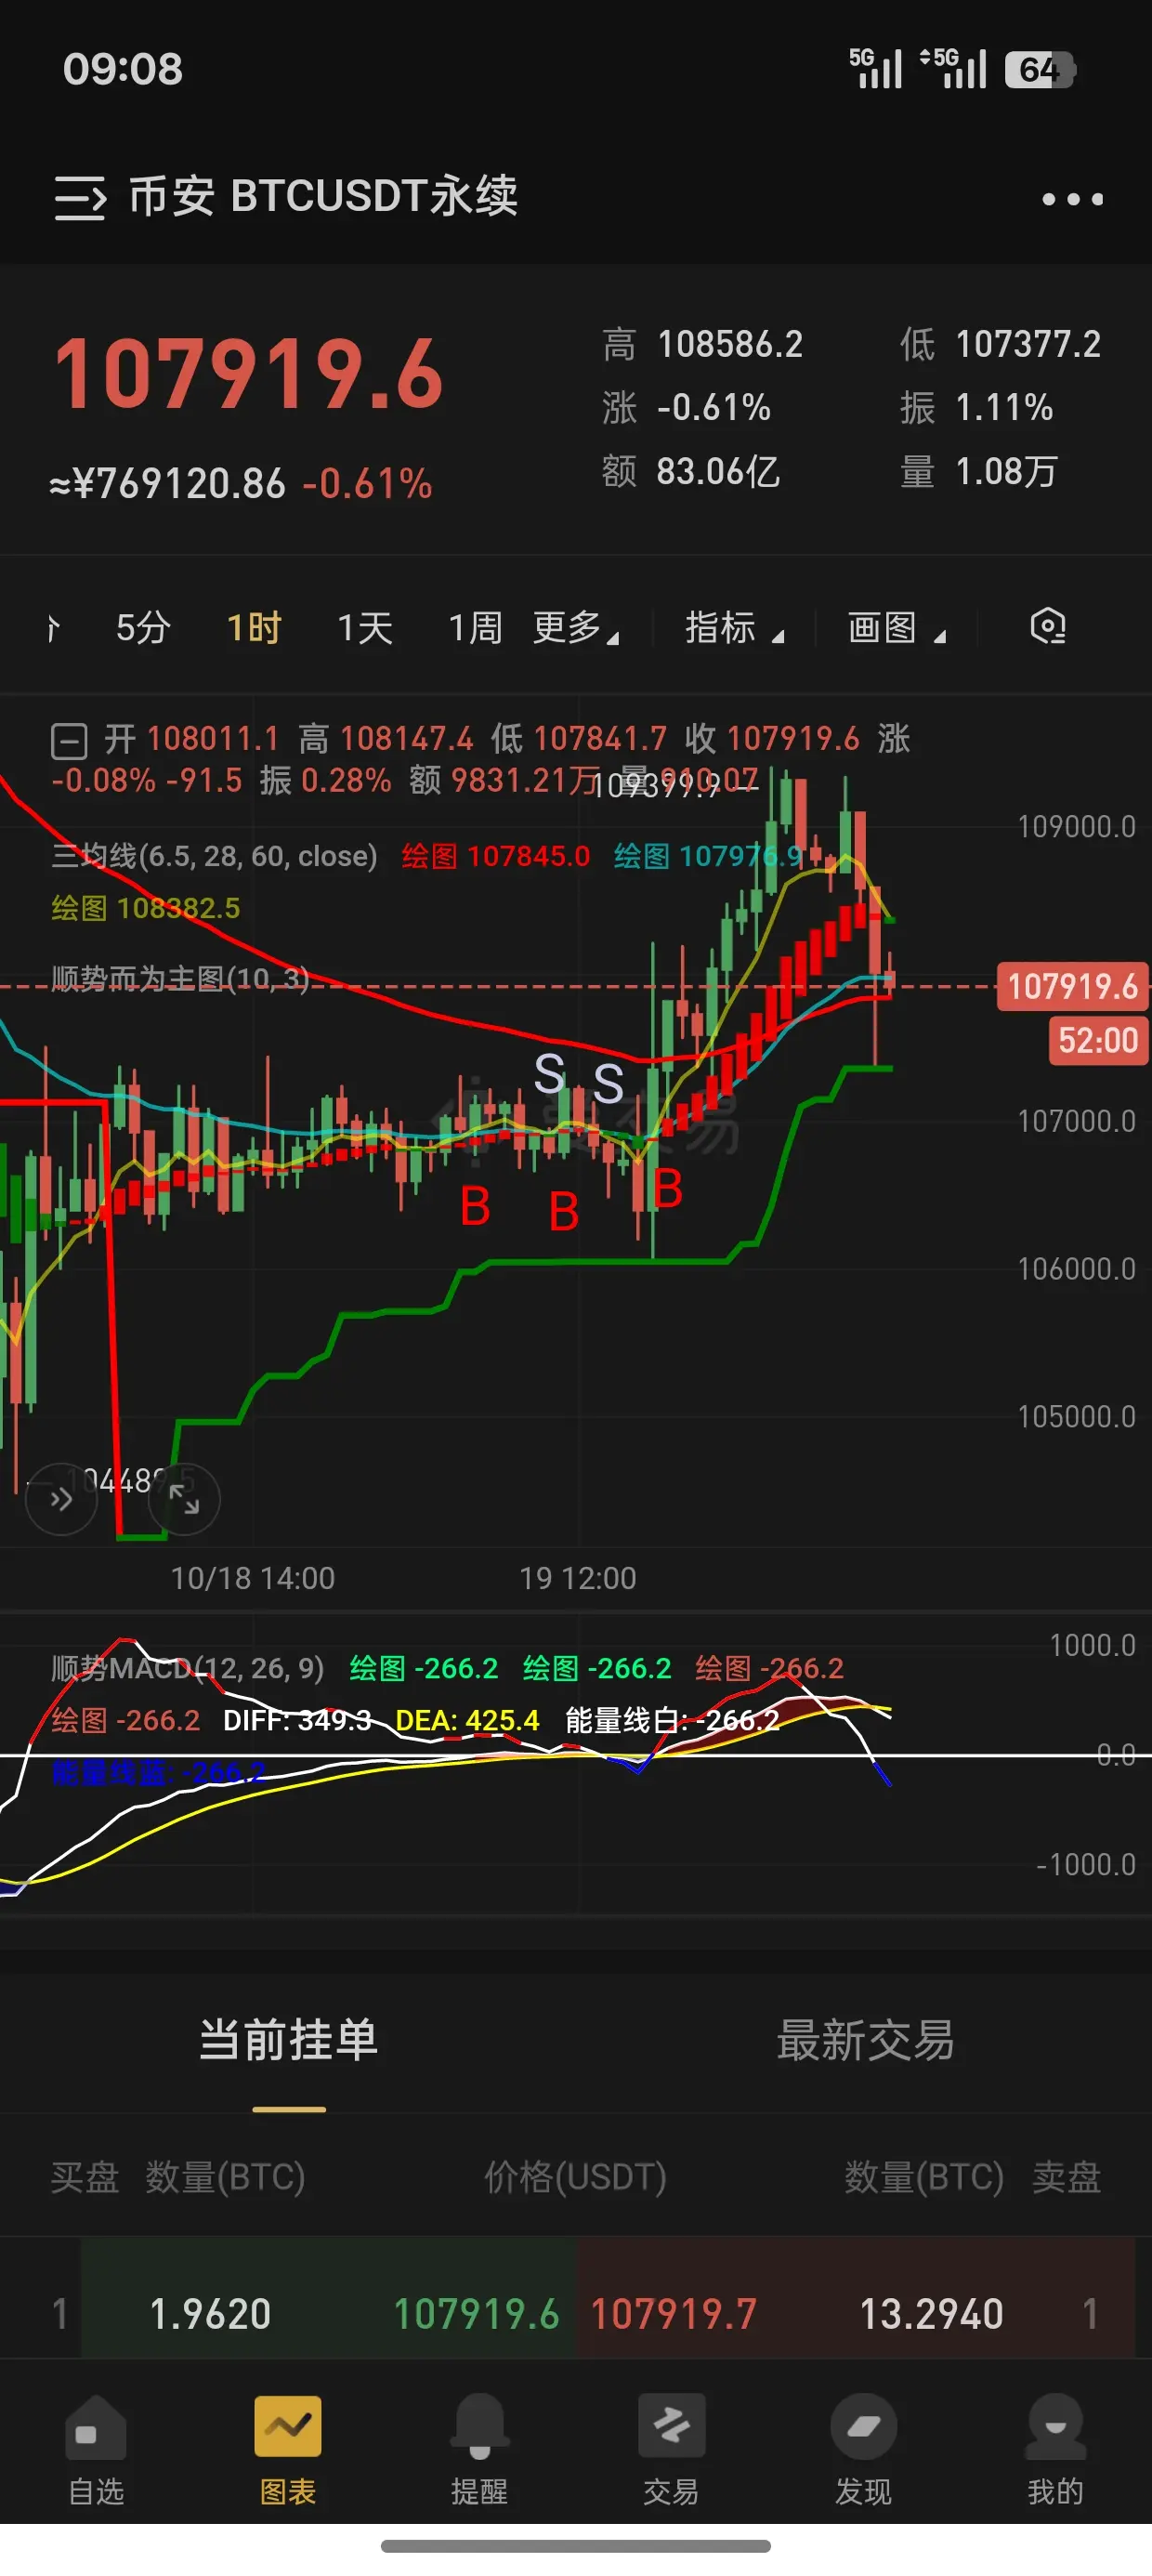
來看一下現在的行情,大餅一小時,均線上方,色帶紅色,反彈強勢,現在回踩支撐位,支撐住繼續漲,15分鍾色帶紅色,均線上方,反彈強勢,後續行情怎麼走?評論區告訴我你們的想法
BTC
-2.44%
查看原文
【當前用戶分享了他的交易卡片,若想瞭解更多優質交易資訊,請到App端查看】
1人點讚了這條動態
讚賞
1
1
轉發
分享
顺势而为才有福报
:
來看一下現在的行情,大餅一小時,均線上方,色帶紅色,反彈強勢,現在回踩支撐位,支撐住繼續漲,15分鍾色帶紅色,均線上方,反彈強勢,後續行情怎麼走?評論區告訴我你們的想法
顺势而为才有福报
10-23 00:33
來看一下今天的行情,一小時在均線的下方,色帶還是綠色,空頭還是挺強,15分鍾,均線形成交叉,色帶由綠色轉紅色,15分鍾有反彈的跡象,不破低點可以做多,破位止損!博一下反彈!你們怎麼看?評論區告訴我!!
查看原文
【當前用戶分享了他的交易卡片,若想瞭解更多優質交易資訊,請到App端查看】
1人點讚了這條動態
讚賞
1
1
轉發
分享
顺势而为才有福报
:
來看一下今天的行情,一小時在均線的下方,色帶還是綠色,空頭還是挺強,15分鍾,均線形成交叉,色帶由綠色轉紅色,15分鍾有反彈的跡象,不破低點可以做多,破位止損!博一下反彈!你們怎麼看?評論區告訴我!!
顺势而为才有福报
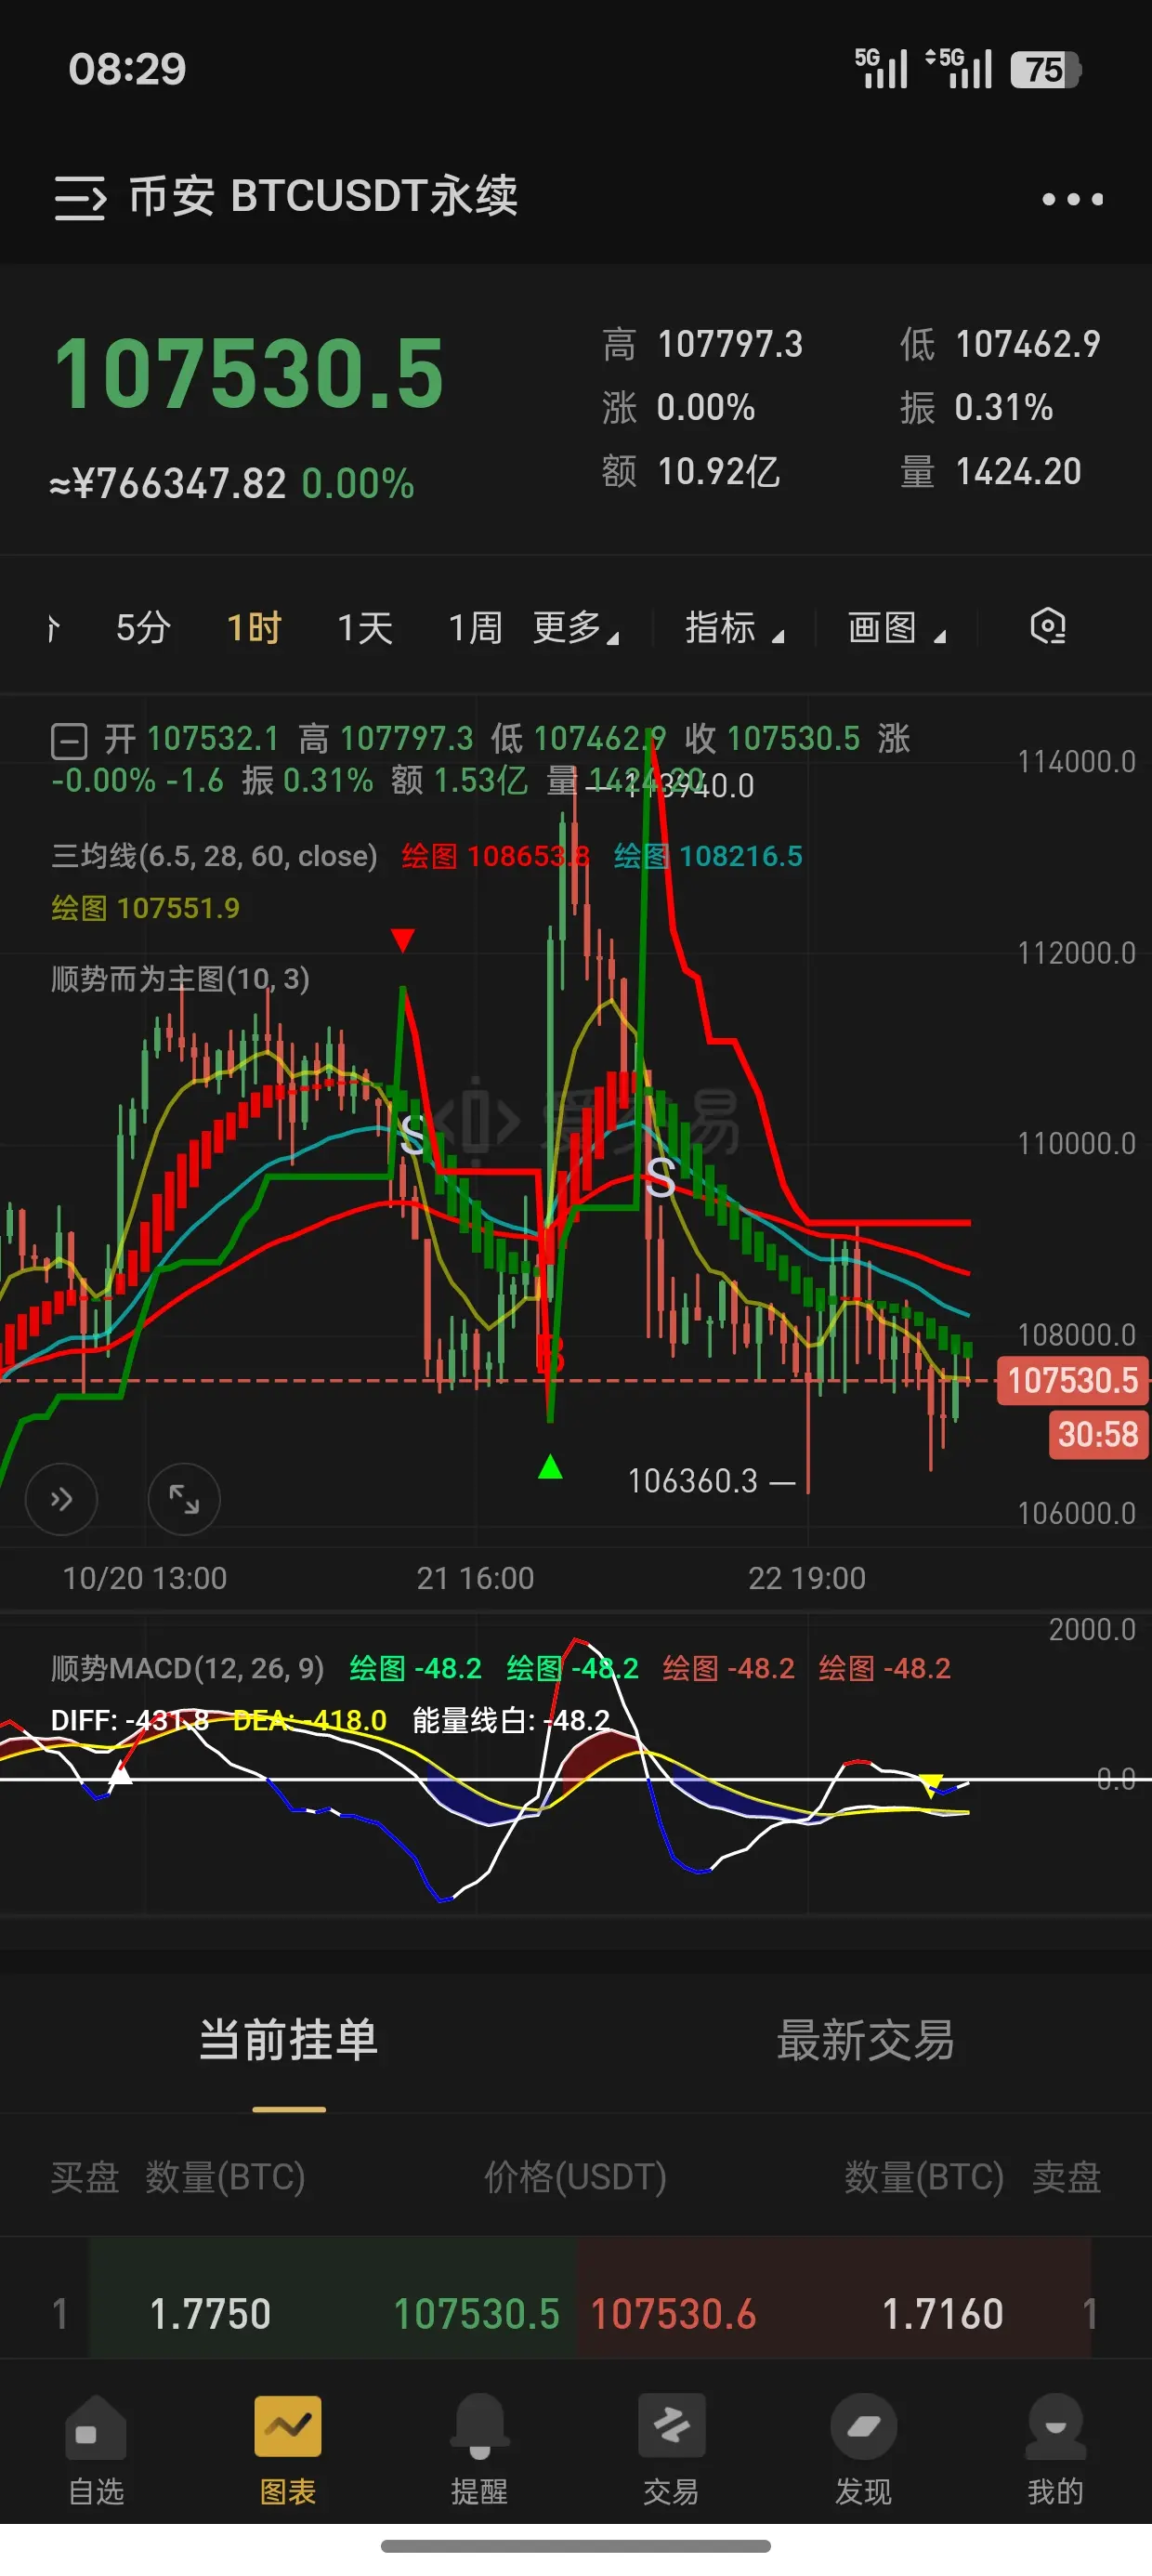
10-22 08:30
看看現在的行情吧!一小時在均線下方。色帶綠色,空頭還未改變,再來看看15分鍾的行情,在均線的下方,色帶有由綠色轉紅色的跡象,15分鍾有反彈!反彈空爲主!!
查看原文
【當前用戶分享了他的交易卡片,若想瞭解更多優質交易資訊,請到App端查看】
1人點讚了這條動態
讚賞
1
1
轉發
分享
顺势而为才有福报
:
看看現在的行情吧!一小時在均線下方。色帶綠色,空頭還未改變,再來看看15分鍾的行情,在均線的下方,色帶有由綠色轉紅色的跡象,15分鍾有反彈!反彈空爲主!!
顺势而为才有福报
10-22 01:11
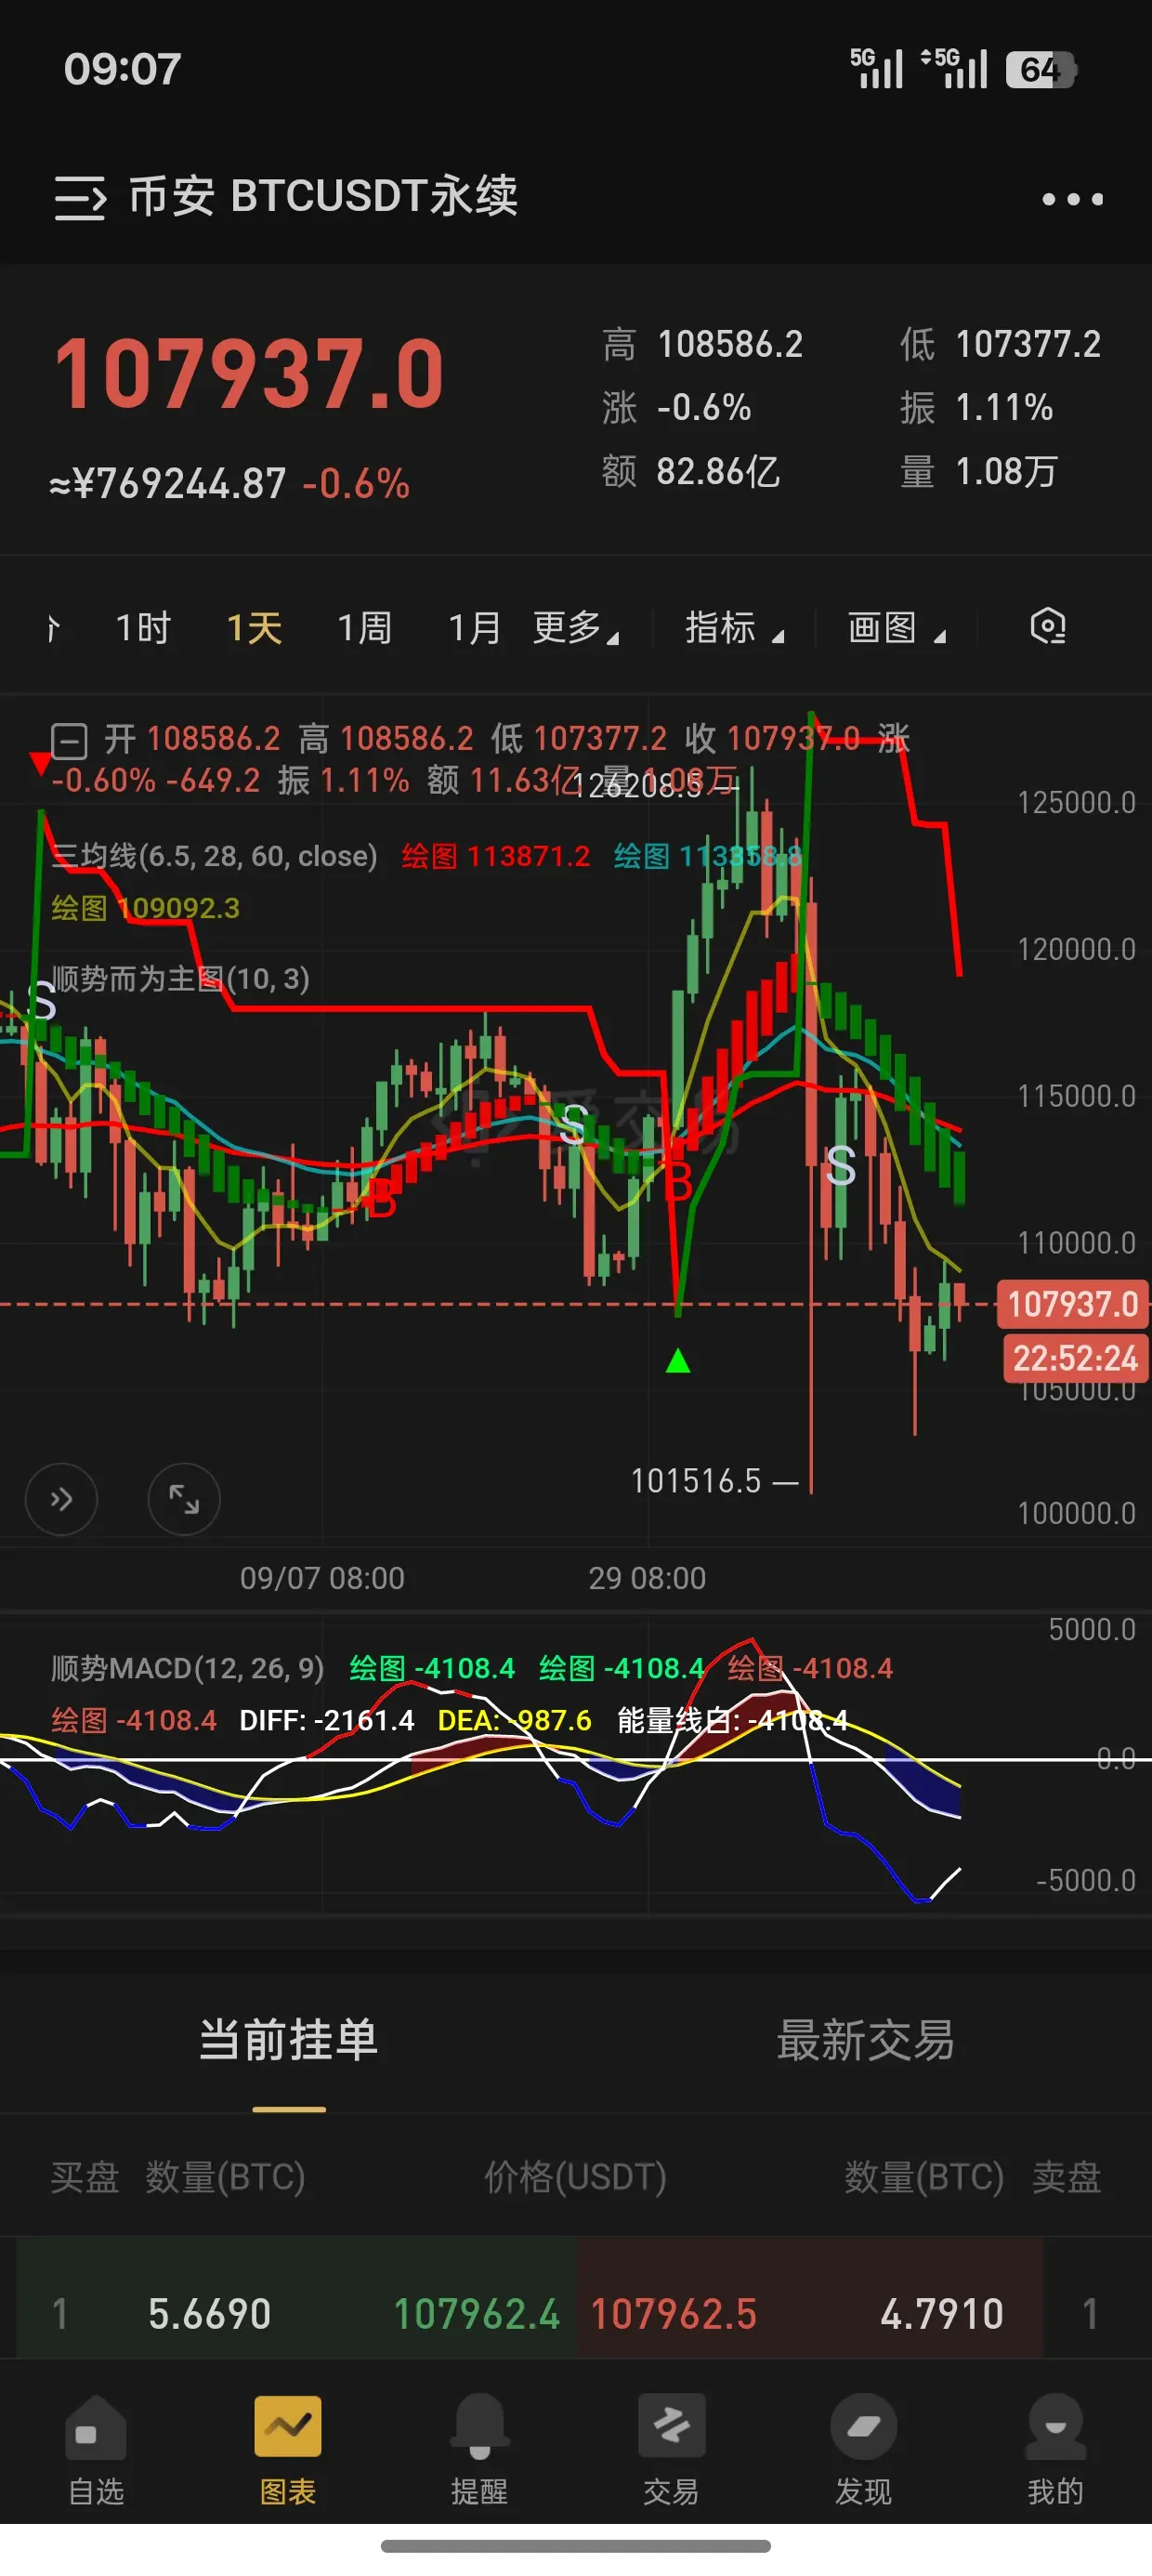
來看一下大餅的行情,大餅日線下方,色帶綠色,昨天反彈到均線壓制,空頭依然強勢,一小時均線下方,色帶綠色,反彈空爲主,不要想,反彈就是空,做多帶好止損!!切記
BTC
-2.44%
查看原文
【當前用戶分享了他的交易卡片,若想瞭解更多優質交易資訊,請到App端查看】
1人點讚了這條動態
讚賞
1
1
轉發
分享
顺势而为才有福报
:
來看一下大餅的行情,大餅日線下方,色帶綠色,昨天反彈到均線壓制,空頭依然強勢,一小時均線下方,色帶綠色,反彈空爲主,不要想,反彈就是空,做多帶好止損!!切記
顺势而为才有福报
10-21 00:22
我在12年老牌交易所Gate安全交易數字貨幣,快和我一起參與當下最熱活動吧!
https://www.gate.com/campaigns/site239?ref=VLNDVF4LVA&ref_type=132
查看原文
2人點讚了這條動態
讚賞
2
1
轉發
分享
顺势而为才有福报
:
今天的行情怎麼樣,你們怎麼看呢?😃😃😃
顺势而为才有福报
10-20 01:11
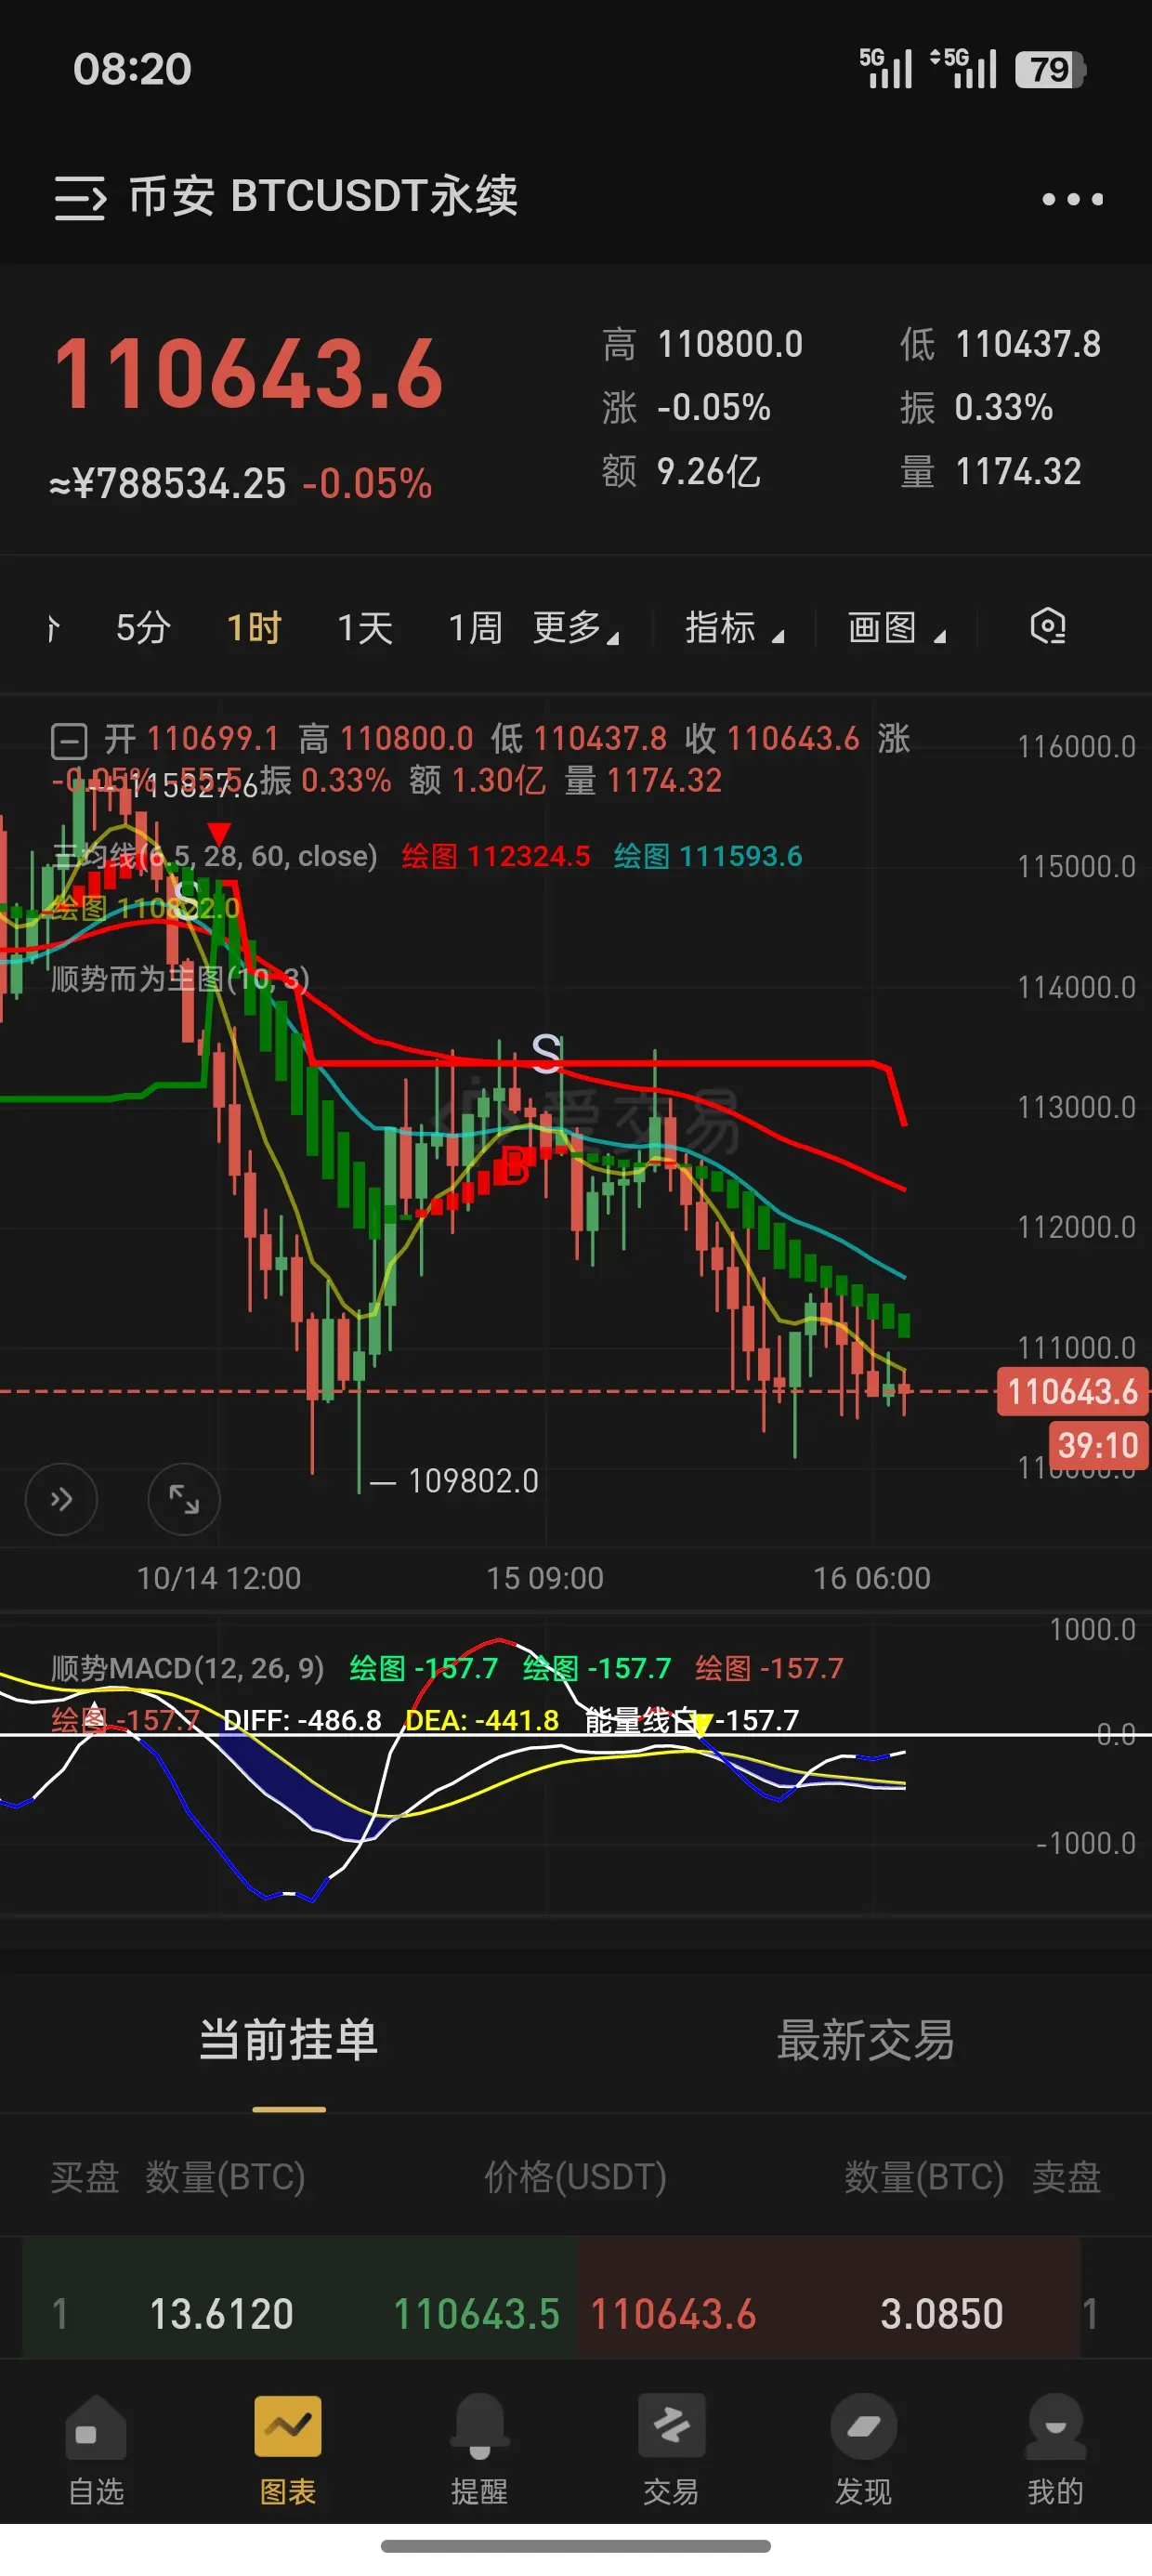
來看一下今天的行情,日線在均線下方,色帶綠色沒有改變,一小時回踩到支撐位,一小時色帶綠色形成,均線下方,15分鍾均線下方,色帶綠色,今日以反彈空爲主,高點止損,不破109500就一直空
查看原文
【當前用戶分享了他的交易卡片,若想瞭解更多優質交易資訊,請到App端查看】
1人點讚了這條動態
讚賞
1
1
轉發
分享
顺势而为才有福报
:
來看一下今天的行情,日線在均線下方,色帶綠色沒有改變,一小時回踩到支撐位,一小時色帶綠色形成,均線下方,15分鍾均線下方,色帶綠色,今日以反彈空爲主,高點止損,不破109500就一直空
顺势而为才有福报
10-17 00:26
昨天做空黃金,被安排的明明白白,還好帶了止損,不然就麻了!!
查看原文
【當前用戶分享了他的交易卡片,若想瞭解更多優質交易資訊,請到App端查看】
1人點讚了這條動態
讚賞
1
留言
轉發
分享
顺势而为才有福报
10-16 02:02
#晒出带单成就##速来!跟我赚钱##穩健帶單長線收益
#中美贸易战新进展
查看原文
【當前用戶分享了他的交易卡片,若想瞭解更多優質交易資訊,請到App端查看】
1人點讚了這條動態
讚賞
1
留言
轉發
分享
顺势而为才有福报
10-16 00:50
反彈空爲主,多爲輔,短多,長空
查看原文
【當前用戶分享了他的交易卡片,若想瞭解更多優質交易資訊,請到App端查看】
顺势而为才有福报
2025-10-16 00:24:45
來看一下今天的行情,大餅日線空頭趨勢沒有改變,均線下方,色帶綠色,一小時均線下方,色帶綠色。
1人點讚了這條動態
讚賞
1
留言
轉發
分享
顺势而为才有福报
10-16 00:24
來看一下今天的行情,大餅日線空頭趨勢沒有改變,均線下方,色帶綠色,一小時均線下方,色帶綠色。
BTC
-2.44%
查看原文
【當前用戶分享了他的交易卡片,若想瞭解更多優質交易資訊,請到App端查看】
2人點讚了這條動態
讚賞
2
1
1
分享
顺势而为才有福报
:
🤼♀️🤼♀️🤼♀️🤼♀️🤼♀️🤼♀️🤼♀️🤼♀️🤼♀️🤼♀️🤼♀️🤼♀️🤼♀️🤼♀️🤼♀️🤼♀️🤼♀️🤼♀️🤼♀️🤼♀️🤼♀️🤼♀️
顺势而为才有福报
09-11 14:08
#红牛交易巡回赛
讚賞
點讚
留言
轉發
分享
熱門話題
查看更多
熱門 Gate Fun
查看更多
最新發幣
即將上市
成功上市
置頂
網站地圖