51QuantitativeStrategy
التداول
نوع التداول
سوق فوریة
تداول العملات الرقمية بحرية
Alpha
نقاط
احصل على رموز مميزة واعدة من خلال تداول مبسّط على السلسلة
قبل الطرح في السوق
تداول عملات جديدة قبل إدراجها رسميًا
الالهامش
قم بتضخيم أرباحك باستخدام الرافعة المالية
التحويل وتداول الكتل
0 Fees
تداول بأي حجم بدون رسوم وانزلاق سعري
الرموز ذات الرافعة المالية
تداول صفقات الرافعة المالية بسهولة
العقود الآجلة
العقود الآجلة
مئات العقود تتم تسويتها بـ USDT أو BTC
الخیارات المتاحة
HOT
تداول خيارات الفانيلا على الطريقة الأوروبية
الحساب الموحد
زيادة كفاءة رأس المال إلى أقصى حد
التداول التجريبي
انطلاقة العقود الآجلة
استعد لتداول العقود الآجلة
أحداث مستقبلية
شارك في الفعاليات لربح مكافآت سخية
التداول التجريبي
استخدم الأموال الافتراضية لتجربة التداول بدون مخاطر
اكسب
إطلاق
CandyDrop
اجمع الحلوى لتحصل على توزيعات مجانية.
منصة الإطلاق
-التخزين السريع، واربح رموزًا مميزة جديدة محتملة!
HODLer Airdrop
احتفظ بـ GT واحصل على توزيعات مجانية ضخمة مجانًا
منصة الإطلاق
كن من الأوائل في الانضمام إلى مشروع التوكن الكبير القادم
نقاط Alpha
NEW
تداول الأصول على السلسلة واستمتع بمكافآت التوزيع المجاني!
نقاط العقود الآجلة
NEW
اكسب نقاط العقود الآجلة وطالب بمكافآت التوزيع المجاني
الاستثمار
الربح البسيط
اكسب فوائد من الرموز المميزة غير المستخدمة
الاستثمار التلقائي
استثمر تلقائيًا على أساس منتظم
الاستثمار المزدوج
اشترِ بسعر منخفض وبِع بسعر مرتفع لتحقيق أرباح من تقلبات الأسعار
التخزين الناعم
اكسب مكافآت مع التخزين المرن
استعارة واقتراض العملات
0 Fees
ارهن عملة رقمية واحدة لاقتراض عملة أخرى
مركز الإقراض
منصة الإقراض الشاملة
مركز ثروة VIP
إدارة الثروات المخصصة تمكّن نمو أصولك
إدارة الثروات الخاصة من
إدارة أصول مخصصة لتنمية أصولك الرقمية
الصندوق الكمي
يساعدك فريق إدارة الأصول المحترف على تحقيق الأرباح بسهولة
التكديس
قم بتخزين العملات الرقمية للحصول على أرباح في منتجات إثبات الحصة
تخزين BTC
HOT
خزّن BTC واربح 10% معدل مئوي سنوي
سكّ GUSD
استخدم USDT/USDC لسكّ GUSD للحصول على عوائد بمستوى الخزانة
المزيد
51QuantitativeStrategy
تجار المال الرقمي الكمي لبيتكوين وإثيريوم، يركزون على تداول العملات الرئيسية مثل BTC وETH وSOL، من خلال بوتات التداول الكمي لالتقاط الاتجاهات الصاعدة والهابطة في الوقت الفعلي، وتحقيق أرباح مستقرة!
- أعجبني
- 1
- تعليق
- إعادة النشر
- مشاركة
2025/12/12 $ETH 4ساعة مستوى في مرحلة تصحيحية صحية بعد ارتفاع، المؤشرات الفنية تتعافى بشكل جيد، والاتجاه الصاعد يسيطر. يجب على المتداولين التركيز على اختراق الدعم عند 3180 والمقاومة عند 3280، حيث سيحدد ذلك الاتجاه الرئيسي للمرحلة التالية.
نصائح التداول (للمراجعة فقط)
استراتيجية الشراء: إذا تجاوز السعر بكميات كبيرة مستوى 3280، فذلك إشارة إلى انتهاء التصحيح وعودة الارتفاع، ويمكن النظر في المتابعة، مع هدف عند 3330 و3435. يمكن وضع وقف الخسارة عند أدنى مستوى للشمعة التي اخترقت أو أقل من 3215.
استراتيجية البيع: إذا انخفض السعر بشكل فعال دون مستوى 3180 (مثل إغلاق الساعة 4 أسفل هذا المستوى)، ف
ETH-3.59%
- أعجبني
- 1
- تعليق
- إعادة النشر
- مشاركة
2025/12/12 $BTC الحالي في نطاق تذبذب مرتفع، يُنصح بالبيع عند القمم و الشراء عند القيعان ضمن نطاق 91500-94000، ومتابعة اختراقات النطاق عن كثب. إذا تم الاختراق الصاعد ل94500، يتوقع ارتفاع، وإذا تم الاختراق الهابط ل91500، يجب الحذر من زيادة التصحيح. نظرًا لتضاؤل حجم الشموع الأخيرة بشكل كبير، فهذا يدل على قرب ظهور خيار توجيهي، لذا يرجى متابعة حجم الشموع القادمة عن كثب.
المقاومات الرئيسية العلوية:
المقاومة 1: 93800 94000: منطقة الضغط الناتجة عن قمة الارتداد الأخيرة، وهي أيضًا نقطة نفسية.
المقاومة 2: 94500 94800: أعلى نقطة في هذا الارتداد، وهي مقاومة قوية. الاختراق الفعلي لهذه المنط
المقاومات الرئيسية العلوية:
المقاومة 1: 93800 94000: منطقة الضغط الناتجة عن قمة الارتداد الأخيرة، وهي أيضًا نقطة نفسية.
المقاومة 2: 94500 94800: أعلى نقطة في هذا الارتداد، وهي مقاومة قوية. الاختراق الفعلي لهذه المنط
BTC0.08%
- أعجبني
- إعجاب
- تعليق
- إعادة النشر
- مشاركة
- أعجبني
- إعجاب
- تعليق
- إعادة النشر
- مشاركة
$BTC من المحتمل أن يستمر السوق في نطاق تقلب واسع بين 89000 و 94500.
يوصى بمراقبة استجابة السعر عند مستويات الدعم/المقاومة الرئيسية، بالإضافة إلى مدى تمكن MACD من إعادة التقاطع الصاعد فوق الصفر أو RSI من الدخول في منطقة بيع مفرط وتكوين اختلاف قاع، للبحث عن إشارات لاتجاه الموجة التالية. التوصية الحالية هي بالتزام الصبر أو التداول داخل النطاق من خلال الشراء عند القيعان والبيع عند القمم (بحجم صغير، مع وضع أوامر وقف خسارة).
شاهد النسخة الأصليةيوصى بمراقبة استجابة السعر عند مستويات الدعم/المقاومة الرئيسية، بالإضافة إلى مدى تمكن MACD من إعادة التقاطع الصاعد فوق الصفر أو RSI من الدخول في منطقة بيع مفرط وتكوين اختلاف قاع، للبحث عن إشارات لاتجاه الموجة التالية. التوصية الحالية هي بالتزام الصبر أو التداول داخل النطاق من خلال الشراء عند القيعان والبيع عند القمم (بحجم صغير، مع وضع أوامر وقف خسارة).
- أعجبني
- 1
- تعليق
- إعادة النشر
- مشاركة
$SOL الفاصل الزمني 4 ساعات في حالة تذبذب عند مستويات مرتفعة. يجب على المتداولين مراقبة النطاق الواسع بين 132-146 دولار، ويمكن التفكير في البيع عند القمم والشراء عند القيعان داخل هذا النطاق، مع ضرورة وضع أوامر وقف الخسارة بشكل صارم. اختراق أي طرف من النطاق سيحدد الاتجاه الواضح التالي. حالياً، يميل شعور السوق إلى الترقب في انتظار محفز جديد. #SOL
SOL-0.18%
- أعجبني
- إعجاب
- تعليق
- إعادة النشر
- مشاركة
#ETH في مرحلة تصحيح/تذبذب صحي ضمن اتجاه صاعد. من ناحية التداول، يمكن مراقبة أداء منطقة الدعم 3250-3280، فإذا تمكن السعر من الثبات هناك مع زيادة في حجم التداول، ستكون فرصة جيدة للدخول أو تعزيز صفقات الشراء. يمكن وضع وقف الخسارة أسفل منطقة الدعم 3180-3200. وفي الاتجاه الصاعد يجب متابعة اختراق منطقة المقاومة 3360-3400 عن كثب، وإذا تم الاختراق يمكن استهداف مستوى أعلى عند 3500 دولار. أما إذا كسر السعر مستوى 3100 دولار بحجم تداول مرتفع، فيجب إعادة تقييم الاتجاه.
ETH-3.59%
- أعجبني
- إعجاب
- تعليق
- إعادة النشر
- مشاركة
$BTC في نقطة حاسمة لتحديد الاتجاه. تحسن مؤشر MACD على المدى القصير يوفر أملاً في الارتداد، لكن من الضروري أن يخترق السعر منطقة المقاومة بين 91500-92000 مع زيادة في حجم التداول لتأكيد استئناف الاتجاه الصاعد. وعلى العكس، إذا فقد السعر دعم 89300-89600، فقد يتجه مرة أخرى للبحث عن دعم عند الحد السفلي للنطاق العرضي. قبل حدوث اختراق واضح في أي اتجاه، يُنصح باتباع استراتيجية البيع عند الارتفاع والشراء عند الانخفاض والتركيز الشديد على تغيرات حجم التداول.
#BTC #ETH #SOL
#BTC #ETH #SOL
BTC0.08%
- أعجبني
- إعجاب
- تعليق
- إعادة النشر
- مشاركة
$SOL في ظل حالة التذبذب الحالية في السوق، من المناسب فتح صفقات شراء بالقرب من مناطق الدعم، وفتح صفقات بيع بالقرب من مناطق المقاومة، مع وضع أوامر وقف الخسارة بشكل صارم.
المقاومات الرئيسية:
1. 144: منطقة تداخل متوسطات EMA.
2. 146.91: أعلى نقطة في موجة الصعود الحالية.
الدعوم الرئيسية:
1. 138: منطقة ارتداد السعر عدة مرات مؤخراً.
2. 135-136: خط الدفاع الرئيسي للمشترين.
3. 130.00 (حاجز نفسي)
المقاومات الرئيسية:
1. 144: منطقة تداخل متوسطات EMA.
2. 146.91: أعلى نقطة في موجة الصعود الحالية.
الدعوم الرئيسية:
1. 138: منطقة ارتداد السعر عدة مرات مؤخراً.
2. 135-136: خط الدفاع الرئيسي للمشترين.
3. 130.00 (حاجز نفسي)
SOL-0.18%
- أعجبني
- إعجاب
- تعليق
- إعادة النشر
- مشاركة
#ETH حالياً في اتجاه تذبذب عند مستويات مرتفعة. بعد انتعاش قوي، ضعف الزخم الصعودي ودخل السوق في مرحلة تصحيح. يجب متابعة اختراق منطقة الدعم بين 3060-3080 دولار ومنطقة المقاومة بين 3220-3250 دولار عن كثب.
إذا تم كسر مستوى 3060 دولار بحجم تداول كبير، فقد يبدأ تصحيح أعمق.
إذا تم اختراق مستوى 3250 دولار بحجم تداول كبير، فقد يُستأنف الاتجاه الصاعد.
خلال الحركة ضمن النطاق، يمكن التفكير في البيع عند الارتفاع والشراء عند الانخفاض، مع ضرورة التحكم الصارم في حجم الصفقات.
إذا تم كسر مستوى 3060 دولار بحجم تداول كبير، فقد يبدأ تصحيح أعمق.
إذا تم اختراق مستوى 3250 دولار بحجم تداول كبير، فقد يُستأنف الاتجاه الصاعد.
خلال الحركة ضمن النطاق، يمكن التفكير في البيع عند الارتفاع والشراء عند الانخفاض، مع ضرورة التحكم الصارم في حجم الصفقات.
ETH-3.59%
- أعجبني
- 1
- تعليق
- إعادة النشر
- مشاركة
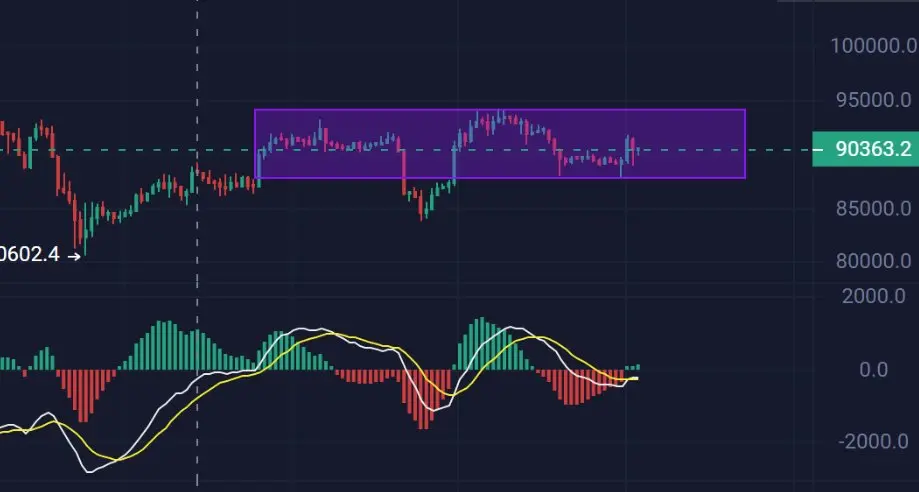
2025/12/08 $BTC الفاصل الزمني 4 ساعات في مرحلة حاسمة من الصراع بين الشراء والبيع، على المدى القصير يميل إلى التذبذب، على المضاربين بالارتفاع مراقبة اختراق مستوى 92,500 دولار والثبات فوقه؛ وعلى المضاربين بالهبوط مراقبة كسر دعم 89,000 دولار بفعالية مع زيادة في حجم التداول. #BTC #ETH #SOL
BTC0.08%
- أعجبني
- إعجاب
- تعليق
- إعادة النشر
- مشاركة
2025/12/08 $ETH المستوى الزمني 4 ساعات عند نقطة مفصلية لاختيار الاتجاه، وقبل حدوث اختراق واضح لنطاق التذبذب، يُنصح بالتعامل مع السوق على أساس التذبذب، بالبيع عند الارتفاع والشراء عند الانخفاض، مع ضرورة التحكم الصارم في المخاطر.
مستوى المقاومة: 3145-3200
مستوى الدعم: 3000، 2745 (نقطة الانطلاق المنخفضة لهذه الموجة الصاعدة، وهي خط الحياة للاتجاه المتوسط والطويل الأجل)
#BTC #ETH #SOL
شاهد النسخة الأصليةمستوى المقاومة: 3145-3200
مستوى الدعم: 3000، 2745 (نقطة الانطلاق المنخفضة لهذه الموجة الصاعدة، وهي خط الحياة للاتجاه المتوسط والطويل الأجل)
#BTC #ETH #SOL
- أعجبني
- إعجاب
- تعليق
- إعادة النشر
- مشاركة
- أعجبني
- إعجاب
- تعليق
- إعادة النشر
- مشاركة
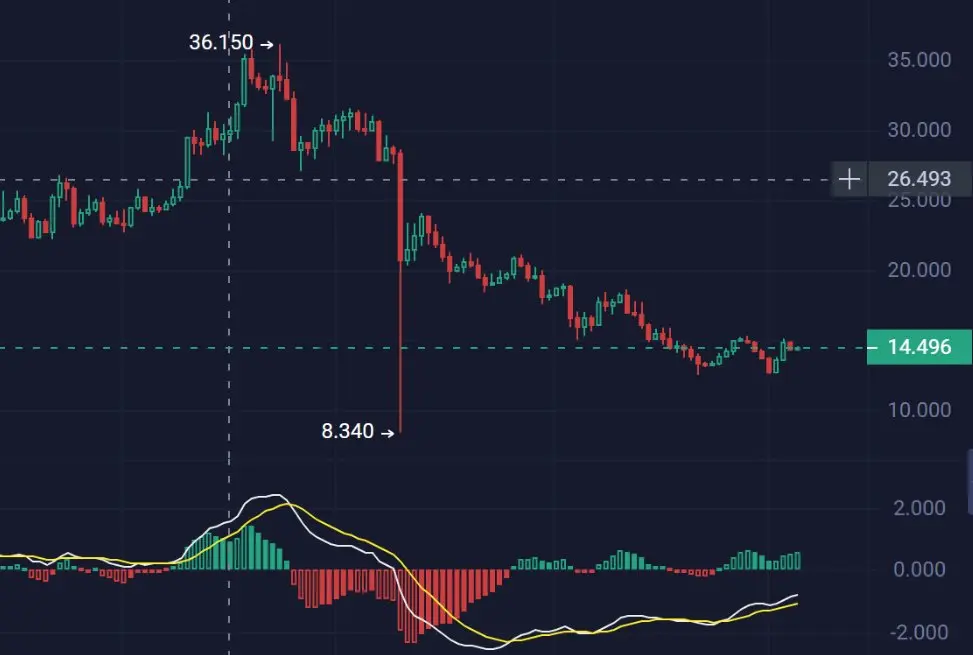
2025/12/02 $SOL على مستوى الأربع ساعات، تحول من تذبذبات من ارتفاع إلى اتجاه هبوط واضح. يجب اتباع الاتجاه، وينبغي أن تكون الفكرة الرئيسية هي تقصير عند الارتفاع أو المراقبة، وتجنب شراء الانخفاض بشكل أعمى.
1. تحليل السعر وحجم التداول:
المرحلة الأولى (24-27 نوفمبر): بعد ارتفاع الأسعار، تشكلت تقلبات عالية في نطاق 140-144. انخفض حجم التداول تدريجياً بعد الارتفاع (مثل الساعة 16:00 في 26 نوفمبر)، مما يدل على ضعف قوة الشراء ونقص في الزخم الصاعد.
نقطة التحول (28-30 نوفمبر): لم يتمكن السعر من اختراق القمة السابقة بشكل فعال، وبدأ في الانخفاض المتذبذب. في الساعة 20:00 من 30 نوفمبر، جاءت شمعة سلبية م
SOL-0.18%
- أعجبني
- إعجاب
- تعليق
- إعادة النشر
- مشاركة
2025/12/02 $BTC في إطار الساعة، نحن في مرحلة ارتداد مُباع بشكل مفرط، لكن الزخم غير كافٍ، لذا لا يُنصح بمطاردة السعر في الوقت الحالي. الطريقة الحكيمة هي الانتظار حتى يتم كسر السعر مع أحجام تداول أعلى والاستقرار فوق 88,000 دولار، ثم البحث عن فرص اختيار الطويل عند التصحيح.
التحليل التفصيلي كما يلي:
1. تحليل السعر وحجم التداول:
هبوط وحجم تداول أعلى: السمة الأكثر بروزًا في البيانات هي الشمعة رقم 193 (1 ديسمبر 00:00)، حيث انخفض السعر من حوالي 90,360 دولار إلى 86,346 دولار، مصحوبًا بحجم تداول قياسي (حوالي 897.8 مليون). هذه إشارة بيع ذعر نموذجية تؤكد قمة مهمة وبداية اتجاه هابط.
الارتدا
BTC0.08%
- أعجبني
- إعجاب
- تعليق
- إعادة النشر
- مشاركة
2025/12/02 $ETH في الإطار الزمني لأربع ساعات، في اتجاه هبوط واضح، يجب الحفاظ على فكرة تقصير عند الارتفاعات، مع التركيز على رد فعل السعر عند مستويي المقاومة 2850-2860 و2900.
أساس التحليل الأساسي:
1. اتجاه السعر وتدمير الهيكل:
في المرحلة المبكرة من البيانات (24-28 نوفمبر)، شهدت ETH زيادة ملحوظة، حيث ارتفعت من حوالي 2800 دولار إلى ما يقرب من 3100 دولار.
نقطة التحول الرئيسية ظهرت في 1 ديسمبر الساعة 00:00 (الخط 193)، حيث انخفض السعر من 2991.26 دولار إلى 2825.77 دولار، مع انخفاض كبير في شمعة 4 ساعات (أكثر من 5.5%)، كما زاد حجم التداول بشكل حاد (572M)، مما يدل على أن الاتجاه الصعودي ق
ETH-3.59%
- أعجبني
- إعجاب
- تعليق
- إعادة النشر
- مشاركة
2025/11/30 $SOL في المستوى 4 ساعات في اتجاه هبوط، يُنصح بالمراقبة أو تقصير بحذر. يجب الانتظار حتى يظهر StochRSI نمط التقاطع الذهبي ويتجاوز السعر مستوى المقاومة 138.50 لتأكيد انعكاس الاتجاه.
مستوى المقاومة:
138.50(أعلى نقطة ارتداد حديثة)
140.00 ()
142.00(منطقة التداول الكثيفة السابقة)
مستوى الدعم:
135.70(النقطة المنخفضة الحالية)
134.50(الدعم المهم السابق)
132.00
مستوى المقاومة:
138.50(أعلى نقطة ارتداد حديثة)
140.00 ()
142.00(منطقة التداول الكثيفة السابقة)
مستوى الدعم:
135.70(النقطة المنخفضة الحالية)
134.50(الدعم المهم السابق)
132.00
SOL-0.18%
- أعجبني
- إعجاب
- تعليق
- إعادة النشر
- مشاركة
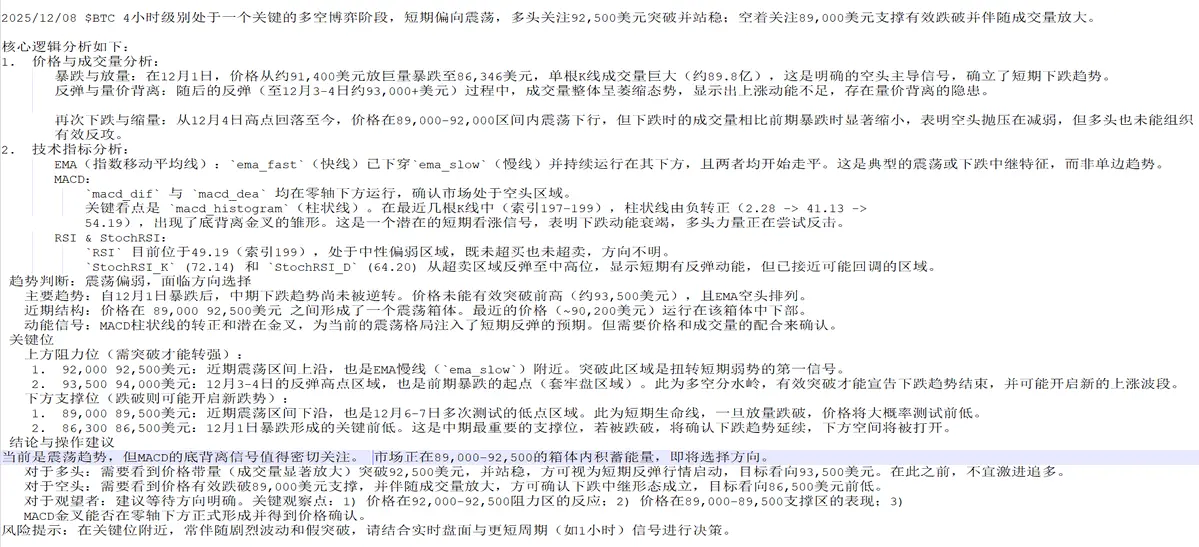
2025/11/30 $ZEC لا تزال في اتجاه هبوط واضح على مستوى 4 ساعات، على الرغم من ظهور علامات انتعاش تقني على المدى القصير، إلا أن الاتجاه العام لا يزال يميل إلى الهبوط.
مستوى المقاومة:
مقاومة近期: 485-490 (قريب من خط EMA البطيء)
مستوى مقاومة قوي: 510-520 (منطقة قمة الانتعاش السابقة)
مستوى الدعم:
الدعم الحالي: 460-465 (قريب من السعر الحالي)
الدعم القوي: 450-455 (منطقة النقاط المنخفضة الأخيرة)
#BTC #ZEC
مستوى المقاومة:
مقاومة近期: 485-490 (قريب من خط EMA البطيء)
مستوى مقاومة قوي: 510-520 (منطقة قمة الانتعاش السابقة)
مستوى الدعم:
الدعم الحالي: 460-465 (قريب من السعر الحالي)
الدعم القوي: 450-455 (منطقة النقاط المنخفضة الأخيرة)
#BTC #ZEC
ZEC1.34%
- أعجبني
- إعجاب
- تعليق
- إعادة النشر
- مشاركة
2025/11/30 $ETH في المستوى 4 ساعات يقع عند الحافة السفلى من نطاق التذبذب، يُنصح بالترقب كخط أساسي. إذا تم كسر دعم 2986، فقد ينخفض السعر بشكل حاد إلى 2960؛ إذا تمكن من الصمود فوق 3000 وحقق أحجام تداول أعلى لكسر 3030، فمن المحتمل أن نختبر مقاومة 3077 مرة أخرى.
مستوى المقاومة:
مقاومة قوية: 3077 (أعلى نقطة في الآونة الأخيرة)
مقاومة ثانوية: 3034-3050
مستوى الدعم:
الدعم الرئيسي: 2986-2990
الدعم القوي: 2960 (أدنى نقطة سابقة) #BTC #ETH #SOL
مستوى المقاومة:
مقاومة قوية: 3077 (أعلى نقطة في الآونة الأخيرة)
مقاومة ثانوية: 3034-3050
مستوى الدعم:
الدعم الرئيسي: 2986-2990
الدعم القوي: 2960 (أدنى نقطة سابقة) #BTC #ETH #SOL
ETH-3.59%
- أعجبني
- إعجاب
- تعليق
- إعادة النشر
- مشاركة