Square
Following
Hot
News
Profile
Share your thoughts
placeholder
Article
Despite such a steep drop, Dogecoin remains remarkably resilient.
post-image
DOGE-5.32%
The entire sector is broadly up, so why is AMP more worth watching?
The answer lies in the mismatch between relative strength and volatility elasticity. $AM is up 17.65% over 24h, outperforming $PYTH at +14.11% and $AERO at +3.99%, yet its RSI is only 55.4, the lowest among the three—AERO has reached 60.9, while PYTH is as high as 66.5 and nearing the Bollinger upper band at 0.08389. AMP, meanwhile, is currently at 0.00068, still above the Bollinger middle band, with approximately 11% room remaining to the upper band at 0.00075698. This means AMP combines “leading gains with non-overheated
post-image
AERO+3.93%
  • 1
New DTT Journal is live. It automates 98% of the journaling processes. It works in combination with DTT chrome app and DTT charts. Also new DTT chrome app update is available for download inside of whop. I’ll make a new full walkthrough video soon covering how to use everything, it’s 1 streamline process.
  • 1
PUMP hit by reverse-engineering access revocation -7.9%, rebounds 2.41%; I’m bullish
$PUMP Its access was revoked following reverse engineering last night. The current price is 0.00568, with 24h performance at -7.9%, yet the chart didn’t collapse: after the incident, it moved from 0.005557 to 0.005691, rebounding +2.41%. I’m bullish at this level.
The daily structure remains intact—RSI 65.2 is strong, MACD has been above the zero line with a bullish crossover for the 11th day, MA7 has stayed above MA30 for the 14th day, and the short-term moving averages remain in a bullish alignment.
Funds
post-image
PUMP-10.96%
$BTC
The long-short ratio is almost two to one, and long accounts are packed in like the subway during rush hour. But while funds rush in, they also exit just as quickly—faster than a sudden change of heart. Keeping an eye on the rhythm is more practical than guessing the direction. Whether to buy is up to you; I’ll just sit on the sidelines and watch the show 😏
post-image
BTC-1.77%
$CXMT My position was too large. Last night’s low was caused by my stop-loss sell-off, and I got stopped out at the very bottom. That’s how helpless it feels.
CXMT-10.87%
Ethereum has fallen from 2805 to 2475, like reaching the summit of a mountain and then descending halfway down. The short-term downtrend is clear, but it has just reached the important EMA52 support near 2492, where bulls and bears are set to clash.
Looking at the moving averages: 2618 above is the ceiling, capping any rise; 2492 beneath is the current floor, while 2338 further down is the solid foundation. If the floor holds, a rebound is possible; if it fails, the price will continue falling.
The MACD has formed a high-level death cross, and the green bars are still lengthening, indicating t
ETH-3.67%
BTC-1.77%
NVDA-2.86%
  • 1
Waking up this early just to cross-chain Robinhood USDG
Two and a half hours from now, it’s time to start grabbing Surf boxes
It’s been three times already—surely I have to open a few on the fourth try, right??
Unless something unexpected happens, I should be that chosen one among the 0.2% who gets a 26x return👀
post-image
USDG+0.06%
The Federal Reserve's September meeting minutes were released on October 7, and the market's interpretation of them has been far from straightforward. All nineteen officials supported the quarter-point hike that lifted the benchmark rate to 3.75%–4.00%, and most participants believed another increase by year-end could be appropriate. Yet within days, the implied probability of a hike at the October 27–28 meeting fell below 20%, down from roughly 70% in the period immediately after the September decision. That gap between the minutes' language and the market's pricing is the central fact shapin
post-image
User_any
When the Federal Reserve released the minutes from its September meeting, the immediate reading was that the central bank was still leaning toward tightening. All nineteen officials supported the quarter-point hike that lifted the benchmark rate to 3.75%–4.00%, and most participants believed another increase by year-end could be appropriate. Yet the market’s response over the following days told a different story. The odds of a hike at the October 27–28 meeting have fallen to roughly 17%–20%, down from nearly 70% in the days right after the September decision. That gap between what the minutes said and what traders are pricing is the central tension in the market right now.
Part of the explanation lies in the language the minutes used. While most officials saw another hike as potentially appropriate, the document also stressed that decisions would remain data-dependent and gave no indication that October was the intended venue. The phrasing “by year-end” rather than “at the next meeting” left room for interpretation, and the market chose to read it as a signal that the Fed is in no rush. Officials have reinforced that view in public remarks since the meeting. Fed Governor Christopher Waller said this week that further rate hikes are needed, but he also noted that the labor market is cooling and that the central bank can afford to be patient. That combination—a willingness to tighten, but without urgency—has kept October hike odds low.
The data that has come in since the September meeting has supported the patient approach. The August PCE price index, the Fed’s preferred inflation gauge, rose 3.4% year over year, below the 3.7% consensus estimate, while core PCE came in at 3.0%. The September jobs report, released on October 2, showed the economy added just 29,000 jobs, far below expectations, with the unemployment rate ticking up to 4.2%. Softer inflation and a cooling labor market give the Fed room to hold rates steady at the October meeting without risking a surge in price pressures. The market has interpreted that combination as reducing the case for an immediate hike.
That brings us to the October 14 CPI report, which is now the single most important data point on the calendar before the Fed meets. Forecasts point to headline inflation rising to around 3.6%–3.7% year over year, up from 3.4% in August. Core CPI, which strips out food and energy, will draw the most attention because it is a better gauge of underlying price pressures. If core CPI comes in at 0.3% month over month or higher, the case for an October hike will resurface, and the odds could climb back toward 40%–50%. A softer reading, closer to 0.2%, would confirm that inflation is continuing to cool and would likely keep October hike odds where they are—or push them lower still.
So how would a hotter-than-expected CPI print affect the Fed’s decision? The minutes already noted that inflation risks are skewed to the upside, with some participants concerned that energy prices and the AI buildout could keep price pressures elevated. A hot CPI reading would validate those concerns and give the hawks on the committee a stronger argument for acting in October rather than waiting until December. But it is worth remembering that the Fed has repeatedly emphasized its data-dependent approach. One inflation report alone is unlikely to force a hike if the broader trend still points toward gradual cooling. The bar for an October move is high, and it would likely take a combination of hot inflation and resilient jobs data to clear it.
For crypto and U.S. stocks, the transmission channel runs through rate expectations and the dollar. When hike odds fall, the opportunity cost of holding risk assets declines, which tends to support prices. Crypto investment products recorded $3.55 billion in inflows in the week after the September hike, the largest weekly figure of 2026, showing how sensitive digital asset flows are to the rate outlook. But the relationship is not one-directional. The 10-year Treasury yield is holding near 5.28%, and the 30-year is near 5.63%, both at multi-decade highs. Those elevated yields continue to weigh on valuations, particularly for high-growth sectors that depend on discounted future earnings. A softer CPI print would ease that pressure by reducing the probability of further tightening. A hotter print would do the opposite.
Is the current outlook already priced in? Largely, yes—but not entirely. The market has priced a pause for October and a hike for December, with December odds around 70%. Those expectations are reflected in current asset prices. What is not fully priced is the possibility of a meaningful surprise in the CPI data. If the report comes in significantly above or below expectations, the repricing could be sharp, because so much of the market’s positioning is built around the assumption that the Fed will hold in October. A hot print would force traders to reconsider that assumption, and the adjustment could ripple across bonds, currencies, equities, and crypto simultaneously.
My own view is that the Fed is unlikely to hike in October unless the CPI report delivers a genuine upside surprise. The labor market is cooling, inflation is trending in the right direction, and the committee has signaled that it sees no urgency to act. The December meeting remains the more likely venue for the next move, if there is one at all. But the October 14 CPI release is the variable that could change that calculus. Until it lands, the market is operating on incomplete information, and the gap between the hawkish minutes and the dovish pricing will remain unresolved.
This article is not investment advice. Analysis is based on publicly available information and does not guarantee future outcomes.
$BTC $ETH $GT
#ShareWeekly #FedSeptemberMinutesLeanHawkis
BTC-1.77%
ETH-3.70%
GT-2.32%
NVDA-2.86%
SNDK-4.91%
  • 1
  • 1
I asked Grok this question:
“What memecoin holders are the most fanatical bulls concerning their memecoin? Only memecoins above 100 million $ market cap.”
Image is the reply I received.
Dang, something to be studied 😬
@grok , can you confirm here as well?
post-image
MEME-5.30%
$SAND is currently the weakest of the three candidates, but precisely this combination of oversold conditions and negative funding gives me a reason to go long in the short term.
First, looking at relative strength: SAND fell 14.20% over 24h, significantly more than $CRV ’s 10.60% and $XRP ’s 2.41%; although the RSI of 35.5 has not reached an extreme, combined with the 25.66% amplitude across 30 candlesticks, it shows that selling pressure has been released in a concentrated manner. By comparison, $XRP ’s RSI is 47 and its MACD histogram remains positive, making it a relatively resilient asse
post-image
SAND-14.11%
CRV-12.45%
XRP-2.45%
crypto market update
live-cover
LIVE66
$DOGE Current price: 0.08442. In the short term, key support is the lower Bollinger Band at 0.08142, while resistance above is the MA20 at 0.08582.
Comparing with the mainstream coins in the same sector: $BN is quoted at 736.01, down 4.45% over 24h, with RSI falling to 33.0 and the MACD bearish bar at -1.48, showing more pronounced weakness; $DOGE is down 4.90%, but its RSI of 38.6 remains higher than BNB, while its funding rate of -0.0063% is the most negative among the three, indicating the highest level of short crowding—once sentiment recovers, it may instead have greater short-squeeze
post-image
DOGE-5.38%
BNB-4.78%
HYPE-4.51%
[new streamer] btc market update
live-cover
LIVE87
🔥 $JCT
Going big on a long position again, brothers. Yang is here 💰 Entry 0.00259-0.00262, stop loss 0.00199, take profit 0.00300-0.00350-0.00400. Go long $JCT 👇
post-image
JCT+63.83%
🔥Explosive earnings, yet hammered overnight: Samsung’s guidance sent chip stocks crashing, while money quietly flowed into two places
The most surreal scene last night: Samsung previewed a surge in operating profit, but because it was “just a little lower” than the market expected, its stock plunged on the spot—SK Hynix -5.6%, Samsung -4.8%, SanDisk -4.7%, Micron -4.6%, a 3x chip ETF -10% overnight, and Korean leveraged products -12%.
Absurd? The shortage is real: DRAM is sold through 2027, and memory sticks have more than tripled in price in a year. But stock prices peaked back in June—Samsu
post-image
SK Hynix-2.43%
SNDK-4.91%
DRAM-5.07%
GLDX+0.81%
PAXG+0.77%
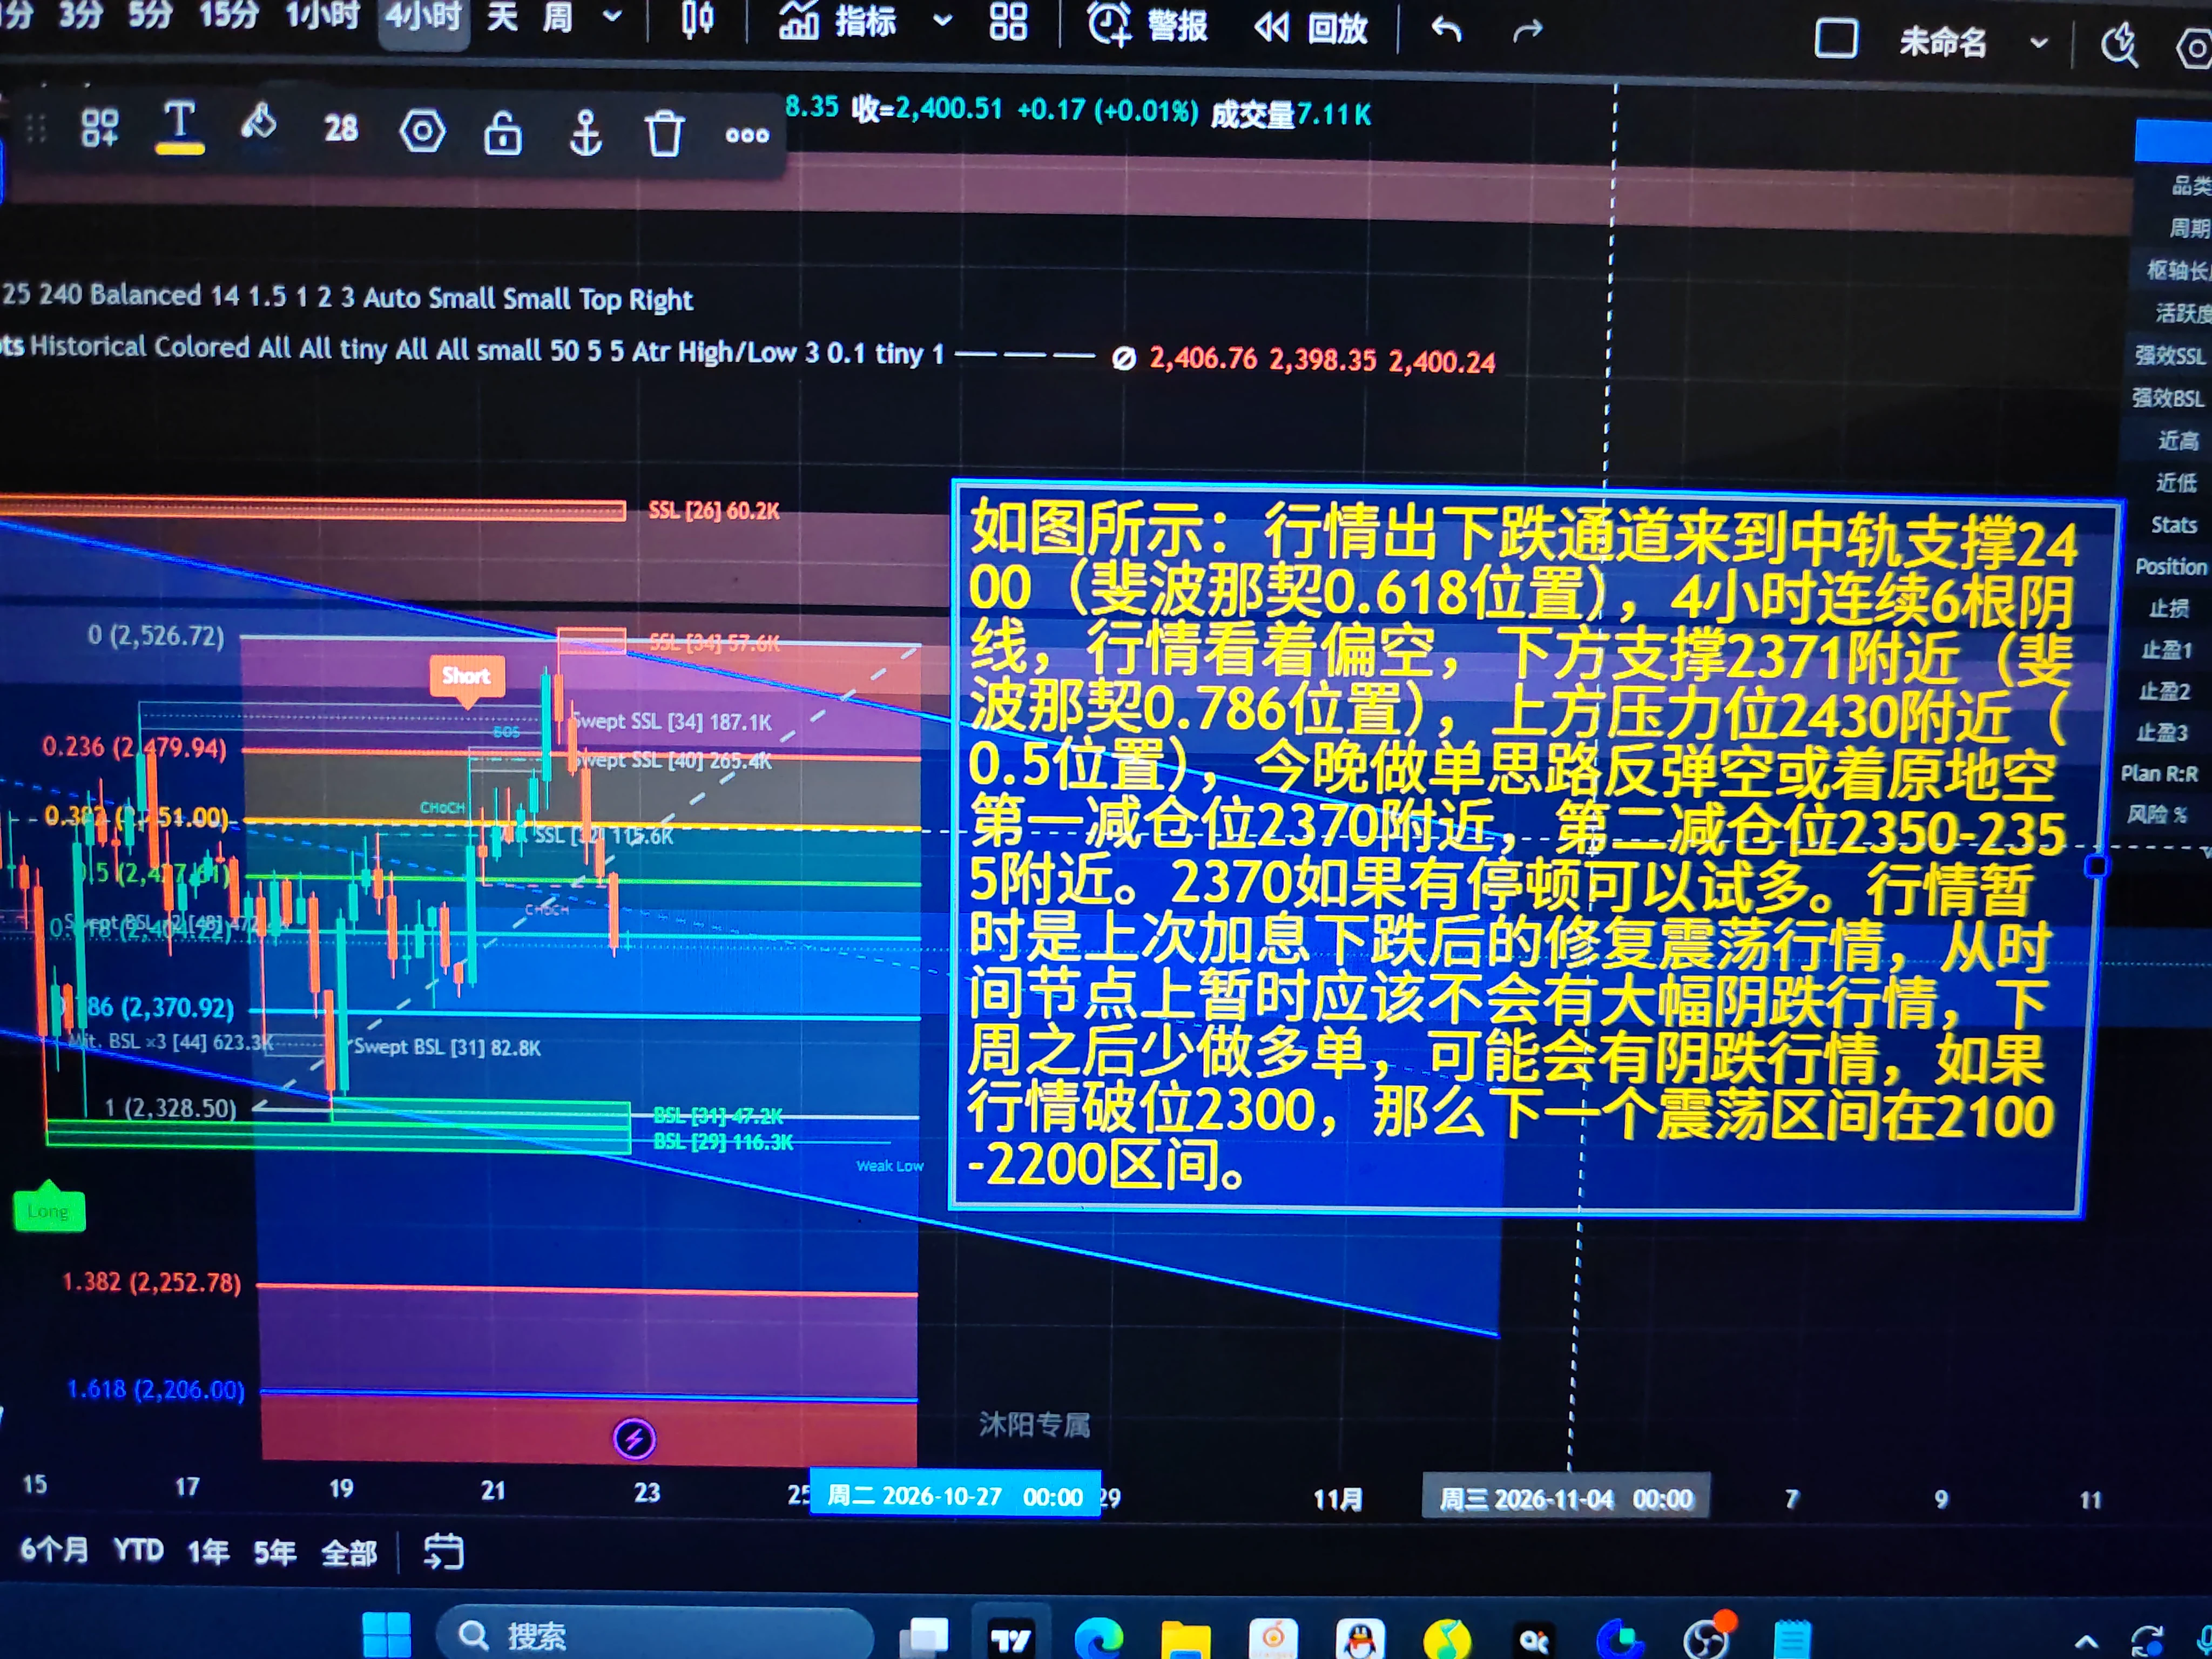
Bottom accumulation is complete, and room for a rebound in gold prices is gradually opening up
Recently, the market has continued to digest U.S. employment data. The slight cooling in employment data has raised market expectations for subsequent policy adjustments, providing support for gold prices.
From the four-hour chart, the price has gradually recovered from its previous low. Support from the lower Bollinger Band has held, and the market is moving upward toward the middle Bollinger Band. The RSI indicator is steadily rising, moving out of the low range, while bullish momentum continues to
post-image
XAU+0.85%
I did nothing—just went to the restroom, and by the time I came back, the candlestick chart had already done the work for me. A few days ago in the afternoon, I only wanted to see whether $BOME would offer a pullback opportunity, but unexpectedly, it started moving up the moment I sat down.

As the price formed a bottom intraday, I saw buying pressure strengthen, while the pullback held the key level. I judged that funds were quietly entering, so I suggested a long entry around 0.0009974. At that point, the market had not fully started moving yet, and many people were still watching from the
post-image
BOME-0.97%
XRP-2.42%
SOL-5.81%
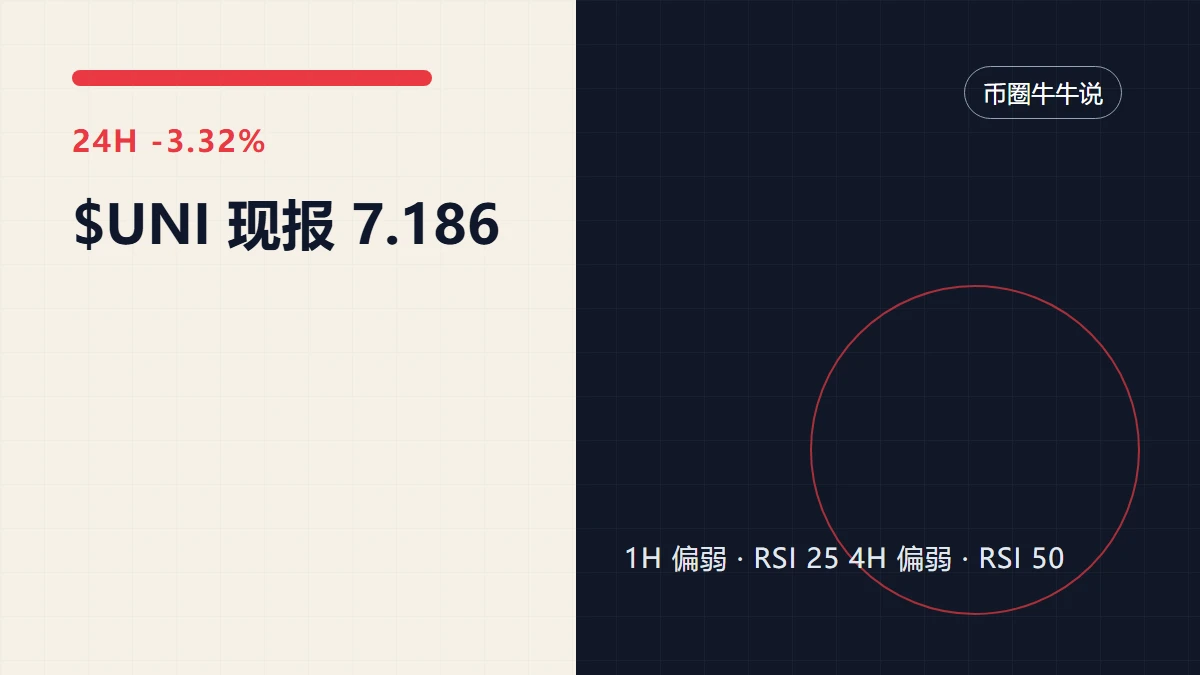
$UNI 's low is beginning to attract attention, but the sense of cheapness can never replace evidence of a bottom forming.
This time, let's ignore the gainers and losers ranking and focus only on the levels. The current price is 7.362, about 4.92% above the 1-hour support at 7 and about 9.06% below the resistance at 8.029.
My criteria are simple: only a breakout above 8.029 followed by continuation would count as follow-through higher; a break below 7 invalidates the original assessment. The 1-hour and 4-hour trends are both weak, with RSI at 34 and 15, respectively.
The issue now is not a slog
post-image
UNI-9.49%
Load More

Join 40 M users in our growing community

⚡️ Join 40 M users in the crypto craze discussion

💬 Engage with your favorite top creators

👍 See what interests you

Trending Topics

Gate Money Officially Launches

3.45k Views12.87k Discussing

Gate officially launches Gate Money, a global integrated financial services app that brings digital assets, fiat, stocks, ETFs, gold, bank accounts, and payments into one Gate App. Users can manage assets, invest, send and receive funds, convert currencies, and make payments — all from a single account. Which use case are you most excited about? [👉 Learn more](https://www.gate.com/announcements/article/102094)

Fed September Minutes Lean Hawkish

64.16k Views2.72k Discussing

Samsung Q3 Operating Profit Surges 782.5%

36.91k Views1.93k Discussing

View More