




Square
Following
Hot
News
Notifications
Profile
Share your thoughts
placeholder
Article
Arghhhhhhhhhhhhhhhhhhhh, just like that bruhhh
$10,000 😦
Half-Month Note | Still Waters Run Deep, Building Strength for the Breakthrough

Half a month has flown by, and the market has shifted course several times.
From range-bound tug-of-war to trend extensions, from rebound and recovery to another search for a bottom, each move has found its own rhythm.

The more turbulent the market, the more important it is to hold firm to your own judgment.
Don’t chase the latest excitement or lose your footing over short-lived fluctuations.

Over the past two weeks, there has been patience in waiting and decisiveness in acting. Markets won’t always move in our
Trenches
mihao
m
bade
b
mihao
4Cxj...pump
Market Cap
$.
Change
.
24h Vol
$.
Holders
.
IDOL
I
bade
b
IDOL
0x3b...ab07
Market Cap
$.
Change
.
24h Vol
$.
Holders
.
FOOD
F
bade
b
FOOD
FTu5...pump
Market Cap
$.
Change
.
24h Vol
$.
Holders
.
AGT
A
bade
b
AGT
0x5d...e274
Market Cap
$.
Change
.
24h Vol
$.
Holders
.
NIO
N
bade
b
NIO
7SL2...pump
Market Cap
$.
Change
.
24h Vol
$.
Holders
.
btc update
live-cover
LIVE1,915
Afternoon signal alert $BLESS
I checked and saw it had been moving sideways for quite a while, so I took a small position
I was afraid of missing another $AKE kind of 4–5x pump
Then it pumped right after I bought—look at this chart
Luckily, not only did I buy in low, but I also gave the stop-loss plenty of room
Otherwise, a profit would’ve turned into a stop-out
BLESS-2.00%
AKE+6.07%
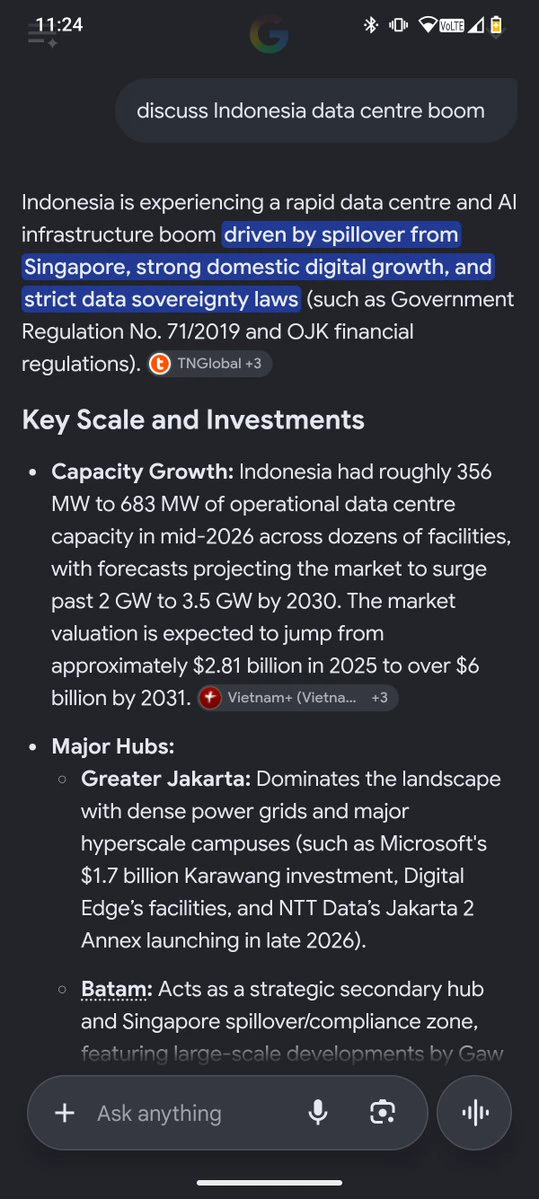
Singapore/Indonesia as a tech melting pot
post-image
Get Unstuck! Gold Dips to 3852; Don’t Stubbornly Hold Positions Bought at Highs, Waiting to Break Even

This week, gold retreated from its high of 4148, hitting a low of 3852. It is currently fluctuating around 3880 as it attempts to recover. The bearish structure on the 2-hour chart remains unchanged; this rebound is merely a pause after the decline, with limited upside.

1️⃣ Deeply underwater above 4080: Don’t keep adding to your position to lower your average cost. Prioritize substantial position reductions if the price rebounds to 3920-3935 to reduce account risk. Keep a close eye on suppo
post-image
XAU+0.38%
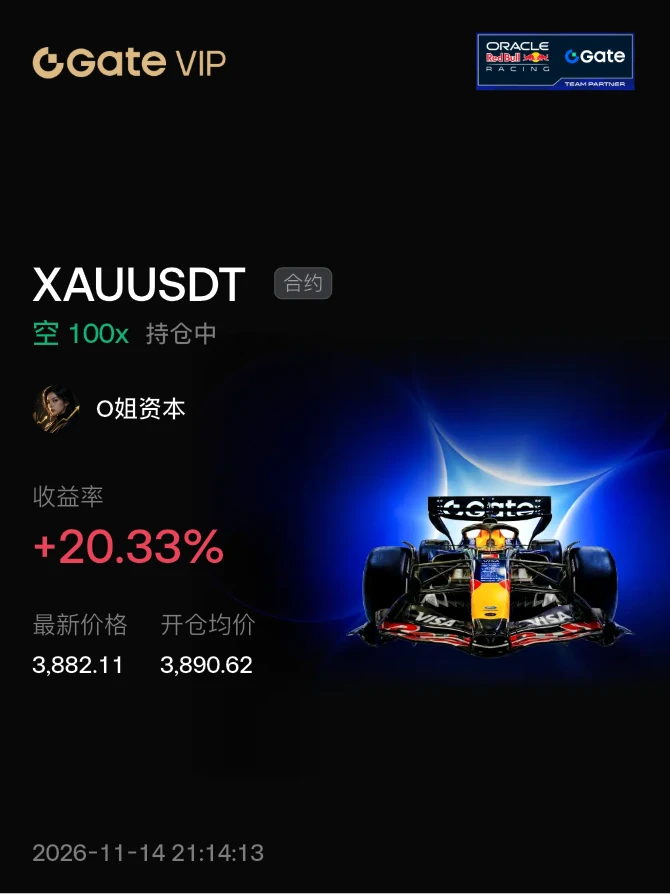
#晒出我的持仓收益 The gold position I opened last night, XAUUSDT, is such a poser—the most pretentious short instrument, a short on the monthly timeframe, acting bullish every day,
post-image
XAU+0.38%
@PeterSchiff predicts BTC could crash to $16.5K if $50K breaks.
Meanwhile, Bitcoin is still at $67K.
He's been calling for BTC's downfall since $1.
BTC-0.67%
I'm confused—did we win or lose 😂
post-image
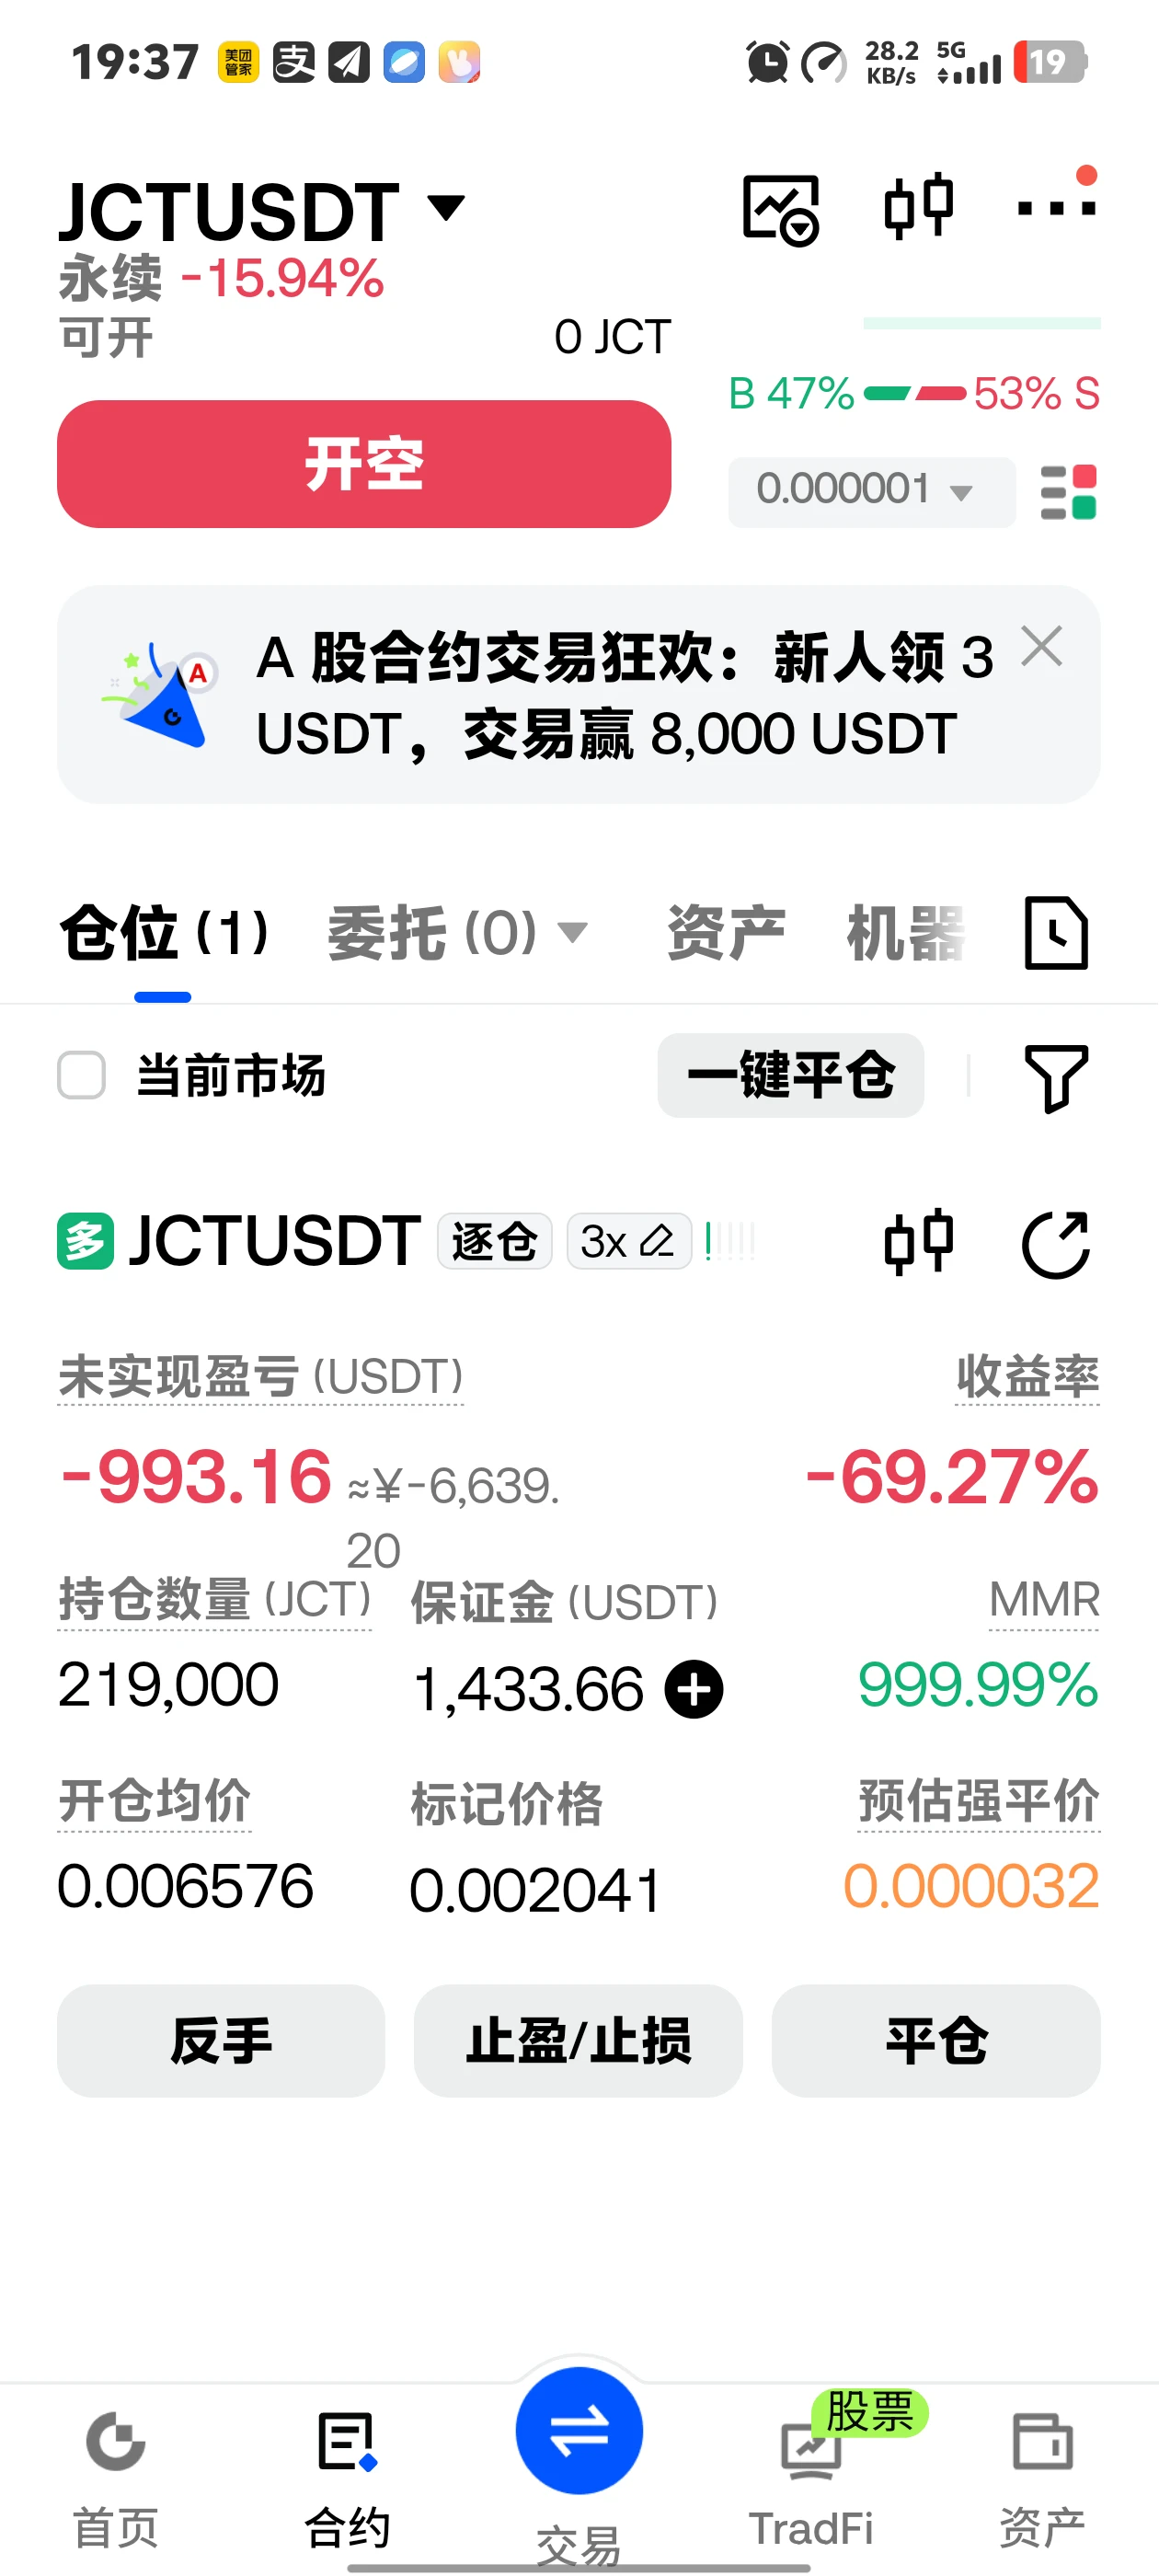
$JCT Everyone, don't worry. I'm just going to stick it out. If this blows up, I'll accept the loss and won't play anymore after that
post-image
JCT-3.26%
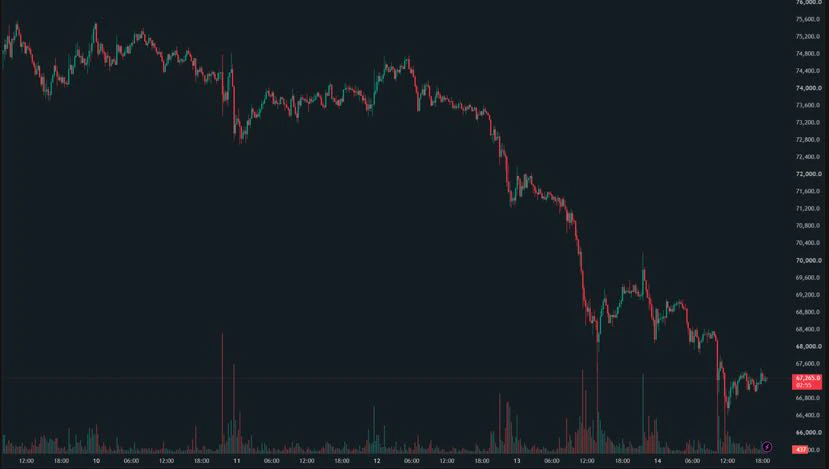
$BTC It has hit a new low again, this time falling to around $66.4k😥

Since BTC broke below $70k, it has barely seen any meaningful rebound. Price levels have continued to move lower, and every bounce has been pushed back down by selling pressure

Behind this downturn, the U.S. Dollar Index has hit a new high for this period, expectations of Fed rate hikes have risen, and spot ETFs have continued to see outflows, leaving neither the macro backdrop nor fund flows in a favorable position

But I think the most noteworthy thing is the price action itself:

In previous declines, at least we could
post-image
BTC-0.67%
  • 2
  • 2
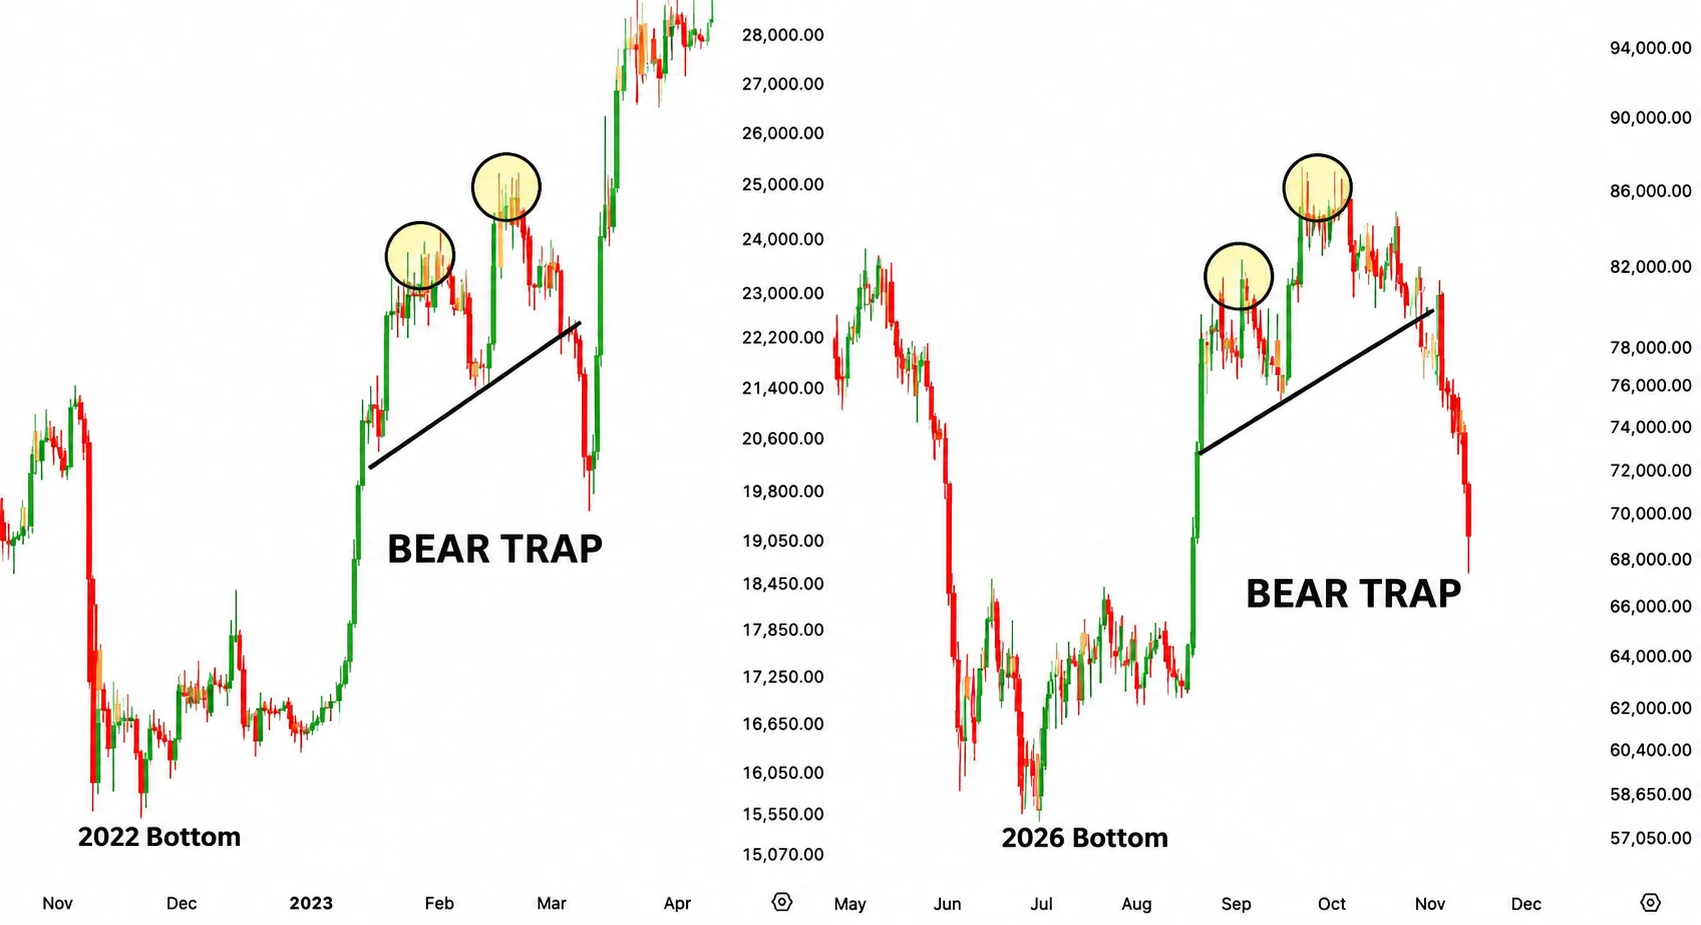
$BTC Could Be Setting Up a MASSIVE BEAR TRAP!

We might be witnessing the same pattern that shook the market in 2023.

Bitcoin broke key support, triggering panic selling and trapping traders on the bearish side.

Back in 2023, a similar breakdown was followed by a powerful bullish recovery.

Now the chart is showing striking similarities.

If history repeats, this could turn into one of the biggest bear traps of 2026.

The next BTC move could shock the entire market!
post-image
BTC-0.67%
$SUI Shows Early Recovery Signs – Is a Bullish Bounce Building?
SUI is showing signs of a potential recovery after recent selling pressure. Buyers appear to be stepping back into the market, suggesting that bearish momentum may be weakening in the short term.

However, the recovery still needs confirmation. Holding above the $0.7700 area could help strengthen bullish sentiment and create room for further upside.

Key figures

$0.7700–$0.7730 — Important recovery zone

$0.7640 — Key support level

$0.7780 — First upside resistance

$0.7830 — Next resistance area

$0.7900 — Higher recovery targ
post-image
SUI-1.05%
  • 1
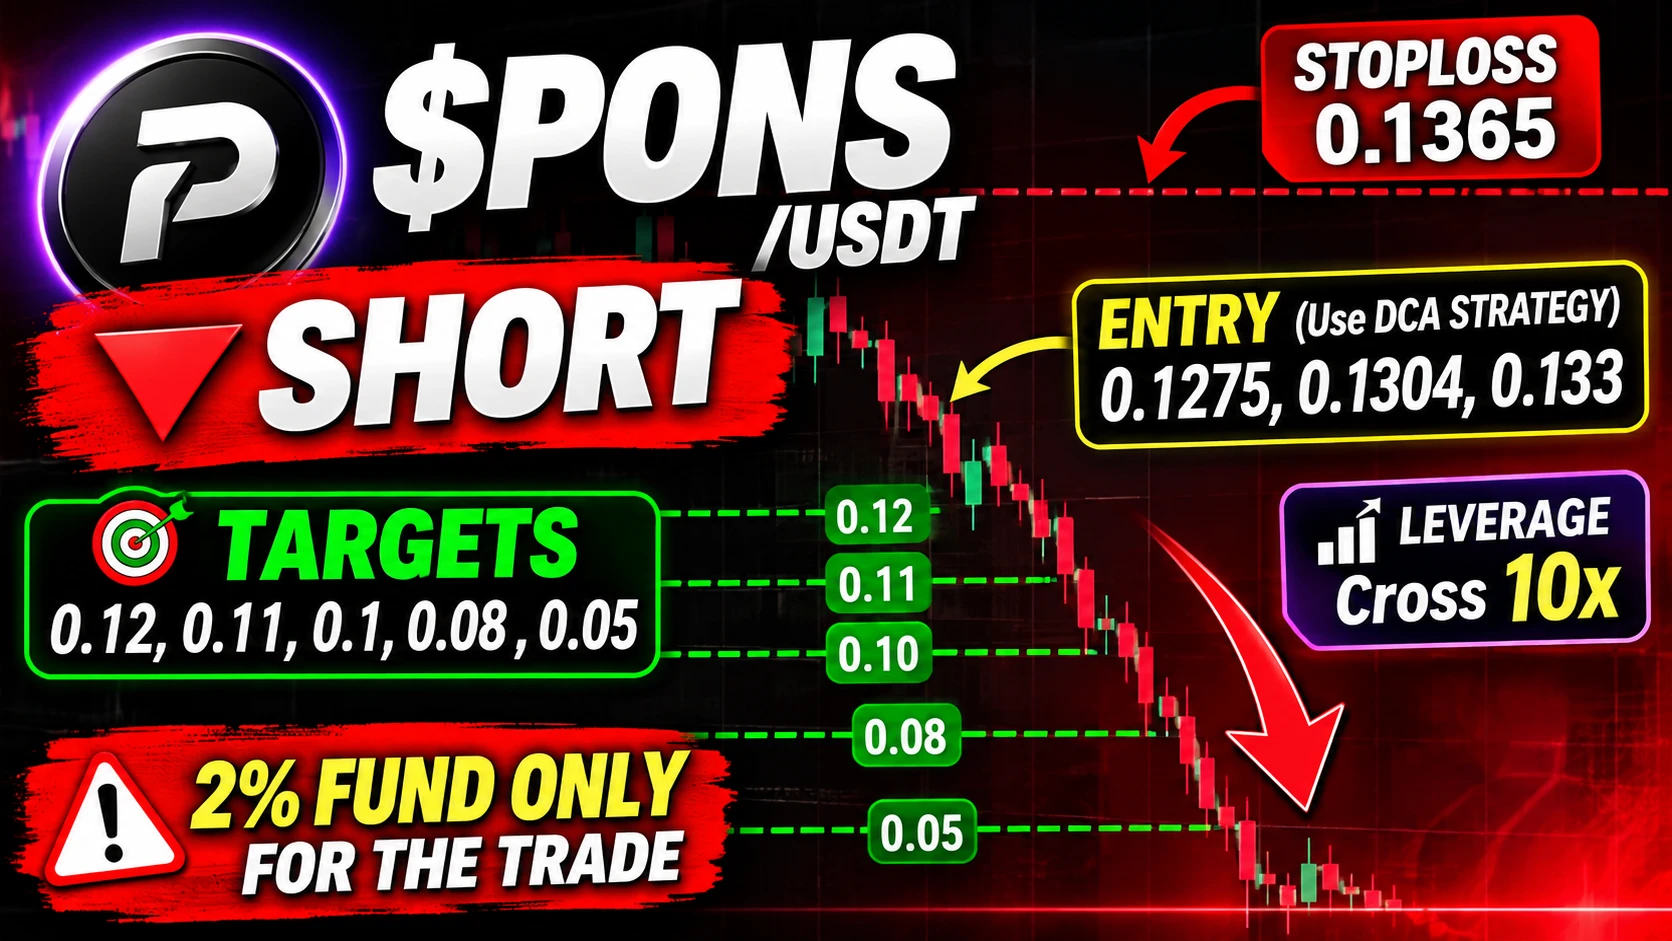
🚨 $PONS /USDT – SHORT SETUP ALERT! 📉

Sometimes the biggest opportunity isn't chasing a falling market; it's waiting for a proper rejection at resistance.

$PONS is on my watchlist for a potential bearish move. I'm watching the entry zones carefully and using a DCA-based approach rather than rushing into a position.

💰 ENTRY ZONES: 0.1275 / 0.1304 / 0.1330

🎯 TARGETS:

- TP1: 0.1200
- TP2: 0.1100
- TP3: 0.1000
- TP4: 0.0800
- TP5: 0.0500

🔴 STOP LOSS: 0.1365

⚡ Leverage: Cross 10x (high risk)
🛡️ Risk allocation: Maximum 2% of trading funds.

My unique thought: The real question is whether
post-image
PONS+4.41%
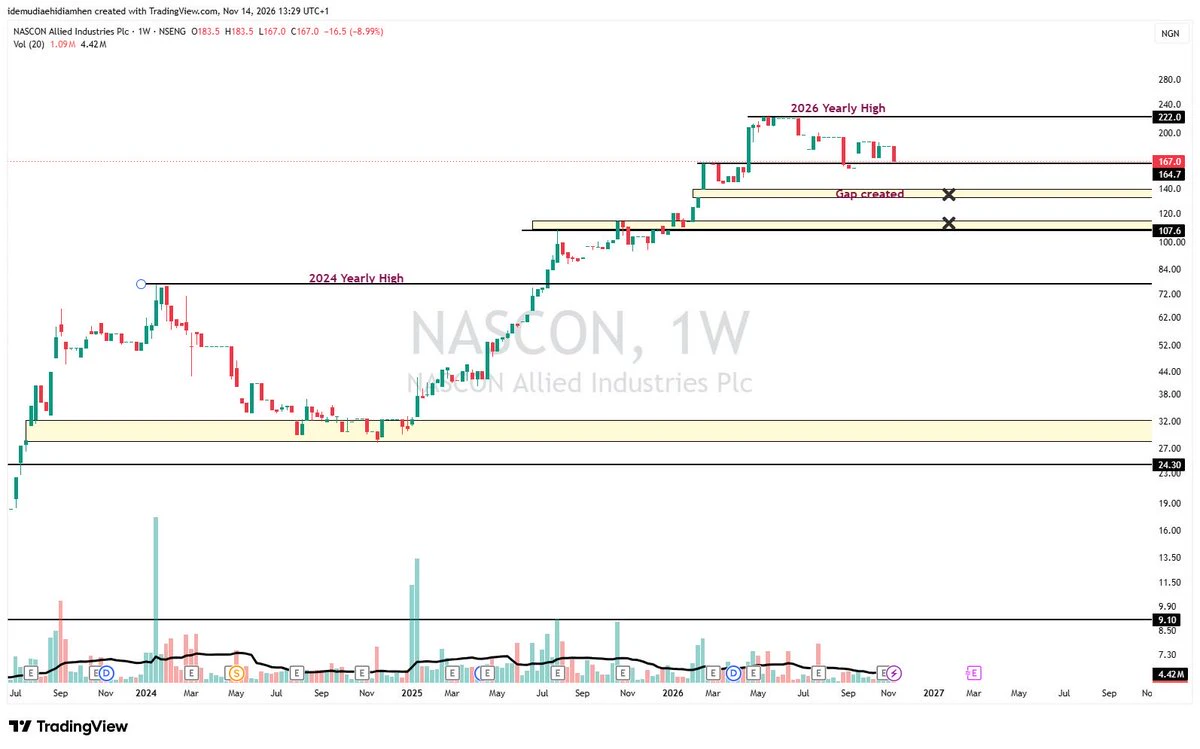
NASCON
The Bulls must not lose the N164.7/share support zone, or I am looking at two regions:
1. The gap closure of N132-N140 per share, which happened in February 2026.
and
2. The demand zone of N108.7-N114.5 per share, which I doubt we might play, but it is the market, and we are open to any form of possibilities
#NFA
post-image
#比特币跌破7万美元 The near-term outlook currently leans toward further downside. $70,000 has already been breached, spot ETF funds are still flowing out, and the rebound looks more like a recovery after an outsized decline than a reversal.

Why prices could still move lower
· Rate hike expectations are weighing on the market: Fed officials have struck a hawkish tone, and the market is concerned about a rate hike in December. When the dollar strengthens, assets like Bitcoin usually fall first.
· ETF outflows continue: U.S. spot Bitcoin ETFs have seen net outflows for six consecutive trading days, tota
post-image
ThisIsTranslateContent:
#比特币跌破7万美元 For now, the short-term outlook points to further downside. $70,000 has been breached, spot ETF funds are still flowing out, and the rebound looks more like a recovery after an excessive drop than a reversal.
Why it could still move lower
· Rate hike expectations are weighing on the market: Fed officials have taken a hawkish tone, and the market is concerned about a rate hike in December. When the dollar strengthens, assets like Bitcoin typically fall first.
· ETFs are seeing outflows: U.S. spot Bitcoin ETFs have recorded net outflows for six consecutive trading days, totaling about $1.722 billion.
· Leverage is being flushed out: After the drop below $70,000, nearby long positions were liquidated en masse. Liquidations over 24 hours totaled about $1.64 billion, nearly 90% of which were longs.
Where is the next support?
· $68,000–$68,200: This is the most immediate reference point at present, and is near this year's June low.
· $66,500–$67,000: The 200-week moving average is around $67,148, a level long-term funds are watching.
· $62,000–$65,000: Further down, long-term holders bought about 476,000 coins in this range this year, making it a deeper support level.
What two things to watch for in a rebound
1. Hold near $68,000 and close with a long lower wick on increased volume.
2. Reclaim $70,000, ideally returning above $72,000. Only if both happen will it count as a consolidation recovery; rising back above $70,000 alone is still just a rebound.#WCTCS9 $BTC ‌

repost-content-media
BTC-0.67%
  • 2
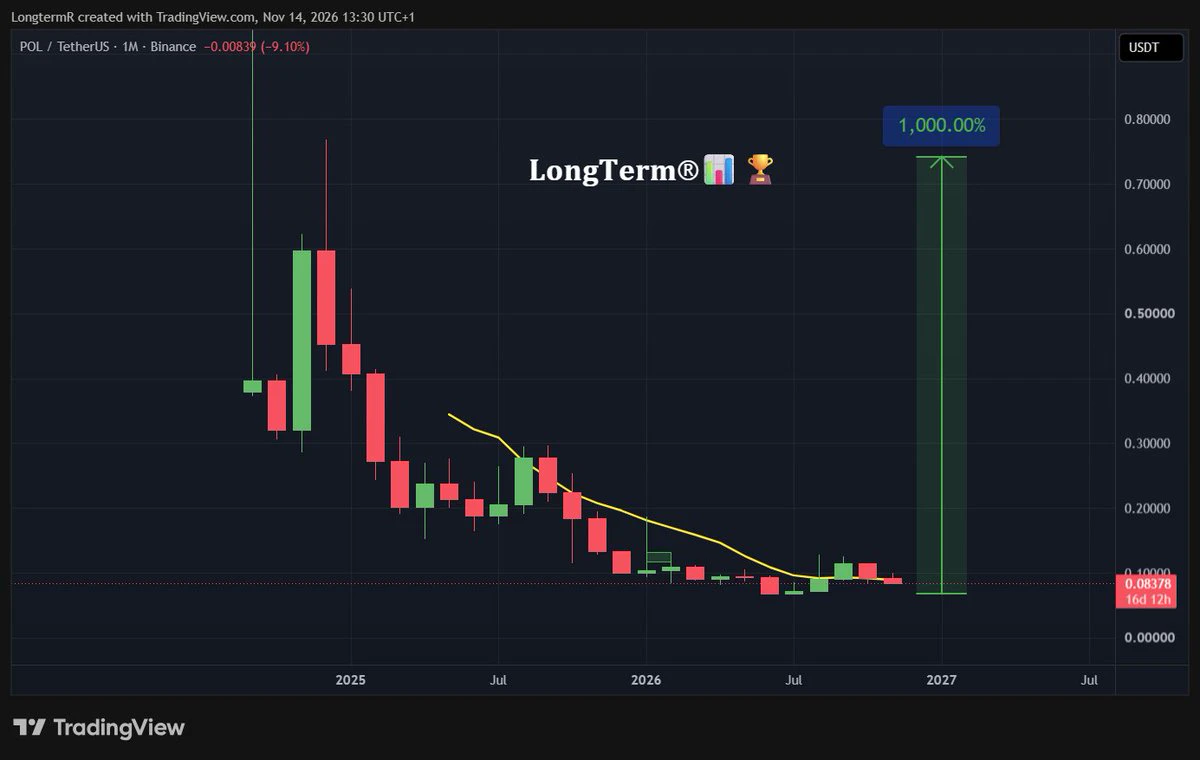
POL picked up a bank-issued stablecoin this week. SoFiUSD is live on Polygon for SoFi's 17M+ members.
CoinGecko is also lining up USDC payments on Polygon's x402 endpoints.
Chart-wise, it's been stuck in a tight range for about nine months, and the candles keep shrinking.
post-image
POL-0.19%
USDC+0.01%
$BTW I bet it won't rebound to 0.75 tomorrow. If I'm wrong, I'll livestream myself washing my hair upside down. I just cut my losses and got out: entered at 0.72, bailed at 0.64, a solid -11%. Look at the data: down 23% in 24h, low of 0.6316, and 73M in trading volume as it got hammered on heavy volume—this isn't a shakeout, it's panic selling. My mistake: I got greedy and didn't take profit at 0.95 that day, fantasizing it would break 1. Lesson: if it breaks the previous low on heavy volume, get out. Don't fall in love with the candlesticks. Trade plan: don't buy the dip now; wait for it to s
BTW-7.42%
  • 6
  • 2
Load More

Join 40 M users in our growing community

⚡️ Join 40 M users in the crypto craze discussion

💬 Engage with your favorite top creators

👍 See what interests you

Trending Topics

GateIPOAccessAnthropic

314.6K Views2.8K Discussing

Gate IPO Access Phase 3 features Anthropic (ANT), with USDT subscription interest starting from 100 USDT. Successful allocations will be delivered as real shares to Gate Stock Accounts. Indicative price: $70–$78/share Subscription: Nov 12–17 (UTC+8) Allocation is not guaranteed. Please manage risk accordingly.

Dr.HanOxfordUnionSpeech

148K Views607 Discussing

USOctoberPPIBelowExpectations

464.3K Views1.5K Discussing

View More