Square
Following
Hot
News
Notifications
Profile
Share your thoughts
placeholder
Article
$ICNT Hit 0.4536... Another big win—what a comeback! ICNT continues its strong bullish run, climbing from 0.2084 to 0.4536 and setting a new high. From the low, that’s an impressive 117% gain! Our bullish target has been reached, and the market has once again delivered an excellent opportunity. Recent low: 0.2084 New high: 0.4536 Current price: 0.4511 Next resistance: 0.46–0.47 Congratulations to everyone who caught this move and took profits! Buyers remain strong, with the price up 29.37% over the past 24 hours. A break above 0.4536 could see the price climb further toward 0.47. Another accu
post-image
ICNT-10.32%
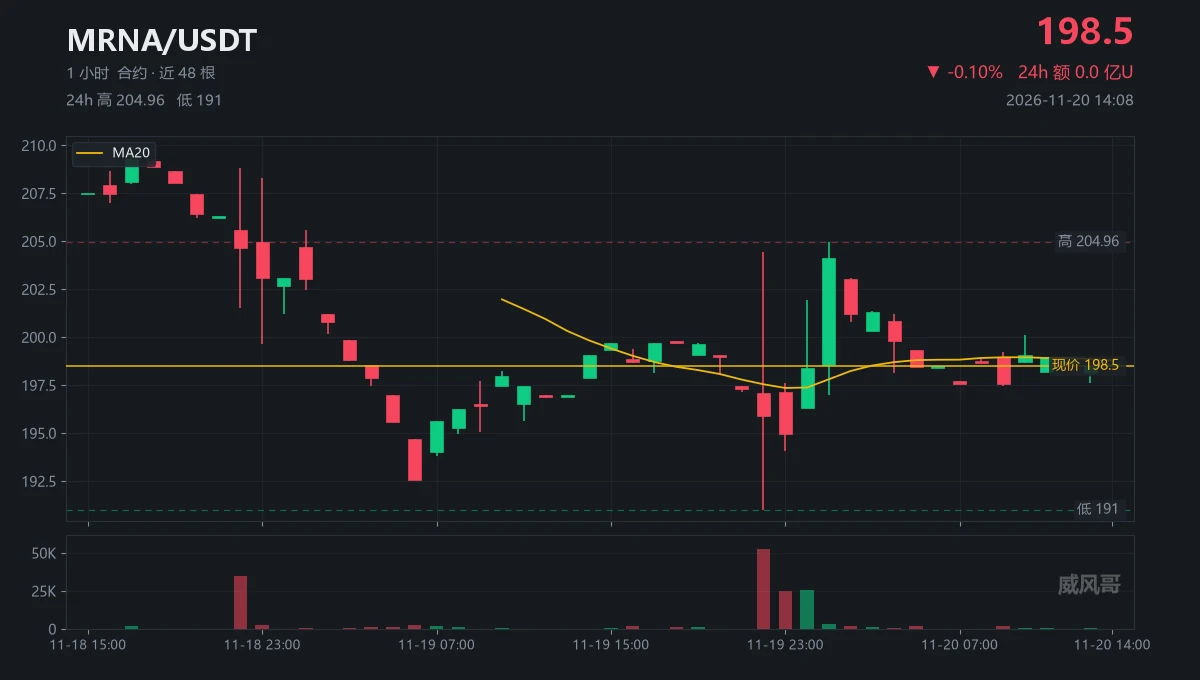
14:08 screenshot, $MRNA shows this hour's trading volume as 0.
Q: Not a single contract traded for a whole hour?
A: Not one, and the price is still stuck at 198.50.
Q: Then who set 198.50?
A: The person placing the order, not the buyer.
From 05:00 until now, ten candles totaled 6,938 contracts.
The 24-hour total is 241k U, less than a single wick on some altcoins.
Q: What about that 50,000-contract candle this morning?
A: Those were real trades during the U.S. overnight session. The people left, and only the shell remains.
Now it's 198.35; the chart closed at 198.50. Both are shadow prices.
F
post-image
MRNA-3.55%
  • 2
  • 2
Trenches
mihao
m
bade
b
mihao
4Cxj...pump
Market Cap
$.
Change
.
24h Vol
$.
Holders
.
FIONA
F
bade
b
FIONA
B34n...pump
Market Cap
$.
Change
.
24h Vol
$.
Holders
.
PIEVERSE
P
bade
b
PIEVERSE
0x0e...25a9
Market Cap
$.
Change
.
24h Vol
$.
Holders
.
RUGGED
R
bade
b
RUGGED
GT8W...pump
Market Cap
$.
Change
.
24h Vol
$.
Holders
.
PIPI
P
bade
b
PIPI
6MKD...pump
Market Cap
$.
Change
.
24h Vol
$.
Holders
.
[NEW STREAMER]market update
live-cover
LIVE3,159
BTC-0.67%
BTW | Long 🟢 | Bullish | 15-minute 24-hour: +13.91% | Volume: 124.0M USDT. Long rationale: Price above EMA200; EMA20/50/200 in bullish alignment; RSI14 at 61.5; MACD histogram positive; ADX14 at 16.8; volume is 0.57x the 20-candle average; trend pullback/continuation. Entry: 0.6246 Stop-loss: 0.586668 Take-profit 1: 0.672015 | Take-profit 2: 0.700464 | Take-profit 3: 0.738396 Entry price is for reference only; do not chase the price. The trading setup is invalidated if the stop-loss price is reached. Technical analysis setup only, not investment advice. $BTW
post-image
BTW-7.42%
Watching $LIT finally try to wake up after that brutal drop. It is barely holding near the daily low, but buyers are at least starting to make a move. Is anyone still brave enough to catch this falling knife? Or is everyone waiting for a real trend to finally sustain itself? Take profit: 2.7389 Stop loss: 2.4619 Market watch:
$NAORIS : Current price 0.03206 - 24-hour change: +37.89%
$BTC : Current price 61,605.3 - 24-hour change: -3.06%
post-image
LIT-4.56%
NAORIS+0.66%
BTC-0.67%
Google: Cyberattack on 178 Organizations Marks the Era of Automated Attacks
A massive supply chain attack in the JavaScript ecosystem has exposed visitors to 178 organizations' websites after attackers injected malicious code into Optimizely's web projects.
The malware could swap cryptocurrency wallet addresses, steal payment card data, harvest cookies and screenshots, and target vulnerable iPhones and iPads with additional exploits.
⚠️ Personal market analysis only. NFA — manage risk and DYOR.
Educational content, not investment advice or a recommendation to buy, sell, deposit, or withdraw an
post-image
GOOGL-3.48%
This may be China’s kill line…
Long $ICNT price has broken above structure (BOS), remains above the EMA, and is consolidating below resistance at 0.4500. Prefer going long when price pulls back to support. Entry 1: 0.4100 – 0.4330Entry 2: 0.3470 – 0.3800Entry 3: 0.2770 – 0.3030Take-profit 1: 0.4500Take-profit 2: 0.4797Take-profit 3: 0.6100Stop-loss: 0.2400This plan is for reference only and is based on the 4H chart sent; the live price has not been confirmed. The stop-loss is relatively far from Entry 1, so position size and leverage should be managed carefully.
post-image
ICNT-10.32%
I was watching the markets last night: U.S. stocks plunged 1,101 points, and even gold and BTC couldn’t escape—you think “safe-haven assets” should rise? Quite the opposite: when liquidity tightens, institutions sell whatever they can first to meet stock margin calls, turning gold and BTC into ATMs. This isn’t “safe havens failing”; it’s “all assets being sold at once.” In a crisis, there are no safe havens, only liquidity. The “shelter” you want is worthless in the face of margin calls.
post-image
GLDX-0.40%
PAXG+0.37%
XAU+0.38%
BTC-0.67%
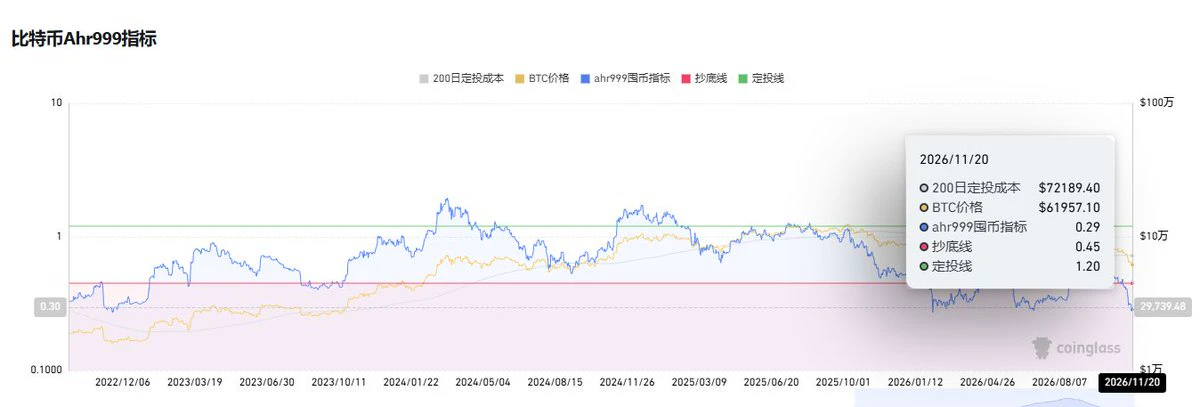
⚠️ bitcoin:native technicals have entered full capitulation territory—
Death cross + RSI 21.3 + AHR999 index 0.29
After 62000 was breached, $60,000 is the lower bound of the long liquidation cluster marked by Glassnode.
Three words describe the market now: downtrend, extremely weak momentum, deeply oversold.
Fam, still buying the dip?
post-image
BTC-0.65%
  • 1
🐋 WHALE WATCH :JPMorgan expects three consecutive 25bps Fed rate hikes December January March.
Sticky inflation is driving the call.
post-image
#ThreeLaunchpoolProjectsNowLive
INFI + A Deep Dive into Tokenomics, Liquidity Dynamics, and Strategic Allocation

With three major projects launching simultaneously on Gate Launchpool, the immediate reaction for most retail investors is to chase the highest number on the screen, which in this case is the staggering 524.40% indicative annualized yield for INFI. However, seasoned participants know that headline APYs are often misleading metrics that fail to account for pool dilution, token vesting schedules, and post-listing price volatility. I am choosing to research INFI first not merely be
post-image
VLX+0.00%
ETH-1.26%
BTC-0.67%
STABLE-1.39%
U.S. stocks, gold, and crypto have all crashed
Guys, this is all I can do for you…
post-image
GLDX-0.40%
PAXG+0.37%
XAU+0.38%
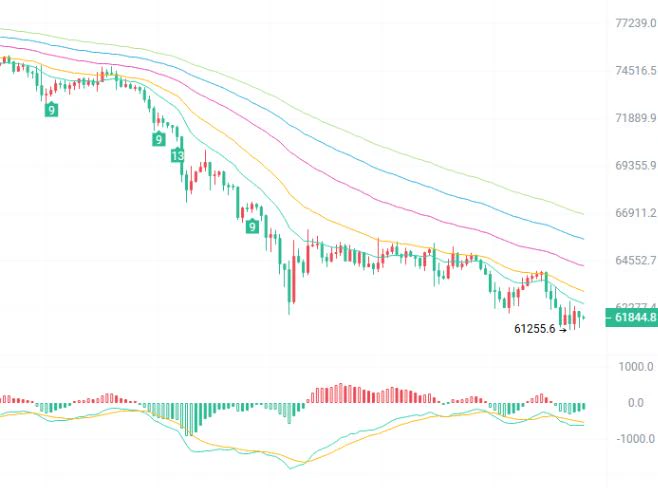
Current price: 61840. This drop has kept plenty of people awake: bottom-fishers are underwater, while short sellers fear a rebound. The market is really tangled. A big drop doesn't mean a rise is due; the market only cares where the money is flowing. Until a signal emerges, all bottoming guesses are wishful thinking.
The 2-hour chart is plainly bearish, with moving averages stacked overhead and price stuck below them. MACD is still below the zero line, and price is moving along the lower Bollinger Band—classic weakness. Strong resistance sits at 62400–62800. If 61250 breaks, there are even low
post-image
ANT-13.13%
Morning reminder: Make staggered trial trades at resistance; 3626-3514 has once again yielded 112 points of room! Down nearly 400 points this week, the current move is just a pullback after the decline. The market is highly volatile, so don’t rush to buy the dip! $XAU #黄金 #GateLeadsRWAPerpExpansion ‌
XAU+0.38%
Those of you with partners, take note: this website solves the problem of finding references for photos and AI-generated images.
98 sets of photo poses, each with 5 different angles, and 1,068 outfits with Chinese and English descriptions. You can also upload a photo to see how they look on you.
Your girlfriend can pick outfits and put together looks while you study composition and camera angles—everyone does their own thing.
🔗
BITCOIN ON-CHAIN BREAKDOWN: ETF Outflows, Whale Buying & Live Trade Setups on Gate.io!
live-cover
LIVE1,614
BTC-0.67%
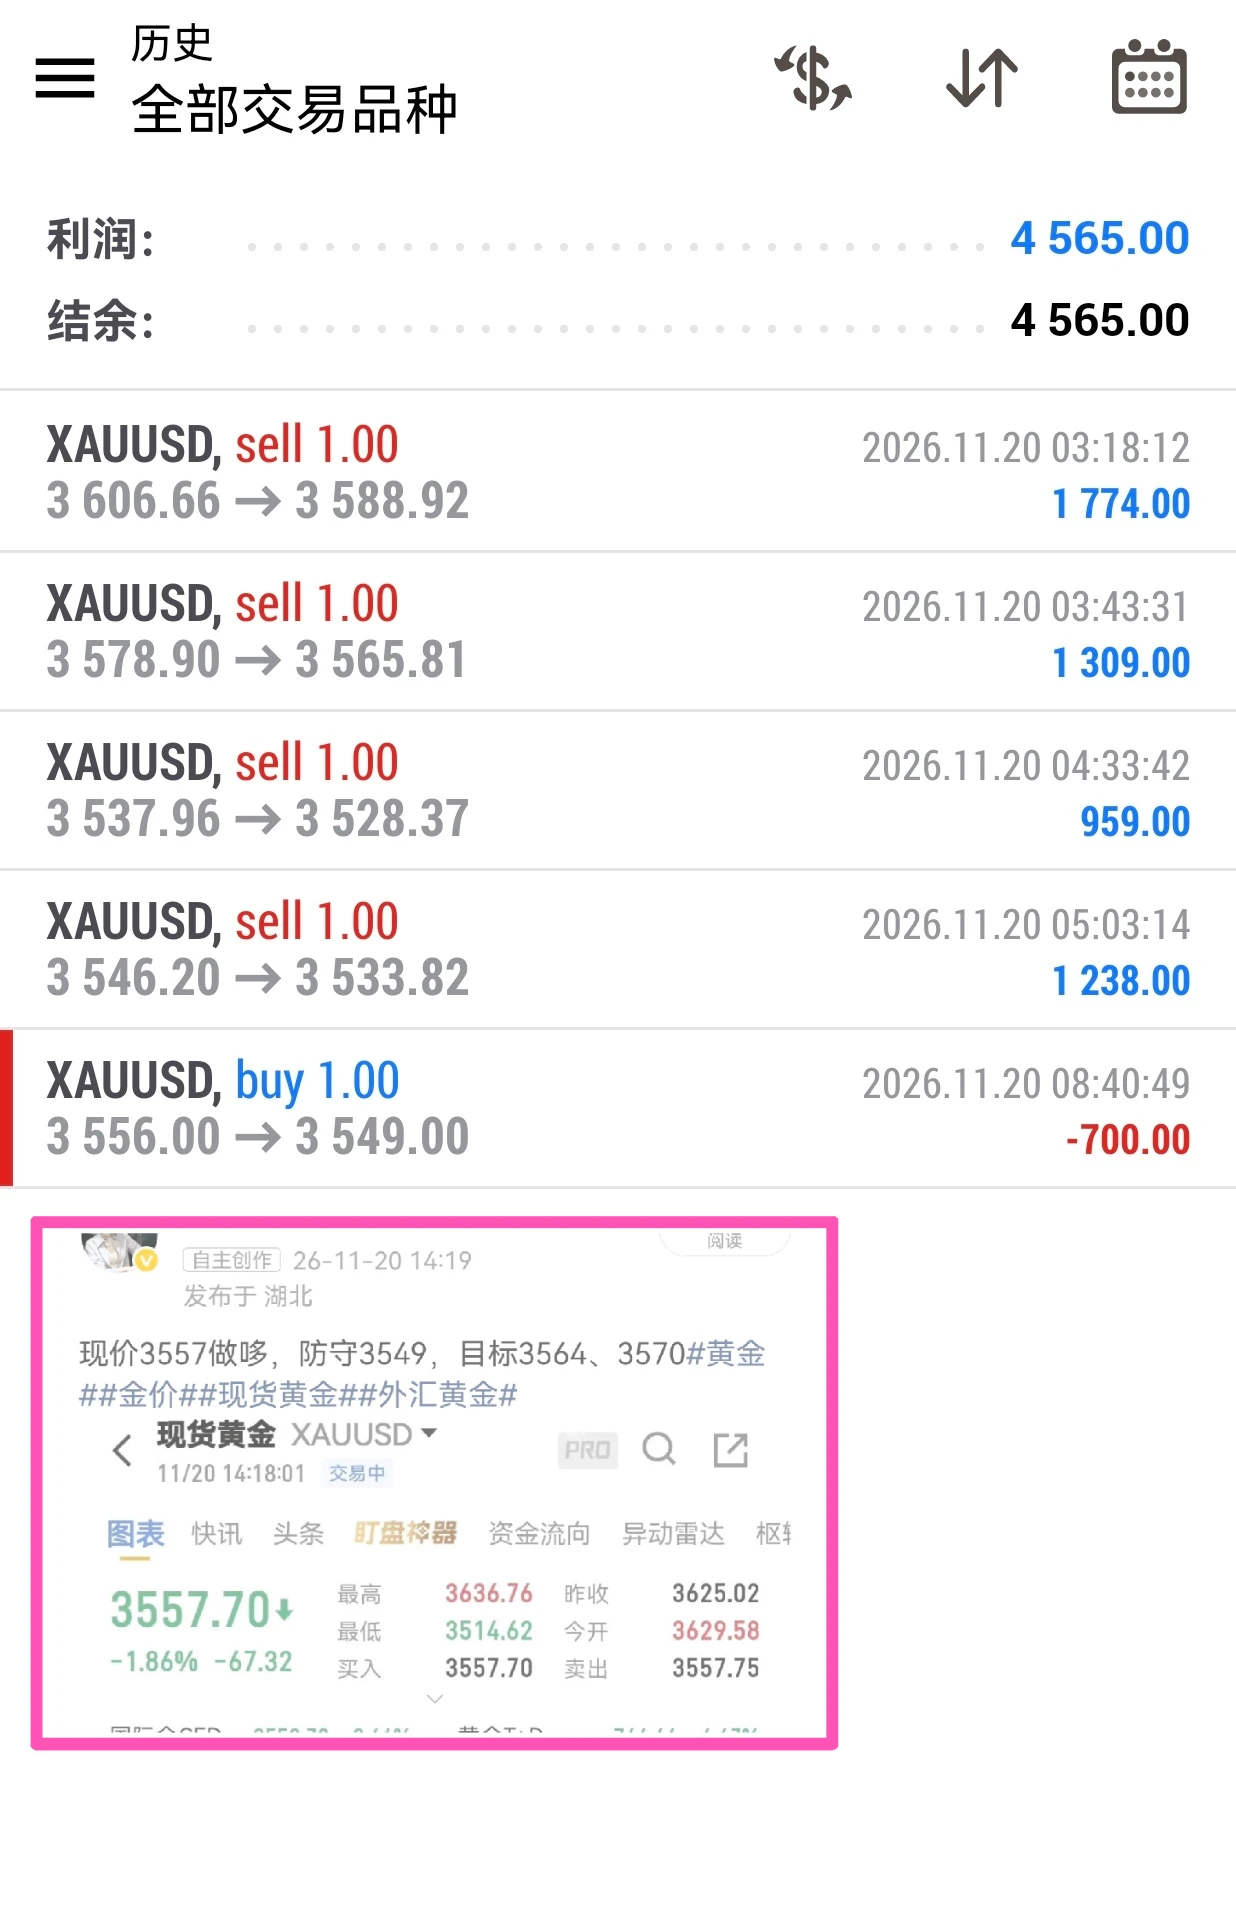
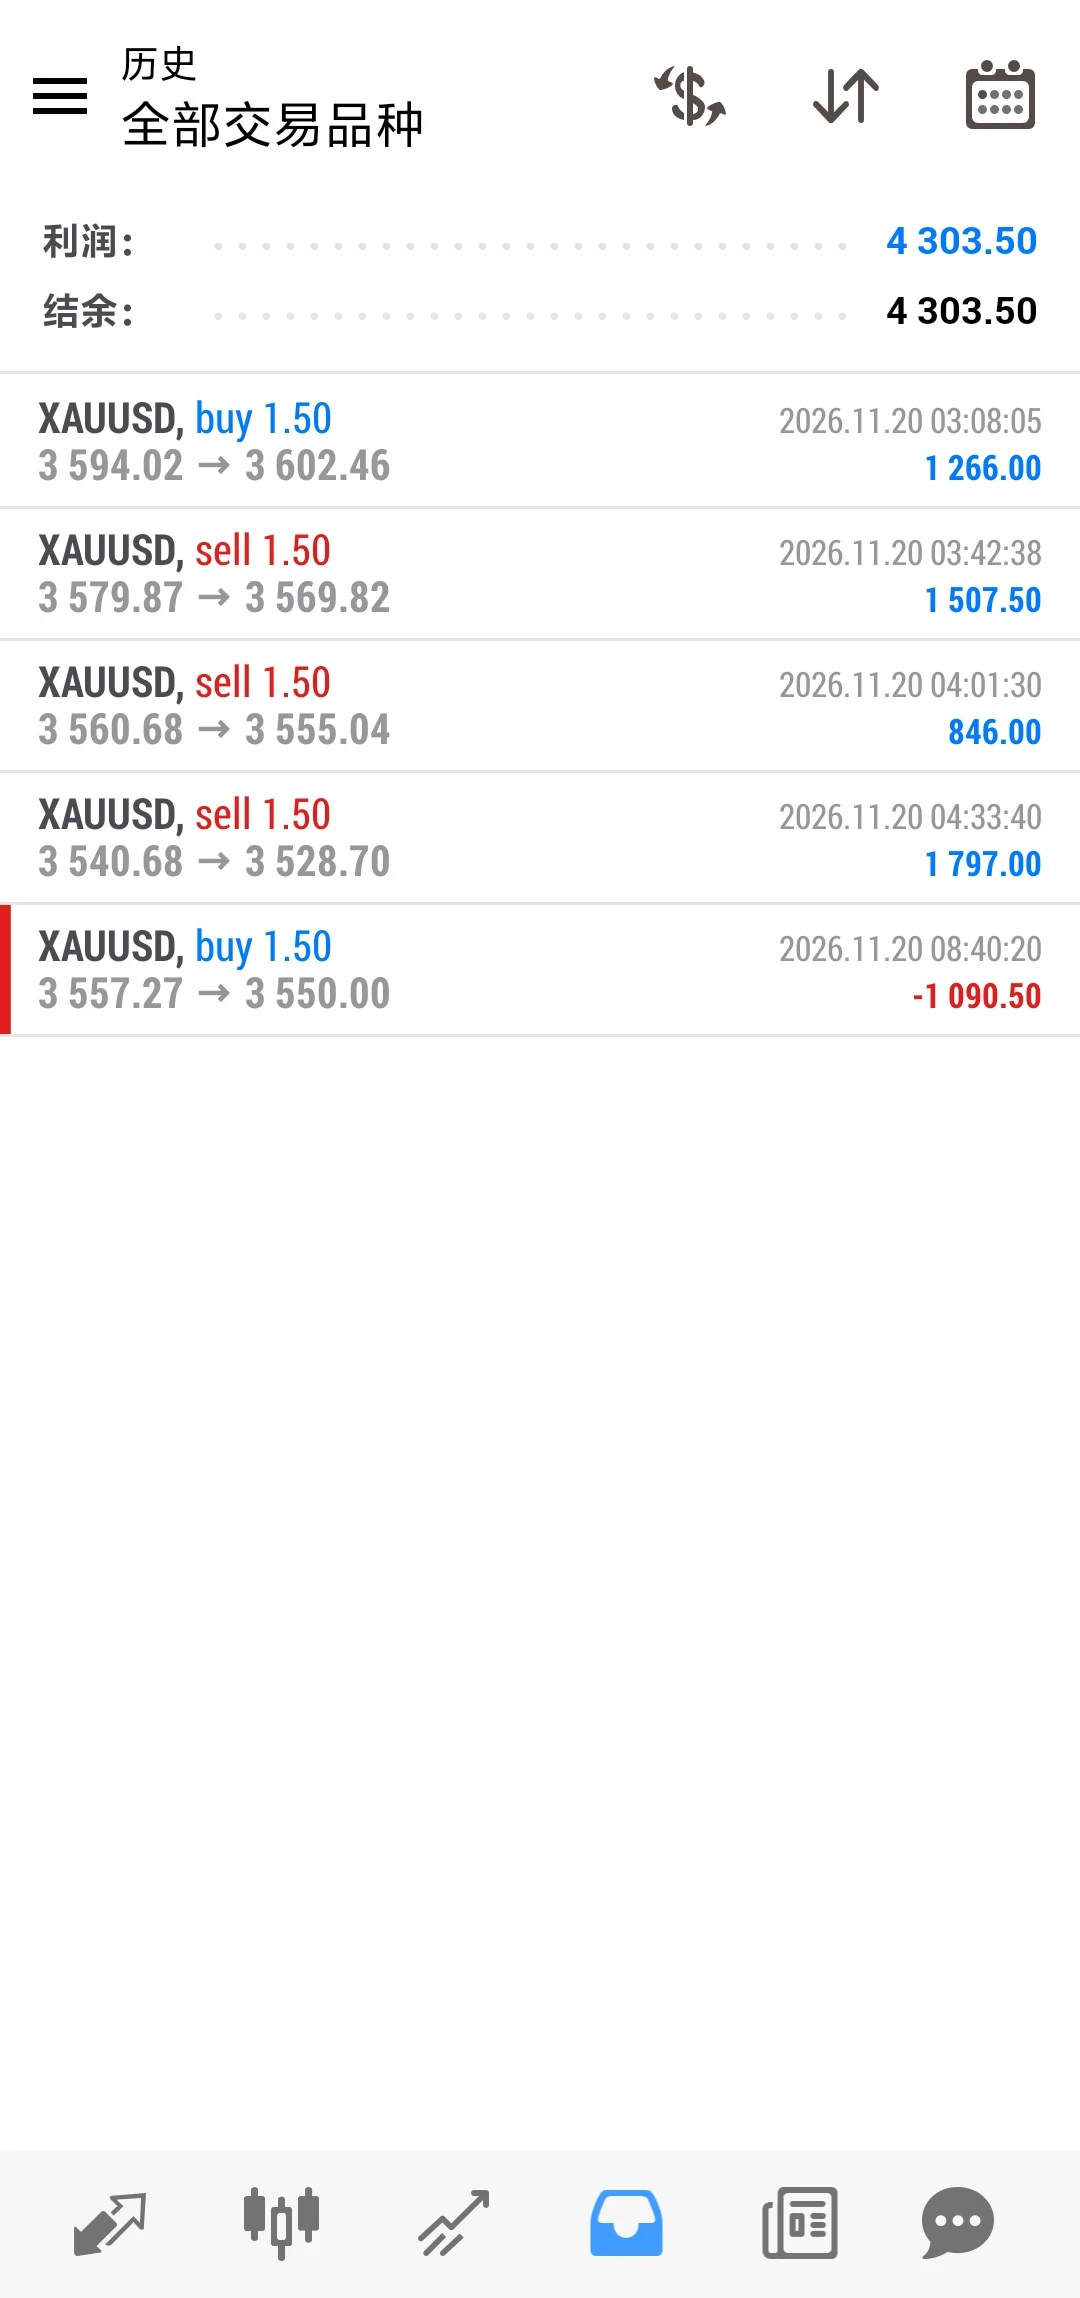
Intraday long trade 5️⃣: entered long at 3556, stopped out at 3549, P&L: -700!

The intraday winning streak has come to an end. Was my risk management too weak, or was I too reluctant to take the risks needed to succeed? Or has the market topped, with its midpoint moving lower? Let’s wait patiently for the next market move!
The market has been volatile lately, so don’t rush to buy the dip. Be sure to set a stop-loss on every trade.$XAU #GateLeadsRWAPerpExpansion #黄金 ‌
post-image
XAU+0.38%
Gold’s fifth intraday trade hit stop-loss!
Long at 3557, stop-loss at 3550, -7 points, -1090🔪$XAUT
post-image
XAUT+0.30%
$US30 ‌The Weekend Liquidity Trap: Why Do I Trade When Liquidity is Thin?

Why do I trade when liquidity is thin (weekends, holidays, low-volume pairs)? Because thin order books act as a magnifying glass for institutional intent. When liquidity is thin, it takes far less capital to move the price, meaning "whale wallets" can trigger aggressive stop-loss hunts and liquidation cascades with surgical precision. I trade this environment because the mathematical deviations from fair value become extreme, creating highly asymmetric risk-to-reward scenarios. While retail traders get chopped up in th
US30+0.07%
  • 1
Load More

Join 40 M users in our growing community

⚡️ Join 40 M users in the crypto craze discussion

💬 Engage with your favorite top creators

👍 See what interests you

Trending Topics

GateDirectIPOPhase3ANTAllocates92100Shares

640.3K Views4.5K Discussing

The allocation results for Gate Direct IPO Phase 3 — Anthropic (ANT) — have been announced, with a total of 92,100 $ANT shares allocated. Successful participants can check their accounts and review their subscription results. Did you secure an allocation this time? Share your subscription experience and allocation result on Gate Square!

USNOVJoblessClaimsBeatExpectations

169.3K Views1.2K Discussing

FedMayNeedA50bpRateHike

412.3K Views3K Discussing

View More